
Objective Loudspeaker Measurements to Predict Subjective Preferences?
Revel Speaker in Anechoic Chamber
As a home theater review based website, our resources are quite limited in terms of accurately measuring loudspeaker performance. This is pretty much a universal problem among most loudspeaker manufacturers and ALL AV review publications (even Soundstage who has access to the Anechoic Chamber at the NRC). Though, admittedly they arguably have the most consistent loudspeaker measurements as far as review publications go thanks to the employment of an anechoic chamber. However to date nobody to my knowledge has been able to measure loudspeaker distortion in terms of how it relates to audibility and preference. Instead, most are still measuring a loudspeaker's non-linear distortion as if it was an amplifier. This is in my opinion wrong but goes beyond the scope of this article.
Anechoic chambers are the ideal acoustical space for measuring loudspeakers allowing the true measurements of the loudspeaker to be assessed without the influence of the room getting in the way. I often argue a loudspeaker engineer or reviewer can still get an accurate assessment of loudspeaker performance if they know how to properly gate the measurements in-room above the room transition frequency (>300 Hz in most cases) and then splice that data with groundplane measurements for the lower frequencies. Be warned, this is no trivial task and much easier to get wrong than having access to an anechoic chamber to conduct the measurements.
With that said, we devised a loudspeaker measurement standard that our reviewers use to approximate anechoic data to more accurately and consistently compare loudspeaker performance. This is a good start and better than what most reviewers are using in our industry.
However, as Audioholics, we demand perfection whenever possible. The fine folks at Harman headed by industry vets like Dr. Floyd Toole and Dr. Sean Olive came up with a VERY accurate way of objectively measuring loudspeaker performance using an anechoic chamber and spinoroma data. These measurements not only allow for direct apples to apples comparisons between loudspeakers but also gives them a 0.86 correlation coefficient of determining listener preference too. This .86 number yields a confidence level of p = <0.0001 which is impressive but the data set is limited to only 70 loudspeakers (circa 2004). It's far from perfect but still better than anything anyone else has done to date.
In a nutshell, if a speaker exhibits flat and linear on-axis frequency response with consistent off-axis performance to preserve critical early reflections, then the speaker will score very highly in blind listening tests and also provide more consistent performance from room to room. The speaker must also be free of pesky resonances and the transition between drivers must be as seamless as possible, hence why waveguides are an essential part in most Harman loudspeaker products. The waveguide not only increases sensitivity at lower frequencies, but allows the high frequency driver (aka. the tweeter) to match directivity of the midrange at the critical crossover region.
How Does Harman Measure Loudspeaker Performance?
Their process is quite thoroughly described in ANSI/CEA-2034. It is now not just a Harman measurement technique, but a national/industry standard method. However most of our readers don't have access to this information so I thought it would be useful to summarize it in this editorial borrowing the following text from “Sound Reproduction: Loudspeakers and Rooms” by Dr. Floyd Toole (Focal Press 2008). This is recommended reading for those wanting to dive deeper into this topic.
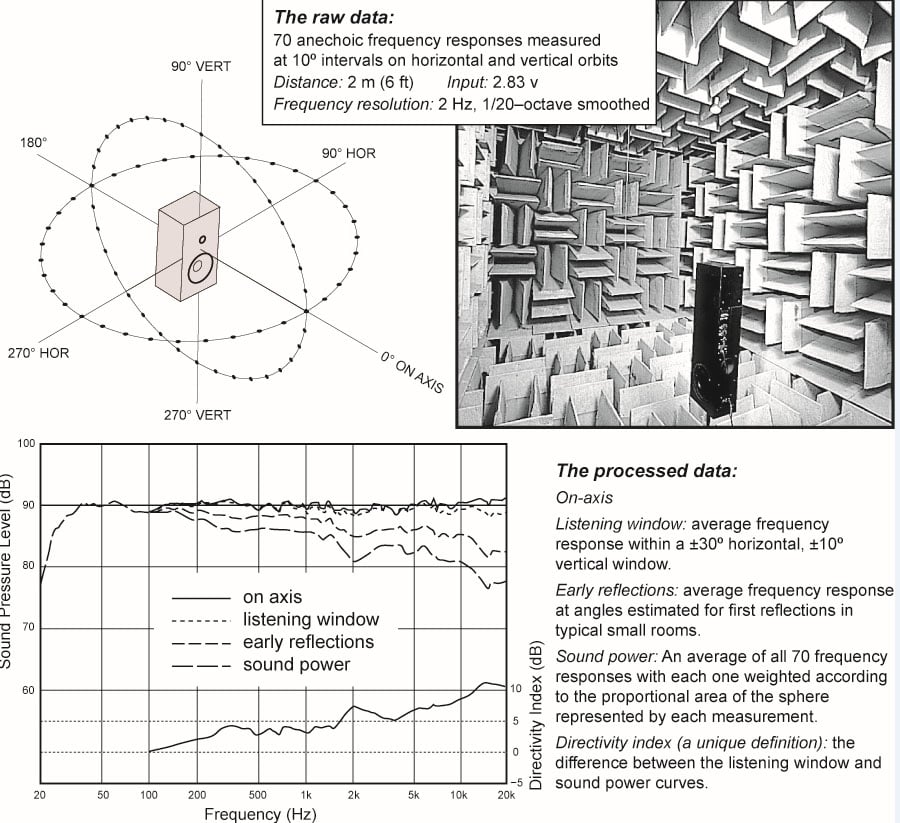
Figure 18.6 The Data Collecting System used by Harman International
“Improved
Data Gathering and Processing
This figure (Figure 18.6
in Toole, 2008) describes the data-gathering system at Harman International,
Northridge, California. It incorporates a computer-controlled rotating platform
upon which the loudspeaker is placed on its bottom to measure the horizontal
orbit at 10 degree intervals and then on its side to measure the vertical
orbit. The height of the platform is adjusted to bring the reference axis to
the same point. The data for the 70 frequency response curves have a frequency
resolution of 2 Hz, the curves are 1/20-octave smoothed, and the anechoic
chamber is anechoic (+/-0.5 dB, 1/20-octave) from 60 Hz to beyond
20 kHz and has been calibrated to be accurate (+/-0.5 dB,
1/10-octave) from 20 to 60 Hz. The vertical scale has been adjusted to
show the sound level corrected to the standard 1 m distance so sensitivity
can be read directly.
The family of curves shown in the lower half of the figure is the set of data calculated to describe sounds that might arrive at a listener’s ears in an average room. All of the data are based on the selection of a reference axis, the axis along which the on-axis curve is measured. Normally this has a point of origin between the tweeter and midrange drivers, and it extends perpendicularly outward from the front baffle. It is possible for a manufacturer to specify any axis as its reference, but logically it would be the line that, if extended into the listening room, would come close to a seated listener’s ears. These are the curves:
On-axis frequency response: the universal starting point, and in many situations it is a fair representation of the first sound to arrive. However, as shown in a survey, over half of those investigated had the prime listening position 10 to 20 deg off axis. Hence, a justification for the following measure.
Listening window: a spatial average of the nine frequency responses in the +/-10 deg vertical and +/-30 deg horizontal angular range. This embraces those listeners who sit within a typical home theater audience, as well as those who disregard the normal rules when listening alone. Because it is a spatial average, this curve attenuates small fluctuations caused by acoustical interference, something far more offensive to the eye than to the ear, and reveals evidence of resonances, something the ear is very sensitive to: interference effects change with microphone position and are attenuated by the spatial averaging, whereas resonances tend to radiate similarly over large angular ranges and remain after averaging. Bumps in spatially averaged curves tend to be caused by resonances.
Early reflections curve: an estimate of all single-bounce, first reflections in a typical listening room. Measurements were made of early reflection “rays” in 15 domestic listening rooms. From these data, a formula was developed for combining selected data from the 70 measurements to develop an estimate of the first reflections arriving at the listening location in an “average” room. It is the average of the following:
— Floor bounce: average of 20, 30, 40 deg down
— Ceiling bounce: average of 40, 50, 60 deg up
— Front wall bounce: average of 0, +/-10,+/-20, +/-30 deg horizontal
— Side wall bounces: average of +/-40, +/-50, +/-60, +/-70, +/-80 deg horizontal
— Rear wall bounces: average of 180 deg, +/-90 deg horizontal
The number of “averages” mentioned in that description may make it seem as though anything useful would be lost in statistics. However, this turns out to be a very useful metric. Being a substantial spatial average, a bump that appears in this curve, and in other curves is clear evidence of a resonance.
Sound power: is intended to represent all the sounds arriving at the listening position. It is the weighted average of all 70 measurements, with individual measurements weighted according to the portion of the spherical surface that they represent. Sound power is a measure of the total acoustical energy radiating through an imaginary spherical surface with the radius equal to the measurement distance. Thus, the on-axis curve has very low weighting because it is in the middle of other, closely adjacent measurement points (see the perspective sketch at the top of the figure), and measurements further off axis have higher weighting because of the larger surface area that is represented by each of those measurements. Ideally, such a measurement would be made at equally spaced points on the entire surface of the sphere, but this simplified spatial-sampling process turns out to be a very good approximation. The result could be expressed in acoustic watts, the true measure of sound power, but here it is left as a sound level, a frequency response curve having the same shape. This serves the present purposes more directly. Any bump that shows up in the other curves and persists through to this ultimate spatial average is a noteworthy resonance.
Directivity index (DI): is defined as the difference between the on-axis curve and the sound-power curve. It is thus a measure of the degree of forward bias—directivity—in the sound radiated by the loudspeaker. It was decided to depart from this convention because it is often found that because of symmetry in the layout of transducers on baffles, the on-axis frequency response contains acoustical interference artifacts, due to diffraction, that do not appear in any other measurement. It seems fundamentally wrong to burden the directivity index with irregularities that can have no consequential effects in real listening circumstances. Therefore, the DI has been redefined as the difference between the listening window curve and the sound power. In most loudspeakers, the effect of this choice is negligible, but in highly directional systems it is significant because the listening window curve is lower than the on-axis curve. In any event, for the curious, the raw evidence is there to inspect. Obviously, a DI of 0 dB indicates omnidirectional radiation. The larger the DI, the more directional the loudspeaker in the direction of the reference axis.”
What About Impedance and Sensitivity?
Many loudspeaker companies and reviewers gloss over this aspect of loudspeaker design. Much can be determined about a loudspeaker just by looking at its impedance curve. This is discussed in the article Loudspeaker Impedance and Sensitivity. While you can't determine the sound of a loudspeaker with these measurements, they are important to know when choosing an amplifier to mate with the speakers. For this we refer to the IEC 26-8 specification for measuring and specifying loudspeaker impedance which must maintain 80% of its DC resistance measurement. This means if a speaker is specified to be 8 ohms nominal, the impedance must not dip below 6.4 ohms for the entire bandwidth (20Hz to 20kHz). For a 4-ohm speaker, it should not dip below 3.2 ohms.

RBH Sound SX-8300/R 4 Ohm Rated Speaker Passing IEC Specification
Making all things fair when measuring loudspeaker sensitivity, it is better to find the average SPL from 300Hz to 3kHz representing the mid-band of a typical full range loudspeaker. This should be done in the acoustical far field, typically 2 m or more for domestic loudspeakers, and calculated back to the 1-meter reference distance. The input should be 2.83v because power amplifiers are essentially constant-voltage sources (the output voltage remains very constant in spite of changing loudspeaker impedance). The traditional 1-watt input spec some manufacturers still use is not reliable because impedance varies with frequency; it is an obsolete specification.
With this data in hand, you now know how loud and how difficult a load a loudspeaker will be when comparing products to more accurately determine which is a better match for your room size and amplifier rating.
Conclusion
The above measurements are focused on evaluating sound quality in real rooms. They can be used to predict subjective ratings of sound quality and to estimate what might be measured at the listening location in a typical room. This is all very helpful, but more measurements are needed to examine power handling, distortion at various sound levels, power compression, etc. One could argue that if a loudspeaker doesn’t sound good then the other measurements don’t matter much. So, being able to predict sound quality is a tremendous help in making an informed purchasing decision.
Wouldn't it be nice if we could have ALL loudspeaker companies comply to this minimum set of measurements when publishing data on their products? Per Toole, "in reality you get more useful information off the sidewall of a car tire than you do on most loudspeaker manufacturer websites." As consumers, we should demand more info from our favorite loudspeaker companies. Perhaps this is a call to action. Let them know you read this here!