
Audio Measurements: The Useful vs. the Bogus in Consumer Audio
You cant Truth
Originally Published: April 07, 2011
It's every audiophile's dream to own a loudspeaker that measures ruler flat from 20Hz to 20kHz. It's not uncommon for the audio magazines to regurgitate the manufacturers claims either in text or with measurements to emphasize product positives. It's my belief that most of the manufacturers and audio magazines aren't flat out lying or being deceptive as much as they aren't giving you the whole story likely because of lack of proper measurement facilities or techniques at their disposal or a combination of both.
It's easier to furnish pretty graphs because quite frankly to paraphrase Jack Nicholson "you (consumers) can't handle the truth". In most cases these measurements do have a grain of truth if you place a lot of conditions and caveats on them that are often not disclosed. In this article and recently related YouTube Video discussion we explore various measurement and graphing techniques.
Can you handle the truth? If so, read on...but before you do, we recommend checking out our recently added YouTube video discussion on this topic at hand for further insights
Measurement Manipulation in the Audio Industry YouTube Video Discussion
Frequency Response
Let's start with frequency response. The intention is that this should tell us something important about how a loudspeaker might sound in a room. If so, we will need a whole collection of curves, describing the direct (first) sound to arrive at our ears, and then others to describe sounds that are reflected by walls, floor and ceiling, reaching our ears a bit later. While this is demonstrably true, long ago the industry decided that a single curve, the on-axis curve describing the direct sound, was all they would show us. One can understand this because the on-axis curve is typically the best looking of all the curves one can measure, and one always wants to look good, right?
The standard SPL amplitude vs Frequency response graph we are all so used to seeing when looking at measurements of loudspeaker and subwoofers is supposed to show us the linearity of the speaker under its bandwidth of operation.
Below are measurements of two loudspeakers. Take a look at the graphs and ask yourself which speaker you would prefer assuming the goal is the most accurate and "linear" frequency response from 20Hz to 20kHz.
Scaling
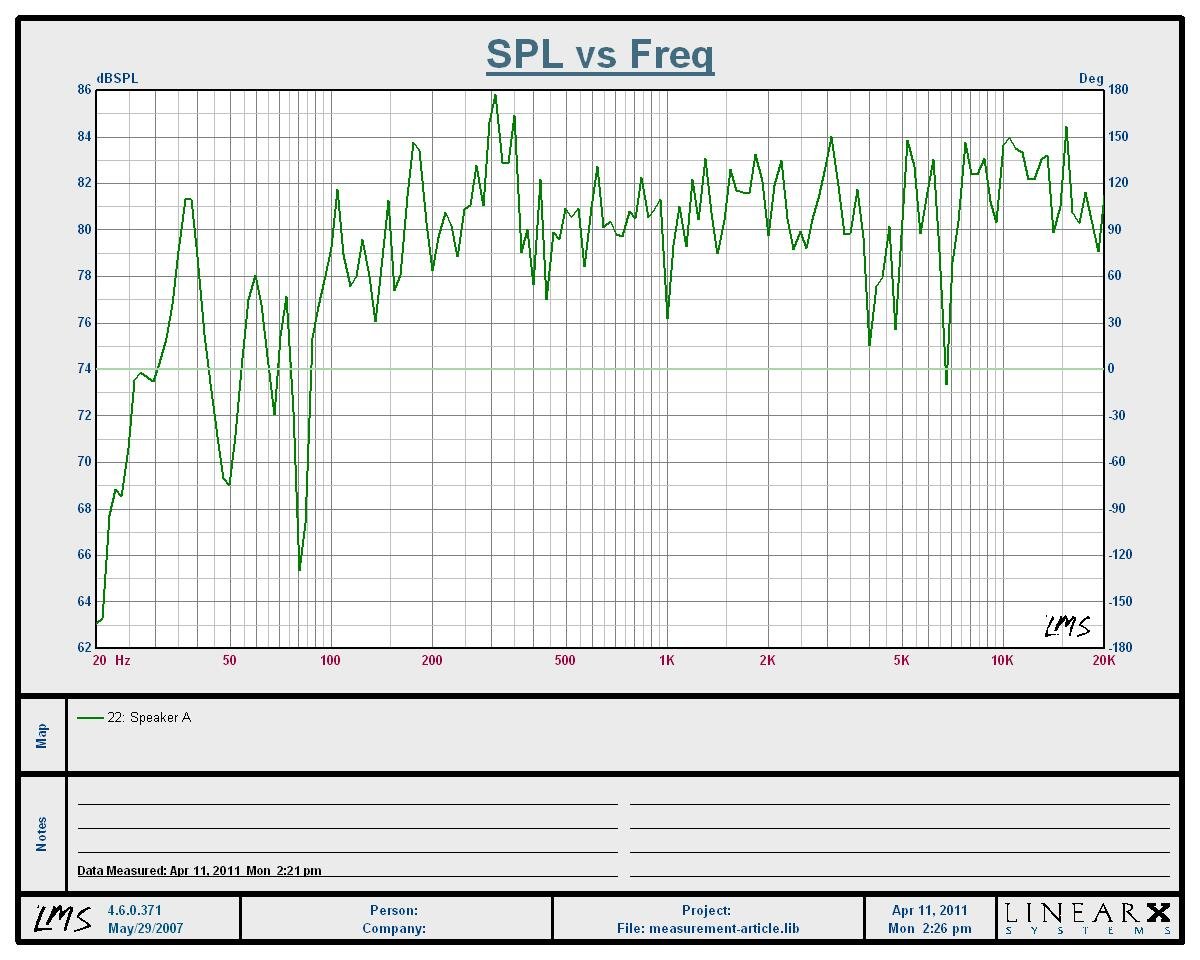
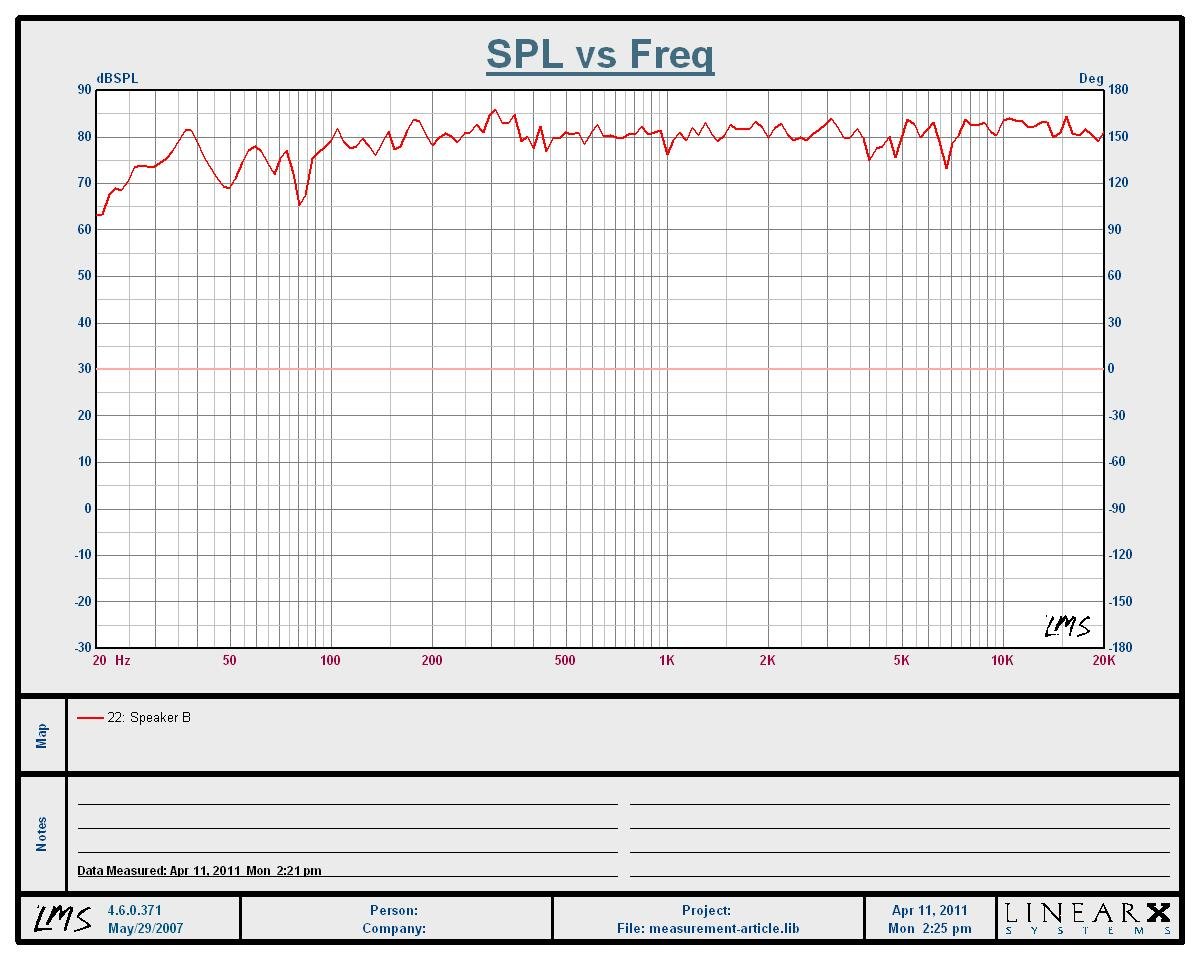
SPL vs Frequency Response of SPKA (left pic); SPKB (right pic)
After looking at the graphs, surely most consumers would prefer SPKB because the measurement is much flatter and smoother . Truth be told you are looking at the exact same speaker and the exact same graph. The difference is actually in how I chose to display the data collected, but be assured, the data is exactly the same in both curves. The measurement was taken in-room 8 feet away from my right front reference speaker (RBH Sound T-30LSE). The measurement was not time gated and thus taken steady state so the room influenced the measurement. The only difference between these two above graphs is the dB scaling, which is the vertical axis. The SPK A graph has a 24dB scale in the vertical axis while SPK B has a 120dB scale (known to engineers in the business as the marketing curve). The larger the scale (dynamic range) in the vertical axis, the less detail you see about the measurement. I can't tell you how many so called "professional" reviews I see on other A/V websites and print publications that use 120dB or greater scales to give the illusion of a smooth linear response for the speaker they are reviewing. We personally like to use 60dB scales for all of our loudspeaker measurements and often use smaller vertical scales if we want to zoom in on a problem area. (Most engineers use either a 40 or 50dB log scale for displaying data. This goes back to (possibly precedes) the available parts used in the old analog style graphic level recorders made by the sound measurement company, Bruel & Kjaer).The two most popular potentiometers they sold for audio measurements were 40 and 50 dB. You could even slow the measurement speed down on the old B&K plotters, effectively smoothing the printed plot to yield a nicer looking graph.
Resolution & Smoothing


SPL vs Frequency Response of No Smoothing (left pic); 1/3 Octave Smoothing (right pic)
Here we have the same speaker, same measurement again with the scale set to 60dB. The left pic is not smoothed while the right picture uses 1/3 octave smoothing. In order to get an accurate measurement, it's important to have a large enough collection of data points in the measurement, else the finer details will be missed and the overall measurement may not reveal the problem areas of the speaker under test.
Why not use 1/3rd Octave Resolution?
 It’s a
common misconception that 1/3rd octave spectral analysis is a good enough
approximation of the perceptual critical bands over the mid and high frequency
range. Some have argued that our hearing
discernability is limited to this resolution.
In reality, these bands define the bandwidth over which spectral
information is summed for estimates of loudness and in the simultaneous masking
of tonal signals by broadband noise (see: Toole, CH19, pg450). Within these bands the beats from multiple
tones influence the perceptual quality of "roughness". Differences in roughness contribute to the
distinctiveness of sounds and timbre. 1/3rd
octave smoothed measurements mask associated performance issues in speakers
which is why according to Dr. Toole higher resolution is needed (1/20th octave
in the frequency domain) to really get a better picture of the loudspeakers
true response. Since the majority of our
loudspeaker measurements are done in-room, we typically use 1/12th octave
smoothing which isn't perfect but does give you a much better idea of speaker
performance than the typical 1/3rd octave resolution graphs found in most print
and online A/V magazines. Loudspeaker designers typically use higher resolution
measurements in their design process for troubleshooting purposes.
It’s a
common misconception that 1/3rd octave spectral analysis is a good enough
approximation of the perceptual critical bands over the mid and high frequency
range. Some have argued that our hearing
discernability is limited to this resolution.
In reality, these bands define the bandwidth over which spectral
information is summed for estimates of loudness and in the simultaneous masking
of tonal signals by broadband noise (see: Toole, CH19, pg450). Within these bands the beats from multiple
tones influence the perceptual quality of "roughness". Differences in roughness contribute to the
distinctiveness of sounds and timbre. 1/3rd
octave smoothed measurements mask associated performance issues in speakers
which is why according to Dr. Toole higher resolution is needed (1/20th octave
in the frequency domain) to really get a better picture of the loudspeakers
true response. Since the majority of our
loudspeaker measurements are done in-room, we typically use 1/12th octave
smoothing which isn't perfect but does give you a much better idea of speaker
performance than the typical 1/3rd octave resolution graphs found in most print
and online A/V magazines. Loudspeaker designers typically use higher resolution
measurements in their design process for troubleshooting purposes.
Smoothing is typically not needed for nearfield measurements, or those done in anechoic chambers since the room is taken out of the picture and loudspeaker performance can be assessed without the normally significant influence the room plays on the sound which reaches the listener. Smoothing is a useful technique for in-room measurements which if not abused can still produce a relatively accurate performance graph of the speaker while removing many of the room reflections and their substantial influence on what we hear in the real world. This is known as smoothing by spectral averaging, which can be interpreted as we know exactly where we measured it but we are not sure what we measured. The alternative technique is to use spatial averaging which is very useful when measuring in the near field (1-2 meters typical) of a complex source, aka a loudspeaker system, where we know that there will be acoustical interference errors. So, what we do is make a few high resolution measurements at slightly different angles and average them. This can be interpreted as we have a very good idea of what we measured, but we are uncertain as to exactly where in space it applies. In loudspeaker measurements the latter is actually more useful and something we plan on doing more of for our in-room loudspeaker measurements. We (reviewers/manufacturers) have long relied more on the “listening window” data for direct sound estimates than on the solitary “on axis” response.
If it looks to good to be true, it probably is!
Some A/V publications go so far as to draw a ruler flat line graph in Excel to represent frequency response while some manufacturers publish simulated frequency responses that they modeled for their product. If a graph looks too smooth or flat it's more than likely not a very useful or accurate representation of actual product performance but instead a great sales tool for the marketing department.

Velodyne SMS-1 Frequency Response Graph
Be careful with measurement devices such as the Velodyne SMS-1 whose output is limited to 1/3 octave resolution. This resolution is too crude for performing any type of high Q room correction as the measurement system will likely miss those room modes (in-room peak) and nodes (in-room dip) in the frequency response sweeps. Such low resolution measurement systems do a poor job of seeing the higher Q problems which typically plague rooms, and need to be removed with a scalpel, not a saw. It's important to have enough resolution to accurately dial in the response. It is recommended to instead use an external measurement device with at least 1/12th octave resolution for fine tuning of bass response or limit your corrections to very low Q adjustments. The frequency response scale of your RTA should be set to plot between 10Hz to 200Hz with a maximum of 60dB vertical dynamic range to get a clear picture of what is going on with your systems bass response.
Editorial Note about Calculating Q
For more advanced users utilizing subwoofers with built in equalization and or adjustable subsonic filters and crossover slopes, you may consider manipulating one sub at a time to better tune in your response but there is a lot of guess work by doing so don't waste a lot of time tweaking if you aren't seeing measurably better results.
For example, if you have a measurable bass peak centered at 40Hz that is 10Hz wide, you can setup an EQ band of 40Hz with a Q of 4 to reduce this problem.
Where Q = fo / BW ; fo = center frequency and BW = bandwidth
To determine BW, mark -3dB high (f2) and -3dB low point (f1) of the problematic mode and subtract F1 from F2. Once you have that number, use that for the denominator and the center frequency (fo) of the peak or dip for the numerator and you will find the Q. (Note: This mathematical method works better for high Q and high amplitude resonances than it does for low Q low amplitude peaks and dips.)
Editorial Note about Resolution by. Dr. Floyd Toole
1/3-octave resolution is a crude approximation of "critical bandwidths" which represent the bandwidths over which loudness summation occurs. However, within a critical band multiple tones or overtones interact with each other to produce beats and something called "roughness", both of which are important contributors to timbre/sound quality. “This is why we must measure loudspeakers with more detail than is revealed by 1/3-octave resolution, ideally about 1/20-octave.” The engineering reality is that bass room modes behave as minimum phase systems and it is necessary to be able to match the shape of a parametric EQ to a peak so that the resonance is damped, not just turned down. This requires higher resolution data than simple 1/3rd octave.
Audio Measurement Techniques
Anechoic Measurements
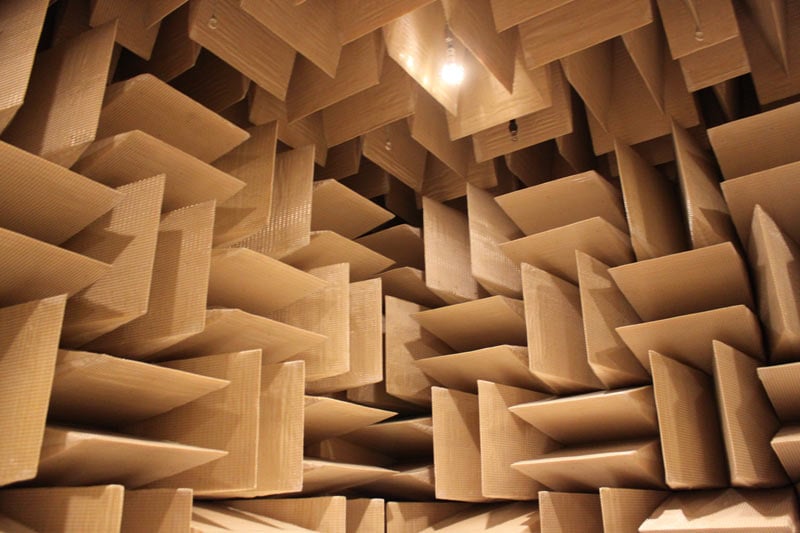 The ideal
way to measure loudspeaker performance is in an anechoic chamber or a room
without reflections. In order to
accurately measure bass frequencies down to 20Hz, such a chamber needs to have
non reflecting surfaces down to 20Hz. The anechoic nature of a chamber is
dictated by the length of the wedges, not the room length though you need large
wedges and hence a large surrounding room as a result. The low cutoff frequency is that at which the
wedge length is about ¼-wavelength. If
the location of the speaker and the mic are known and fixed, it is possible to
calibrate a chamber to be useful to frequencies well below cutoff. A common wedge length is 3 ft, yielding good
measurements down to below 100 Hz. An anechoic chambers accurate down to 20Hz would be costly to
build requiring at least 14ft wedges to yield adequate low frequency absorption. We know of no such chamber. The anechoic chamber pictured here is from Microsoft.
The ideal
way to measure loudspeaker performance is in an anechoic chamber or a room
without reflections. In order to
accurately measure bass frequencies down to 20Hz, such a chamber needs to have
non reflecting surfaces down to 20Hz. The anechoic nature of a chamber is
dictated by the length of the wedges, not the room length though you need large
wedges and hence a large surrounding room as a result. The low cutoff frequency is that at which the
wedge length is about ¼-wavelength. If
the location of the speaker and the mic are known and fixed, it is possible to
calibrate a chamber to be useful to frequencies well below cutoff. A common wedge length is 3 ft, yielding good
measurements down to below 100 Hz. An anechoic chambers accurate down to 20Hz would be costly to
build requiring at least 14ft wedges to yield adequate low frequency absorption. We know of no such chamber. The anechoic chamber pictured here is from Microsoft.
Editorial Note about Bass Frequency Measurements by Dr. Floyd Toole
Since most anechoic chambers are not accurate down to 20Hz, being practical people find other ways to measure the low frequencies: ground plane, tower, inside the box, or very close miking. Most good chambers have wedges that are 3 or 4 feet long (cutoff frequencies of about 70 and 90 Hz), which means that at lower frequencies there will be standing waves. The good thing is that they are well damped, and fixed in space. With digital measurement systems one can calibrate the chamber for a known woofer location and a defined mic location - using either tower or ground plane measurements as references, using the same measuring distance of 2 m or more. The proviso is that the calibration works best when the woofer used in the reference measurement has the same directional properties as the one under test. Yes, all woofers are approximately omnidirectional at very low frequencies, but in this particular case, small differences matter. Ports can be especially problematic because they exhibit a velocity component to the radiated sound, and they are often located away from the woofer, thus altering the interaction with the chamber standing waves, and the accuracy of the calibration. This is why it is recommended to use the sound power measurement (the energy sum of 70 measurements in the Spinorama) as the most accurate estimate of bass performance.
By eliminating room reflections from reaching the microphone, the loudspeakers output can be evaluated at a distance sufficient to eliminate errors caused by measurements taken too closely, while at the same time eliminating reflections from the walls floor and ceiling.
Be careful however when looking at anechoic measurements furnished by manufacturers that are ruler flat out to 20kHz. We have found many loudspeakers that allegedly measure flat to 20kHz anechoic tend to produce elevated treble response in real rooms which, depending on program material, can give the subjective impression of a "bright" sonic signature. A straight line from 20Hz to 20kHz doesn't necessarily sound good to our ear (in a real room) but that is a topic worthy of discussion in a separate article as it goes beyond the scope of this one. Suffice it to say a number of experts on sound believe the axial (zero degree) response of a loudspeaker is a starting point that doesn’t give us information about the polar (off-axis) response. This data is critical in order to anticipate how a loudspeaker will play in a real room.
The reality of listening to loudspeakers in real rooms is that the majority of sound which reaches our ears is reflected, and not direct sound. As a result, the room plays a vital role in determining the sound which our ear-brain mechanism responds too. Listening in an anechoic chamber is invariably referred to as dry and uninteresting. It may be that a measurement of a loudspeaker in a completely non-absorbent room, is going to give us a much more accurate picture of what we will hear in a real live listening environment.
This response is sometimes referred to as the loudspeakers Power Response, and includes the output across both the vertical and horizontal axis, or what total power vs frequency is actually delivered into a live room. While our ear-brain mechanism does not weight direct and early sound the same way it interprets later arrivals, a speaker cannot be simply characterized by the zero degree response, which if anything is less representative of what we will hear in real rooms than the response 30 to 45 degrees off each axis (vertical and horizontal).
Alternatives to the Anechoic Chamber
Anechoic chambers are large, expensive facilities and not all manufacturers, and no reviewers have them. So, what can one do to get reliable measurements? One choice is to go outdoors, dodge inclement weather and annoy the neighbors. We just need to get away from reflections so that we can examine what the loudspeaker is radiating.
Steady-state measurements such as swept tones or spectrally analyzed pink noise are common, but in ordinary rooms they generate reflections that corrupt the data. We can move the microphone very close to the loudspeaker, into the acoustical “near field”, but then we are not measuring the same sounds that we would at a normal listening distance.
What we need is a measuring system that allows us to capture the portion of the signal before the first reflections arrive – time gating, or windowing, that results in a quasi-anechoic measurement. This is done by applying an FFT to a time windowed impulse response where the amount of bandwidth resolution has an inverse relationship to the length of the time window (ie. 10ms = 100Hz). The FFT takes the time varying input signal and computes its frequency spectrum. The sacrifice for doing this is lost frequency resolution, especially troublesome at low frequencies. But, with care, in normal rooms, useful data can be obtained above 500-1000 Hz, with the resolution improving at higher frequencies.
Editorial Note About Quasi-Anechoic Measurements by Mark Sanfilipo
Quasi-anechoic measurement means, literally, resembling, usually by possession of certain attributes, a measurement free of echo. Practically speaking, any measurement done in such a way as to exclude the deleterious effects of the acoustics as found in the vicinity of the device being measured could be called quasi-anechoic.
Quasi-anechoic measurement can be done using a number of well known approaches: near-field measurement and time delay spectrometry are two examples. Time-selective techniques, where a defined time window is applied to an impulse response is yet another. Still another approach calls for calibrating a mic to remove the effects of a particular rooms acoustics, at a particular location in the room. This approach is noteworthy for the fact that the lower you workin the frequency spectrum, the better this technique works.
Regardless of which technique you use to achieve quasi-anechoic measurements, there are limitations, in terms of effectiveness, that have to be taken into account. Being mindful of these limitations goes far to ensure you capture accurate amplitude response data.
In the absence of a chamber, or control over the weather and neighbors, we can employ a combination of techniques to obtain useful on- and off-axis full frequency measurements of loudspeakers in small rooms.
In-room Measurements
Great care must be taken both when measuring a speaker this way as well as interpreting the results. Below about 500 Hz in-room measurements are increasingly dominated by the room itself, where the loudspeaker and subwoofer are located, and where the mic is located. There are three separate factors:
- Standing waves/room resonances, that can cause large fluctuations in frequency response at any location, and differing from location to location.
- Adjacent boundary effects where the different distances to the floor, side and back walls cause undulations in the frequency response, and
- (for subwoofers) Solid angle gains, wherein placing a subwoofer on a floor, in a corner can increase its sound output by 9 dB or more in normal HT rooms.
For more information on this topic, I recommended reading Chapter 12 of "Sound Reproduction Loudspeakers & Rooms" by Dr. Floyd Toole
The point to remember is anytime a speaker is placed in a real room, measuring MAX SPL (especially for subwoofers) is virtually a fruitless cause because of room gain and boundary gain both of which have a huge impact of exaggerating the low frequency output capabilities of the speaker or subwoofer. This is typically why more seasoned reviewers will do a combination of quasi-anechoic and summed nearfield measurements to get a better idea of the true loudspeakers frequency response characteristics while also minimizing the room frequency response dependency.
Above the rooms transition band (the point where room modes and standing waves stop dominating the response curve, usually 200-300Hz), the shape of the loudspeakers frequency response correlates fairly closely to the anechoic response minus any floor / ceiling bounce caused by the position of the microphone relative to those parallel surfaces. Figure 18.9 from Toole, shows a comparison of a 10 ms (100 Hz resolution) quasi-anechoic measurement done in a listening room, and a 2 Hz resolution true anechoic curve. Above about 500 Hz they converge nicely, and at high frequencies there is virtually no difference at all.
Summed Nearfield Response
One method of removing the room while actually measuring a loudspeaker in a room is to do a summed nearfield response. This is where each driver is measured separately within its nearfield (usually within an inch from the center of the cone) and then each response is summed. Care must be taken to ensure only the driver under test is playing while being measured and proper driver summation of all the driver responses in calculated and plotted.
More often than not, reviewers (myself included) tend to botch the summed low frequency response by being overly optimistic in the summation process between the bass drivers and the port(s). Nearfield measurements can be useful as a supplement to in-room or quasi-anechoic measurements to get a clearer picture of system performance without the influence of the room. However, as you reach the frequency where the driver is not a small fraction of the wavelength radiated, the results are less and less reliable. The real problem with nearfield as a measurement method is that it does NOT represent accurately summation in the farfield, or the relative contribution from different sections of the radiating surface or the relative phase between them. To minimize this, it's recommended to place the mike halfway up the cone, instead of dead on the dust cap. The problem in summing is that at the nearfield you CAN'T sum two speakers of different sizes and acoustic centers without a lot of numbers going into a model and a ton of computing power.) This is never discussed in the print magazines that publish ruler straight summed nearfield frequency response measurements.
To illustrate the utility of the parameter chart, we could now, for example, check
both the measured mid-band sensitivity of the system or work up an estimate of
the system’s half-space max dB spl, at a given distance, given a particular
wattage amplifier using the formula:
dB spl =
dBW + Sensitivity (dB) – 20* Log(D2/1m)
Where dBW = 10 * Log(amplifier electric Watts out)
D2 = measurement distance, meters"
For more information on this topic, read: Audioholics Subwoofer Measurement Standard Part I
Groundplane Measurements
Groundplane (or 2pi space) is typically only used for subwoofer measurements but with great care can also be used for fullrange loudspeaker measurements as well. These type of measurements are typically conducted outdoors where the subwoofer is placed on the ground and the mic is located at a fixed distance from the acoustics center of the subwoofer (usually 1 to 2 meters).
This topic is covered in detail via our Subwoofer Measurements Protocol.
For a more in-depth look at various measurement techniques, see
Subwoofer Measurement Tactics: A Brief, Topical Overview & Method Comparison
The bottom line is to know the measurement method a manufacturer or reviewer used when looking at their graphs and attempting to decipher the associated loudspeaker performance.
Audio Measurement Techniques - cont
Distortion & SNR
Distortion is the measurement of the alteration of the original shape of a waveform after it has undergone amplification or conversion from electrical to acoustical output. We typically measure Total Harmonic Distortion + Noise or THD +N. Often you see A/V publications displaying an FFT distortion analysis which shows the fundamental test frequency and the subsequent distortion byproducts or harmonic content. But are their measurements meaningful?
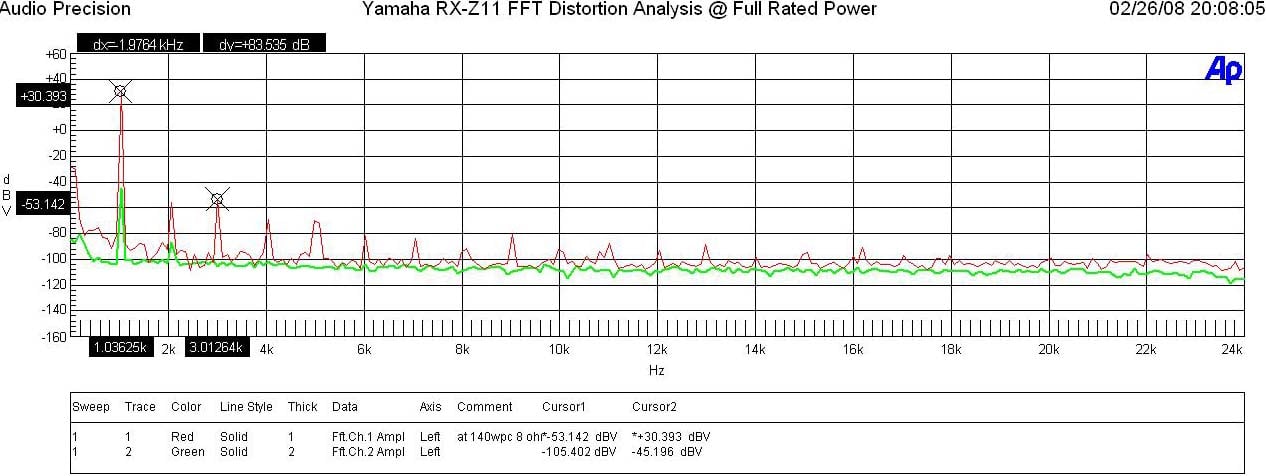
FFT Distortion Analysis of Yamaha RX-Z11 at Full Rated Power
The fundamental test frequency of 1kHz was applied to the receiver driven to near full rated power of 140wpc into an 8 ohm load for this test. You can tell this by taking the level at 1kHz from the graph which is 30.393dbV and converting it to watts as follows:
[10^(dBv#) / 20)]^2 / Rload or in our case 10^{30.393 / 20) = 33.1Vrms => 33.1^2 / 8 = 137 watts.
I often see other review publications publish an FFT distortion measurement they claim to have taken at full power for a 200 watt power amp whose fundamental test frequency is at a level much lower than the rated power. 200 watts into 8 ohms corresponds to about 32dBv, yet the measurement shows a level of 9dBv which is one watt.
For a quick and easy way of converting volts to dBV, use this calculator.
When looking at distortion measurements, it's important to know how they are conducted per the following variables:
- Output level
- Frequency Bandwidth
- Test Signal Used
- Load Impedance (for amplifier measurements)
- Room noise conditions (for acoustical measurements of loudspeakers)
We have seen manufacturer specs on preamps that make a high output voltage claim without specifying load impedance. While the preamp may be able to deliver 2Vrms into a 100kohm load, what about when it's trying to drive a high quality headphone system that is rated at 100 ohms and trying to deliver 1000 times the current? Unless the preamp has output devices capable of delivering current into a 100 ohm load, the subsequent output voltage will most definitely be much less than 2Vrms.
The same holds true when looking at amplifier Signal to Noise Ratio (SNR). Manufacturers typically spec SNR at full power instead of 1 watt. 1 - 3 watts is where the amp spends most of its time when averaged with a long time constant and where low noise is critical for high resolution playback. So if Amp A is rated at 200wpc with an SNR of 105dB while Amp B is rated at 400 watts with 106dB SNR, which amp actually has a lower SNR? To answer this, we must compare apples to apples by scaling back the SNR to the same power level. Let's use 1 watt.
Using V = sqrt(P*R) we can calculate our voltage
Using 20 log (V/2.82) we can scale to 1 watt
Amp A: SNR 105dB @ 200 watts 105dB - 20*log [sqrt(200*8) / 2.82] = 82dB @ 1 watt
Amp B: SNR 106dB @ 400 watts 106 - 20*log[sqrt(400*8)/2.82] = 80dB @ 1 watt
So in reality Amp A has a 2dB advantage in SNR when compared to Amp B at the same power level. This of course also assumes SNR was measured in the same method and with or without weighing.
Output Level
 You
probably won't believe this but what if I told you a 1" dome tweeter can
produce 20Hz? Yes it most definitely can
but there is a caveat; its output level.
At 20Hz, the output level is lower than that of a gnats fart but that’s
all too often an overlooked point in manufacturers marketing literature claims.
You
probably won't believe this but what if I told you a 1" dome tweeter can
produce 20Hz? Yes it most definitely can
but there is a caveat; its output level.
At 20Hz, the output level is lower than that of a gnats fart but that’s
all too often an overlooked point in manufacturers marketing literature claims.
Quite often we see subwoofer manufacturers claim their sub is flat down to 12Hz (a frequency humans can't even hear). Some go so far as to publish a frequency response graph on their website to prove their point. What they don't tell you is that they are using DSP processing to linearize the response of the subwoofer system and its 12Hz extension is only good at vanishingly low output levels which most certainly cannot be felt. If you look closely at their measurement it's typically done at levels between 80-90dB at 1 or 2 meters groundplane. This is especially true with most floorstanding speakers that have a claimed frequency extension of 20Hz yet only have a pair of 6" woofers to reproduce bass frequencies.
Once the levels are driven up however, compression kicks in and severely limits the output abilities of the loudspeaker/subwoofer, especially at the lowest frequencies. So in many cases, the manufacturer is trading SPL for extension solely for marketing purposes as discussed in our article below.
See: Trading SPL for Extension A new Trend in Subwoofers?
We've read many subwoofer reviews where a reviewer is touting the max output of a subwoofer they measured in-room and with no mention of distortion levels or whether or not the sub was producing audible mechanical noise or distress.
This reminds us of a recent subwoofer review from another A/V publication that measured a 10" sub in a small enclosure where they claimed it was outputting 100dB at 18Hz. The caveat was the measurement was taken in-room and at only one foot distance from the driver. If you scale that measurement back to 2 meters (without even removing room gain), that 100dB becomes 84dB which is barely audible, and certainly not as stellar as the reviewer would have its readers believe. 84 dB at 20 Hz is only slightly louder than the background noise found in most living rooms because of the loudness effect of the human hearing mechanism. If you factor out room gain of that measurement, the reality is that sub is likely producing less than 80dB at 18Hz 2 meters away. This is certainly nothing to brag about in a review or subsequent marketing literature but such is the case when dealing with the laws of physics and reality.
The same holds true with power output for amplifiers. Most review publications and manufacturers will provide amplifier output power at 1kHz instead of full bandwidth. They typically run instantaneous power vs distortion sweeps at a single frequency instead of full bandwidth testing into 8 and 4 ohm load impedances and almost never run continuous or dynamic burst power tests to get a true picture of performance. We have found some of the newer Class D A/V receivers simply fell apart when driving a 4 ohm load above 3kHz which doesn't show up with a 1khz power sweep but can surface in real world listening tests using 4 ohm speakers. Several loudspeaker manufacturers informed us they had to do alterations to their 4 ohm speakers in order for these receivers to drive them without shutting down.
We have covered amplifier measurements in detail in prior articles. For information on how we measure amplifiers see:
Audioholics Basic Amplifier Measurement Techniques
The All Channels Driven (ACD) Amplifier Test
Conclusion
As we learned in this article, product performance data can very easily be manipulated to look good and more often than not inappropriate measurement techniques lead to erroneous conclusions about actual product performance. Manufacturers understand the role specifications play in the purchasing decisions made by consumers, and in some cases tell us half-truths for what are purely financial motives.
It's very easy to manipulate loudspeaker response curves and data by:
- Increasing the dynamic range (vertical axis)
- Apply excessive smoothing (ie. 1/3 octave smoothing)
- Incorrectly summing nearfield measurements
- Using low resolution during measurement taking (collecting an insufficient number of data points and then “connecting the dots” to make the product look better than it really is).
- Displaying max output levels taken in-room instead of in a 4pi or 2pi environment to eliminate associated boundary gain and room gain in real rooms
- Displaying max output levels without specifying distortion levels or whether or not the loudspeaker is suffering from audible mechanical noises and/or distress under such testing levels
It's very easy to manipulate amplifier data by:
- Measuring power into 1 discrete frequency only instead of full frequency bandwidth (20Hz to 20kHz)
- Furnishing SNR data without specifying power level or methodology used for testing
- Furnishing preamp output level data without specifying load impedance
- Providing FFT distortion measurements without knowing the true output level the test was conducted at
 Consumers
need to not only understand what measurements represent about product
performance, but how those measurements were taken and how they were
displayed. Take the time to know these
facts before allowing a manufacturers spec sheet or a so called
"professional review" sway your option about product performance on a
product you haven’t experienced first hand for yourself. Measurements are only as useful as measurer's
ability to correctly take and publish them.
Consumers
need to not only understand what measurements represent about product
performance, but how those measurements were taken and how they were
displayed. Take the time to know these
facts before allowing a manufacturers spec sheet or a so called
"professional review" sway your option about product performance on a
product you haven’t experienced first hand for yourself. Measurements are only as useful as measurer's
ability to correctly take and publish them.
Never underestimate the role of politics and marketing plays in a company whose main goal is in achieving sales and boosting the bottom line. Few consumers are willing to spend the time necessary to fully educate themselves on the topic, and the reality is manufacturers know this, and often jury rig the measurements for what they know will be the numbers most likely to be viewed by consumers prior to making a product purchasing decision. Only by understanding the underlying measurements, and asking hard questions will the consumer find the whole truth. Last but not least, do not forget one's own ears are a more reliable arbiter of truth, than salesmen on commission. Make Jack happy by showing him you can handle the truth and you want more than marketing graphs from manufacturers and A/V review publications.
I hope this article sheds some light on this very often overlooked topic.
Acknowledgements
Special thanks to Dr. Floyd Toole, Paul Apollonio and Mark Sanfilipo for their peer review and additions in making this article more complete.
Recommended reading: "Sound Reproduction Loudspeakers & Rooms" by Dr. Floyd Toole
Gene manages this organization, establishes relations with manufacturers and keeps Audioholics a well oiled machine. His goal is to educate about home theater and develop more standards in the industry to eliminate consumer confusion clouded by industry snake oil.
View full profile