
MartinLogan Motion Vision Soundbar Review
MartinLogan Motion Vision Soundbar Review
- Product Name: Motion Vision
- Manufacturer: MartinLogan
- Performance Rating:

- Value Rating:
- Review Date: February 25, 2013 10:15
- MSRP: $ 1499
- Frequency Response: (+/- 3dB) 43Hz to 23,000Hz
- Amplifier Power: 100 Watts (200 Watts peak) combined total output across 7 amps.
- Crossover Frequency: 3000 Hz
- Components & Decoding: DSP based preamplifier, Dolby® Digital, DTS Digital Surround™.
- High Frequency Transducers: Three 1" × 1.4" (2.6cm × 3.6cm) Folded Motion Transducers with 5.25" × 1.75" (13.3cm × 4.4cm) diaphragms
- Low Frequency Drivers: Four 4" (10.2cm) fiber cones with extended throw drive assembly. Non-resonant asymmetrical chamber format.
- Cabinet: Ported
- Controls: Top mounted controls and included remote control.
- Inputs: (2x) Optical SPDIF (digital optical), (1x) Coax SPDIF (digital coaxial), (1x) Analog RCA Right/Left, (1x) AC Power
- Outputs: (1x) Subwoofer Out via analog RCA
- Wireless Output: Built-in SWT-2
Subwoofer Wireless Transmitter compatible with equipped subwoofers. External SWT-2 receiver available for wireless connection to other subwoofers.
- Remote Battery: CR2025 3V
- Power Draw - Max: 120 Watts - Idle: 9 Watts Standby: < 0.3 Watts
- Weight: 20.5lbs. (9.3kg) each
- Overall Dimensions(HxWxD): 5 x 39.9 x 5.85 (12.7cm x 101.3cm x 14.8cm)
Pros
- Excels with music
- Stunning detail and natural sound
- Soundstage extends well beyond soundbar
- Compatible with wired and wireless subwoofer(s)
Cons
- Limited bass controls
- No AirPlay, Bluetooth, or USB
Martin Logan Motion Vision Soundbar Introduction
Love 'em or hate 'em, soundbars (or sound bars) are here to stay. If you already love soundbars, then the MartinLogan Motion Vision will make you fall head over heels. If you hate soundbars, then the Vision will shatter your universe and make you reconsider every decision you have ever made in your life. Okay, that might be a little dramatic; it will at least make you reconsider your stance. The Vision is MartinLogan’s first foray into the soundbar market, but they utilized many of the technologies found in their other Motion series speakers. It represents their effort to create a solution for customers who want high quality sound but don’t have the room for (or don’t want the clutter of) a typical component sound system.
Overview
The first thing you will notice when you take a look at the Vision is that it’s a serious piece of equipment. Most soundbars feel like a toy when you pick them up: thin, light, and made of cheap plastic. The Vision weighs a respectable 20.5 lbs and is 5” H x 40” W x 5.9” D. At nearly 6” deep, the Vision is much thicker than most soundbars, which are designed to be mounted as close to the wall as possible and hand off all bass reproduction to a subwoofer. The added depth means that the Vision might stick out from a wall a little farther than some alternatives, but it also allows MartinLogan to squeeze out some extra bass from the cabinet. With a -3dB point of 43Hz, the Vision can definitely benefit from a subwoofer (more on that later). Even so, I ran it without a subwoofer for almost all of my listening tests and was pretty impressed. Additionally, most subwoofers that come with soundbars, or cheap home theater systems, can only play down to about 40Hz anyway. For people who want to get slapped around by bass, the Vision has a sub pre-out and works wirelessly with the company's Dynamo 1000w and 700w subwoofers. We are a big fan of the ability to hook up an external sub, as this allows greater flexibility so you can buy a subwoofer solution that fits your needs.
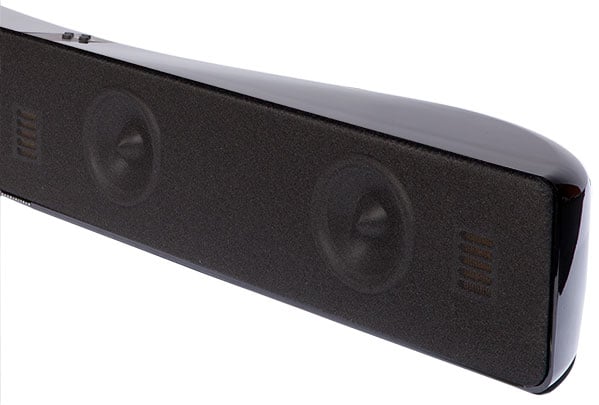
Faded front view of MartinLogan Vision soundbar
The Vision sports three 1” x 1.4” Folded Motion Tweeters and four 4” fiber cones. The arrangement of the drivers is T-M—M-T-M—M-T, with the outside tweeters on the far edges of the soundbar. This arrangement allows for a true left-center-right soundstage without the need for DSP. The Folded Motion Tweeters utilized in the Vision are the exact same that are used in the other Motion Series speakers, including the flagship Motion 40 towers ($949.95/ea) and the Motion 15 bookshelf speakers ($799.95/pr). I liked the Folded Motion Tweeter in my review of the Motion 15’s, so I was pretty jazzed to find out that the Vision had three of them. Each of the seven drivers has an independent digital amplifier, which combined can produce 100 watts (200 watts peak). Wattage ratings without information about a driver’s sensitivity don’t do much good, so let me say this: the Vision plays plenty loud with very little compression or distortion.
MartinLogan Vision Overview Continued
The back of the enclosure has two ports for added bass response. On the back panel are also 2 optical, 1 digital coax, and 1 stereo audio input, as well as an AC jack and 1 subwoofer output. It would have been nice to have HDMI inputs and outputs, allowing the Vision to receive and decode Dolby TrueHD and DTS-HD signals. Sans any HDMI inputs, your best option is optical or digital coax, so the soundbar can decode surround signals. The easiest way to do this is to run all of your sources directly to the TV and take a single optical cable out of your TV into the soundbar. Unfortunately, many TVs will not pass Dolby Digital or DTS through an optical cable (a fact that MartinLogan points out in the manual). Therefore, we recommend connecting any surround compatible sources directly to the soundbar. When the Vision receives an actual surround signal, it uses Dolby Virtual Speaker technology in order to simulate a 5.1 sound system.
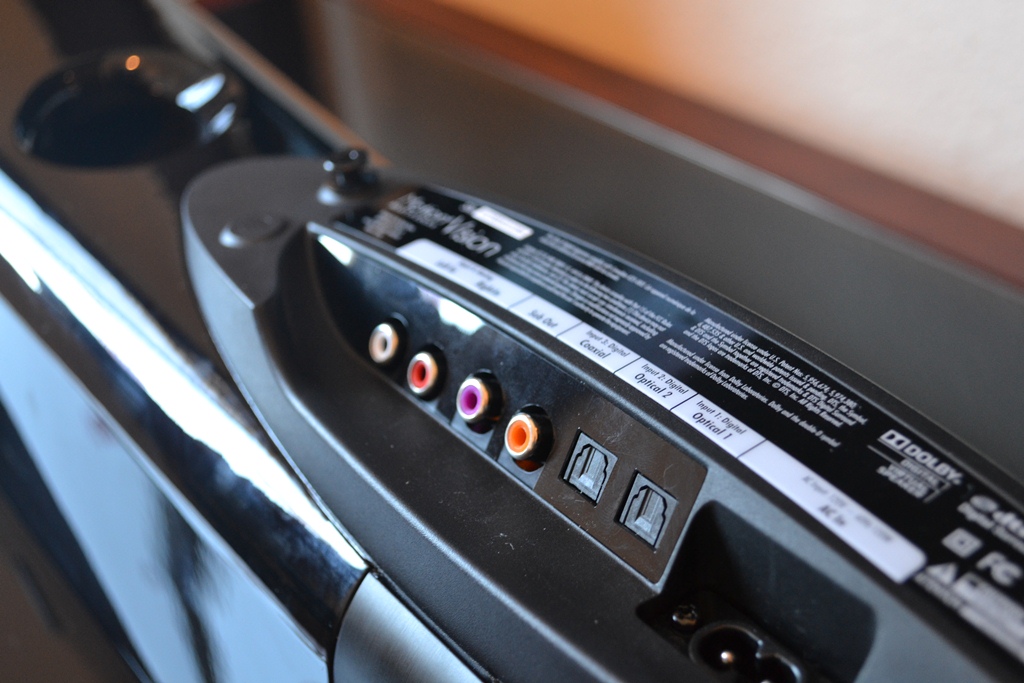
Inputs on back of MartinLogan Vision soundbar
The Vision comes with a wall mount bracket and necessary hardware for mounting. Space is tight, however, so you will have to be pretty precise in order to have the Vision mounted on a wall and still keep all of the cords concealed. This is especially the case with the power cable. Some soundbars utilize an AC/DC power brick, which converts high voltage AC power to low voltage DC power. This is important because it’s against NEC code to simply drop a high voltage power cable inside a finished wall, but it is legal to drop a low voltage cable inside a finished wall provided it's removable and doesn't include the transformer (at least, in most areas, but check your local building codes). MartinLogan must be aware of this because their Motif and Stage speakers are wall mountable and utilize an AC/DC converter to make on-wall installation easy. With all of that said, we can still think of a number of ways to mount the Vision and completely hide all of the wires. If the wall is unfinished on the other side, you could legally run the AC power cable down the wall. You could also pass the power cable straight through the wall and into a closet or adjacent room. Another method would be to mount the soundbar directly below the TV, not leaving any gap, then running the power cord to an outlet located behind the TV. Finally, you could try to install a recessed outlet directly behind the soundbar, but it would be difficult make room for the outlet and the Vision’s mounting plate.
Operation
With a single line LED display, small credit card sized remote, and only 5 buttons on the soundbar itself, operation could have been a nightmare. It was, however, quite pleasant. On the top of the Vision are 4 multipurpose directional buttons that control navigation: volume (up and down), source (left and right), power (hold down left), and menu (hold down left and right). The remote also features power, mute, volume, source, navigation, and three mode buttons (night, normal, bass+). At first, the navigation was a bit confusing, but after I figured out the structure (thanks to an exceptionally well written manual), changing settings was a breeze.
Within the menu there are a number of sound related options. Bass can be adjusted +/- 10dB, simulated surround effects turned on/off, stereo mode changed between normal or voice EQs, sub output enabled or disabled, and installation switched between on-wall or on-shelf. I played around with every combination of settings I could think of during our measurements and listening tests and found that the sound can change drastically with each adjustment. For example, changing the stereo mode from voice + to normal makes a very audible difference, adding more treble to the mix. So, if you have a chance to hear the Vision and aren’t happy with the sound, peruse the settings and you will probably be able to customize it to your liking.
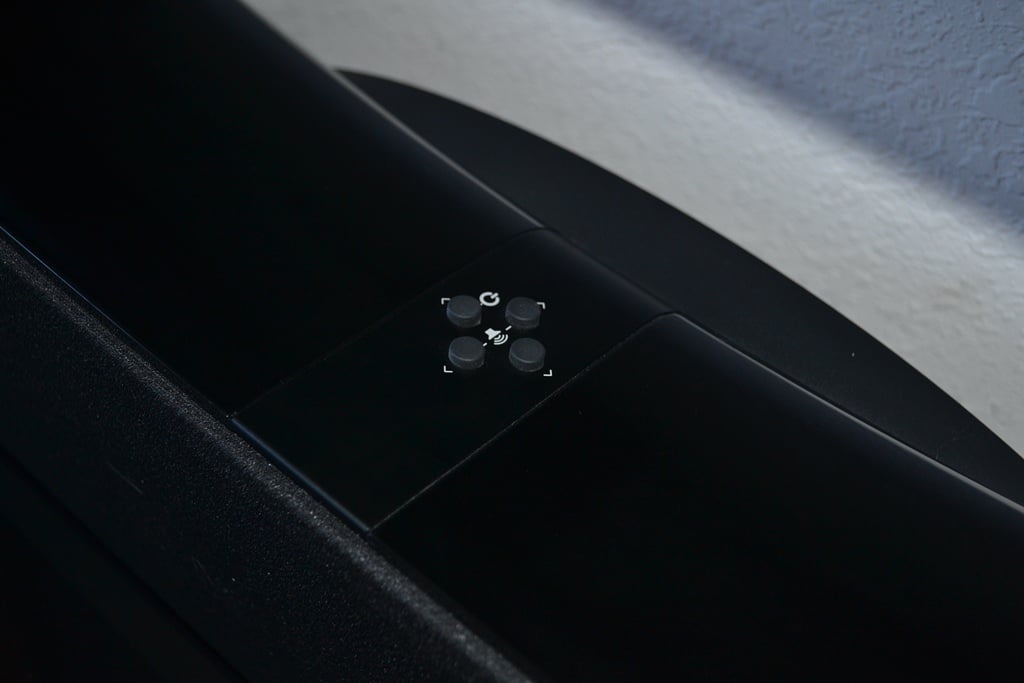
Control Buttons on Top of MartinLogan Vision soundbar
There are also a number of operational settings buried in the menu, such as display (bright, dim, auto, auto bright, audio dim), power (auto, full on), learn (learning commands from another remote), source name (rename sources) and reset. Although the included remote works well enough, credit card sized remotes are easy to lose, and this one lacked any backlight. Consequently, I just programmed the soundbar to work off of my Oppo remote. Learning commands was a breeze—much easier than with most soundbars I've used in the past. The only operational issue I had was the system not always turning on automatically, but that may have been because I was constantly changing settings, and powering on/off by hand and by remote.
MartinLogan Vision Listening Tests
I used the analogue outputs from my Oppo BDP-93 Blu-ray player for music tests and the optical output for movie tests. Once I had the soundbar setup properly, learned commands from my Oppo for control, and had given it substantial break-in time, I was ready to conduct critical listening tests.
CD: The XX - Coexist

Coexist is The XX’s newest album, actually, it’s their second album total. They are a young band, but their sound is clean and refined. One of the key parts of this album is the extended bass, a perfect test for the Vision. And it passed with flying colors, for the most part. During track 2 I literally had to get up out of my seat and go check to make sure no subwoofers were turned on, it was that convincing! The vocal harmonies were clear when listening in normal mode, but were slightly more pronounced in vocal + mode. At times they were a little too bright in vocal + mode. On track 3 the vocals floated at ear level, about 8” above the soundbar. The musicians were planted firmly in the middle of the soundstage, which was great, but I did miss the wide soundstage of my normal stereo setup. Occasionally the soundstage would appear to clearly expand beyond the left side of the soundbar, but that was partially thanks to reflection off a nearby wall. Still, don’t think for a second that the vision presents some tiny sound experience, because it doesn’t. It sounded much more like a closely spaced high-end 2.1 system than any soundbar I have ever heard.
Despite all of the good things, I did have two problems when listening to this CD. First, there was a noticeable humming that would slowly increase and decrease in volume and in cycle rate. I could affect it by adjusting the brightness of the LED display, so I assumed it was some interference issue related to the LED display. I called up MarinLogan and asked them about it. They confirmed that it was an issue with the first run of the product, but it has since been fixed. In short, if you have this issue just contact MartinLogan and they will get you taken care of. This is, according to them at least, not an issue with the current production models and should not be a concern when purchasing the Vision.
The second issue I had was a noticeable mechanical buzz when listening to track 6. This track starts out with really heavy 50Hz bass notes that were a little much for the Vision. I never had the issue with any other tracks I tested, even tracks with just as much bass or at higher volume levels. I contacted MartinLogan about the issue and they had me stop over to their headquarters (only a few blocks from my house) and try out the same track on a Vision setup in their main listening room (after which, I had to ask to listen to their flagship CLX speakers as well, after all, it's my job to be well informed. I queued up the track, and sure enough there was a mechanical rattle. However, I also brought along a few other CDs that had tracks with even heavier bass, and we had no issues. I also talked to a few fellow writers from other publications that have reviewed the Vision, and they never had any issues either. It seems that I found the magical track. As such, it is my obligation to report this issue, but I wouldn’t let it deter you from purchasing the Vision. That is, unless you are a huge fan of track 6 of The XX’s newest CD and absolutely can’t live without it.
CD: The Civil Wars - Barton Hollow

The Civil Wars are one of the greatest folk duos to come onto the scene in recent memory, with powerful vocal harmonies and an honest feel. I focused on tracks 5 and 7. Track 5, "Poison & Wine", starts out with a simple piano, bass guitar, and acoustic guitar, and then John Paul White comes in at about 15 seconds and Joy Williams at 27 seconds. The bass guitar was a little overpowering compared to the rest of the mix, but I was able to attenuate it by switching the soundbar to on-wall installation in the internal menu. Each instrument had a clear place on the soundstage, as opposed to being shoved together in a tight pattern right in the middle. I could hear the guitar pick hit every individual string as it was strummed up and down.
Track 7, "Barton Hollow", starts out with a powerful guitar lick and continues with strong vocals and instrumentation through the rest of the song. Vocals rested right in the middle of the soundstage with what sounded like an acoustic guitar off to the left and an electric guitar to the right. The Vision played back this track with every bit of the authority of a much larger system. Actually, at times it seemed like too much authority. The vocals and bass were a little more forward than I am used to with this track.
PS3 Game: Call of Duty: Modern Warfare 3
After surprisingly great results with music test, I moved onto a completely different type of material, a PS3 game. I rarely use video games to test equipment, but I found that Call of Duty: Modern Warfare 3 was the perfect test for the Vision. The soundtracks and effects in a video game are played over and over every round, so you become used to how they are supposed to sound much more quickly than with a CD or Blu-ray (I also needed an excuse to play Call of Duty). The Vision did a good job with Call of Duty, but the sound stage wasn’t as huge as I was used to, the bass wasn’t as deep or clean, and the surround effects that alerted me when an enemy was behind me were mostly gone. Then I realized that I needed to set my expectations properly. I was going from a full surround sound, where the center channel alone costs more than the soundbar, down to a system where the largest driver is 4”. After I reset my expectations I still wasn’t satisfied, which puzzled me because I was so impressed during my music listening tests. It almost sounded like something was wired out of phase, which it was, sort of. Dolby Virtual Surround manipulates the phase of certain sounds to change where the sound appears to come from. I disabled Dolby Virtual Surround and the Vision performed perfectly, but the soundstage wasn’t nearly as large as before. I re-enabled the surround effects after a day or two and oddly enough never had an issue with speakers sounding out of phase again. I can’t tell you why the issue was fixed, so we’ll just have to call it a fluke. Throughout the rest of my listening tests with Modern Warfare, the Vision produced some sound effects that seemed to come from beside me, but not often. Sometimes large dynamic swings that required a lot of bass, like a bombing run from an airplane, would cause compression. By backing off the bass, the soundbar could handle higher volume levels before giving out. All in all, my experience with Call of Duty was a mixed bag, but the next listening test made up for it.
Blu-ray: Cars

Cars, like most other Pixar movies, is a benchmark test disc for both audio and video. Pixar uses surround effects to truly add to the film and give off little auditory queues that place you right in the middle of the action. Most salespeople demo the opening scene, which I was going to do as well. Unfortunately, as so often happens, I lacked the will power to stop watching after the particular scene I was trying to demo. So, I watched the entire movie. The Vision consistently produced rich, full sound. There was clear separation among the left, center, and right sound effects, but the Vision also held a smooth presentation during pans across the entire soundstage. Although I enjoyed every scene in the movie, the Vision particularly came to life with the musical score. From Rascal Flatts’ rendition of “Life Is A Highway” to unknown techno music blasted by souped-up import cars, the Vision handled every kick of a drum and pluck of a guitar with aplomb. The only inconsistency was the Vision’s ability to reproduce surround effects. During really quick scenes, like when Lightning McQueen drives into a group of cacti at full throttle, I swear that I could hear sound beside me. Never during any of my listening tests did sound come from behind me, but often times it sounded like it was coming from my actual main speakers, which sat about a foot off each side of the Vision.
MartinLogan Vision Measurements
All measurements were taken in-room at 2m away from the Vision, utilizing an OmniMic measurement system. 1/12th octave smoothing was employed and a 5ms blended response to help remove room interaction from bass frequencies.
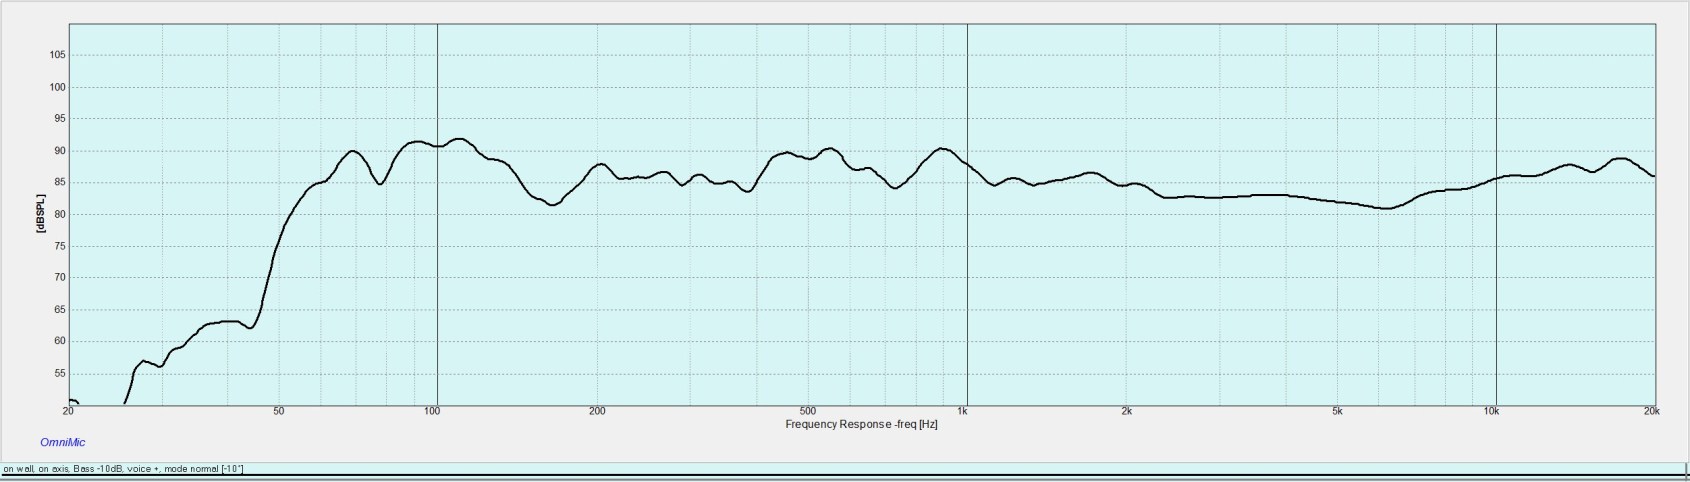
MartinLogan Vision In-room 2 meter SPL vs Frequency Response (1/12th octave smoothing)
I moved the Vision around (from right against the wall to 11” inches off the wall), changed the installation option between on-wall and on-shelf, and adjusted the bass trim until I was able to achieve the above graph. It is the flattest response I was able to get from the Vision. This measurement is taken with the Vision set to on-wall mode, -10dB bass level, voice + stereo sound, and normal mode. By dialing in each of the aforementioned settings properly, I was able to achieve a reasonably flat response. The -3dB point is about 53Hz, which is 10Hz higher than MartinLogan’s stated frequency response. It is possible that at a lower volume level, with the bass setting at 0dB, or by taking advantage of boundary gain, that a -3dB point at 43Hz is accurate, but my measurements suggest usable bass drops off around 50Hz. There is a slight boost in the midrange between 400Hz and 1KHz, which may have contributed to vocals and dialogue sounding so strong. And a steady rise over 10KHz up to 18KHz, something I also measured in my review of the Motion 15 speakers, which could explain why I thought the sound was a slightly bright (but never harsh) in voice + mode.
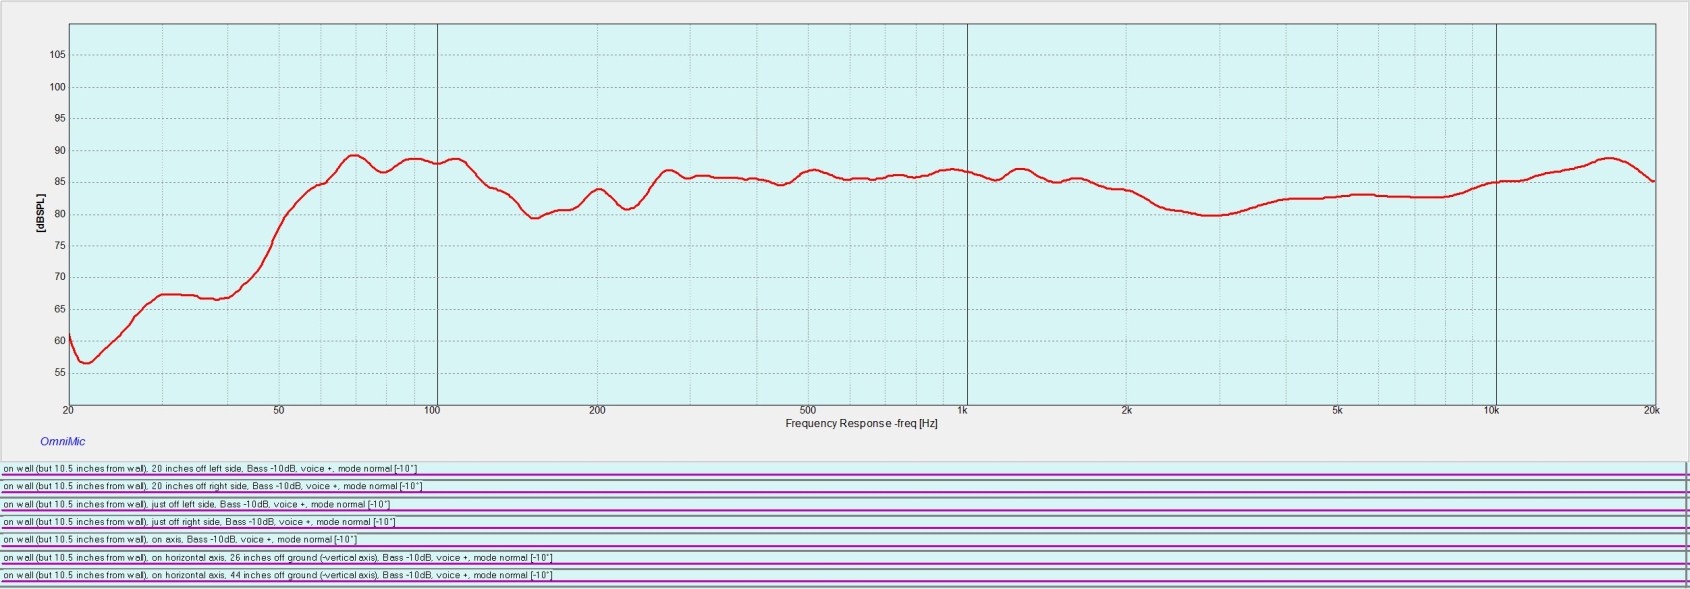
MartinLogan Vision In-room 2 meter Listening Window Response
I took a total of 7 measurements (on-axis +-15 deg & +-30 deg horizontal and +-15 deg vertical) and averaged the response for an overall impression of what listeners will hear. By averaging the responses this chart makes the final plot more linear than each of the individual 7 measurements would be. Still, you can notice a dip around 3KHz, followed by a steady rise until about 18Khz. By disabling “Voice +” mode, the steady rise up to 18Khz goes away and is actually replaced with a dip (not shown).
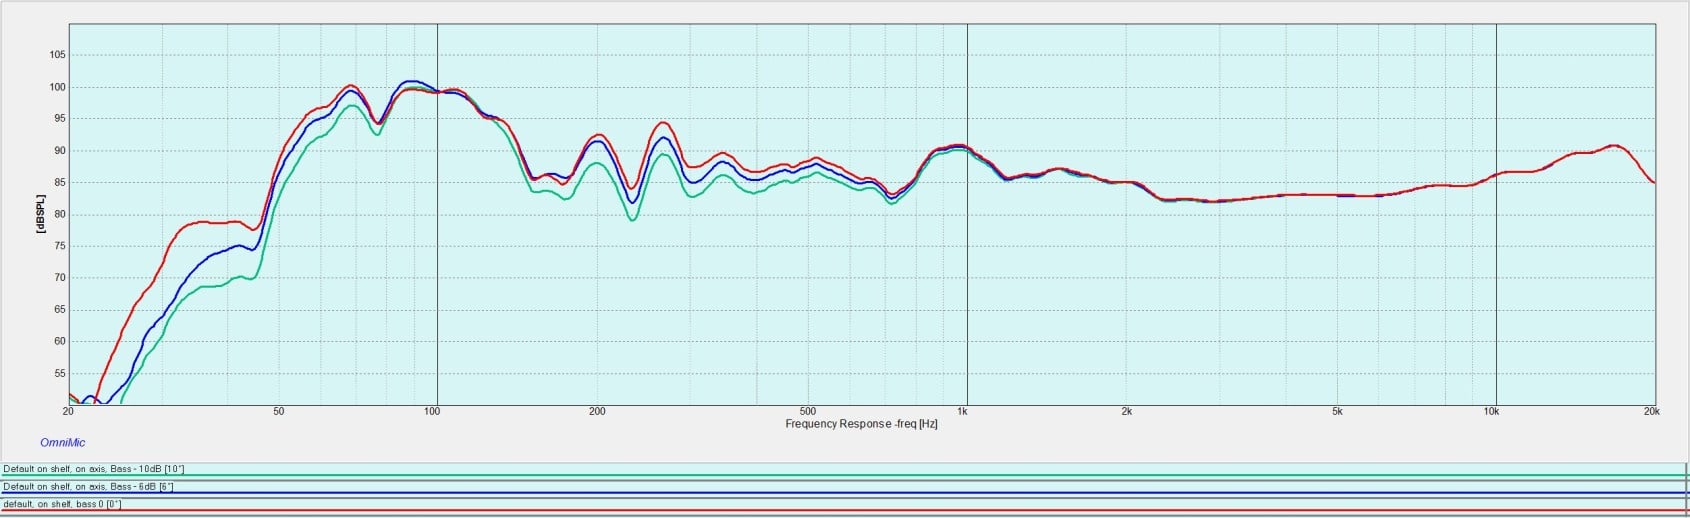
MartinLogan Vision
In-room 2 meter SPL vs Frequency Response (1/12th octave smoothed)
Red trace: bass -0dB;
blue trace: bass -6dB; green trace: bass -10dB
The graph above shows three different measurements taken from the exact same location, but with the bass setting on the Vision set to 0dB, -6dB, and -10dB. The actual frequency response is not the important part of this comparison (by switching from “On Shelf” installation to “On Wall” installation I could have attenuated the large bass bump), but rather the difference between the three plots. This shows that by adjusting the bass setting on the Vision, you are actually decreasing output below about 1Khz, which is much higher than I expected. It’s also notable that the decrease in bass isn’t consistent or as large as one would expect.
Throughout taking these measurements I discovered that the Vision can achieve a pretty flat frequency response, but that each setting in the menu system can have dramatic effects on overall sound quality and frequency response. I would advise anyone who purchases a Vision to spend a significant amount of time experimenting with the settings until it sounds best. This is especially true for the bass and installation options.
MartinLogan Vision Suggestions & Conclusion
Overall, I really like the Vision, but there are a few changes that would make me love it. The bass controls are definitely lacking. Sure, you can adjust the bass up or down by 10dB, but I would like a few more dB of control. I would also like the Vision to engage a higher HPF when a subwoofer is connected, or have the option to manually engage one. By decreasing the amount of bass the Vision has to produce, you keep the internal components cooler, have less distortion, a larger power reserve for dynamic swings, and in general simply have better performance. I understand that engineering a bass bump can sell a lot more units, and that most consumers will appreciate the added bass, but as someone who likes to tweak and refine their system, I would have liked to see more bass control.
An external AC/DC power adapter would also make on-wall installation much easier, as well as free up space in the enclosure for other purposes. Finally, the connectivity options are a little lacking. Many of the competitors have HDMI, Bluetooth, USB, and/or Airplay. It’s true that all of these features, with the exception of HDMI, can be added though an external device, but it’s nice to have the options built in. On one hand, it’s nice to see MartinLogan focus on sound quality over features. On the other hand, I really like having streaming options built in. For most people, adding an AppleTV, Sonos Connect, or the like, isn’t a big deal.
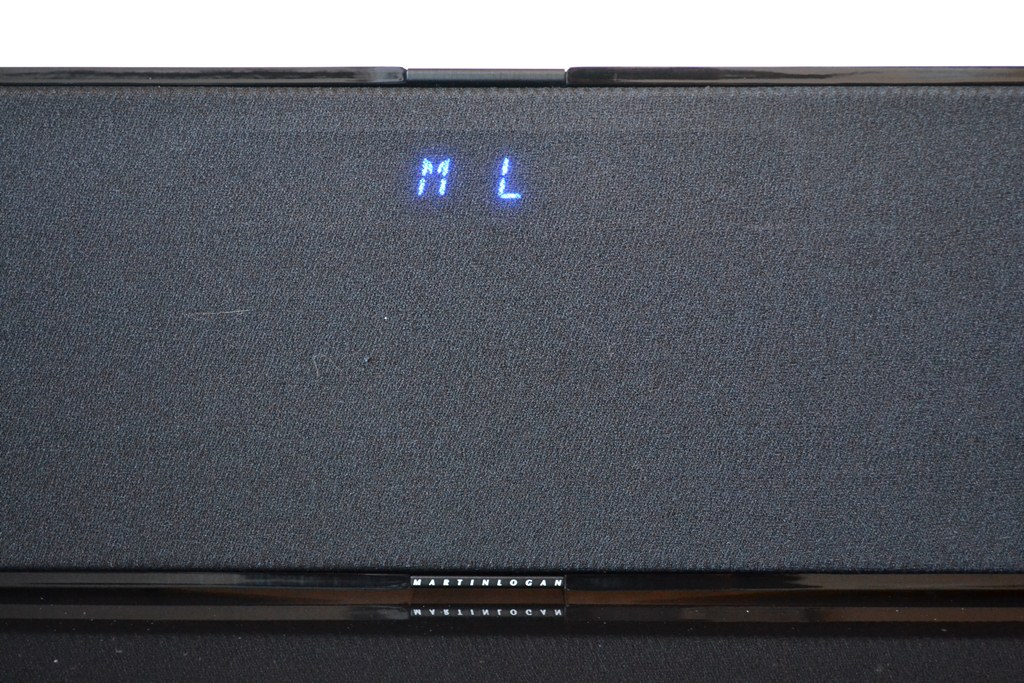
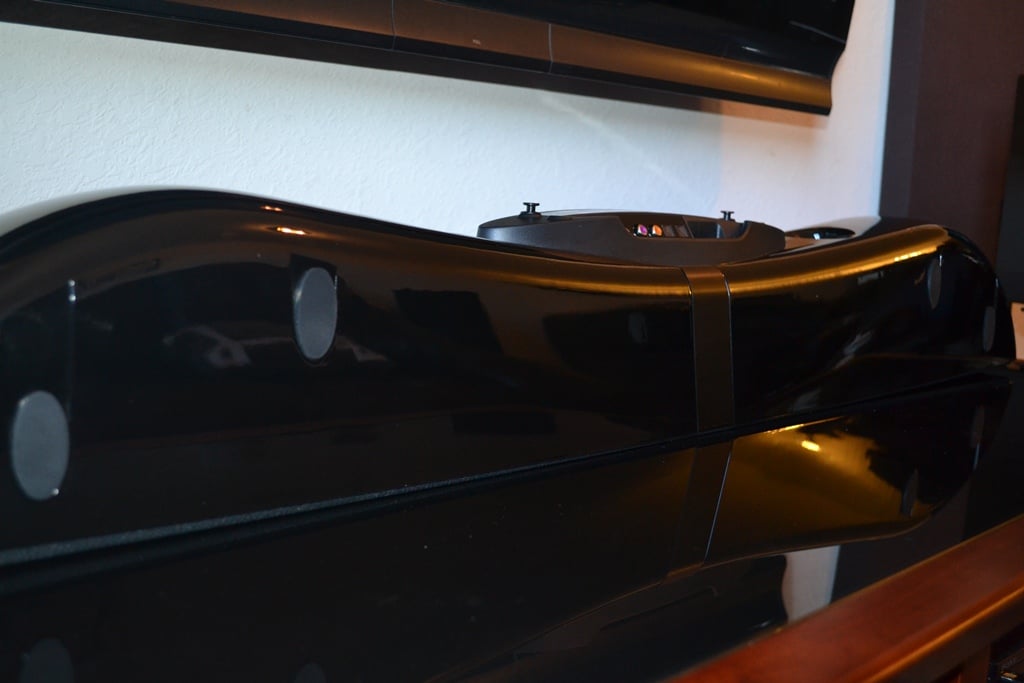
MartinLogan Vision Front Panel Close-up; Bottom Profile Shot
Conclusion
In my opinion, the Vision is a superb soundbar that gets many things right. It can go loud, sounds great, looks modern, and has a surprising amount of bass. It really shines when listening to music, but is no slacker when watching movies either. Still, I kept coming back to its musicality, which was far beyond any other soundbar I have heard. Some other soundbars can produce better surround effects (by "some", I actually just mean Yamaha), but the Vision can surprise you with convincing surround effects from time to time. If you are looking for a soundbar that can turn your non-believer friends into cult-like fanatics about soundbars, the Vision might be your answer. You no longer have to choose between great sound with a dedicated 2.1 system or great looks with a soundbar, the MartinLogan Motion Vision gives you the best of both worlds.
The Score Card
The scoring below is based on each piece of equipment doing the duty it is designed for. The numbers are weighed heavily with respect to the individual cost of each unit, thus giving a rating roughly equal to:
Performance × Price Factor/Value = Rating
Audioholics.com note: The ratings indicated below are based on subjective listening and objective testing of the product in question. The rating scale is based on performance/value ratio. If you notice better performing products in future reviews that have lower numbers in certain areas, be aware that the value factor is most likely the culprit. Other Audioholics reviewers may rate products solely based on performance, and each reviewer has his/her own system for ratings.
Audioholics Rating Scale
 — Excellent
- — Very Good
- — Good
- — Fair
- — Poor
| Metric | Rating |
|---|---|
| Build Quality | |
| Appearance | |
| Treble Extension | |
| Treble Smoothness | |
| Midrange Accuracy | |
| Bass Extension | |
| Bass Accuracy | |
| Imaging | |
| Soundstage | |
| Dynamic Range | |
| Fit and Finish | |
| Performance | |
| Value |
Cliff, like many of us, has always loved home theater equipment. In high school he landed a job at Best Buy that started his path towards actual high quality audio. His first surround sound was a Klipsch 5.1 system. After that he was hooked, moving from Klipsch to Polk to Definitive Technology, and so on. Eventually, Cliff ended up doing custom installation work for Best Buy and then for a "Ma & Pa" shop in Mankato, MN.
View full profile