
Understanding Subwoofer Review Distortion Measurements Part III
Understanding Subwoofer Measurements Part 3 - Dayton Subwoofer illustrated
In Audioholic’s subwoofer reviews, our measurements are an analysis of a subwoofer's ability to accurately reproduce the source content. This involves testing its behavior with respect to linear distortions and non-linear distortions. The linear aspects are easy enough to interpret for anyone acquainted with a basic frequency response graph; a flat curve means they don’t over-emphasize or under-emphasize any particular frequency range. Our group delay measurements are also a test of linear distortion. However, regarding non-linear distortion, we want to add a few notes on one set of the subwoofer graphs that depict non-linear distortion which has thrown a curveball to some of our readers in interpreting their meaning. So let’s now try to explain these graphs in clear, accessible terms that can make them a lot less complicated.
FFT Analysis
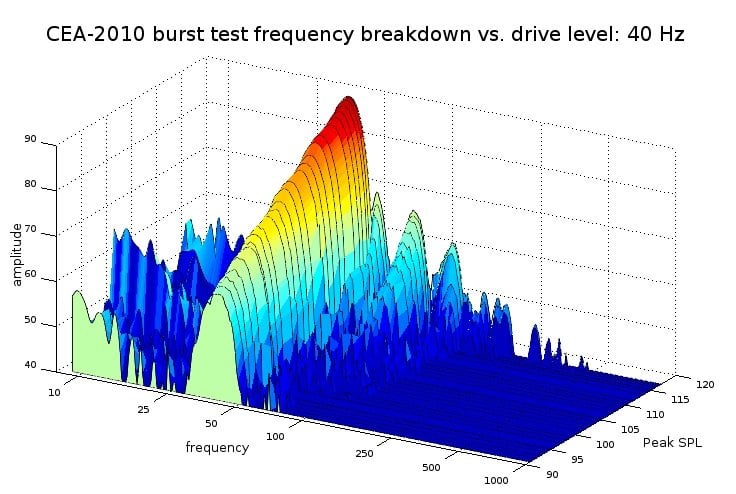
The graphs we are referring to are the colorful energy/frequency quantities measured in burst testing, with an example pictured above. This is a waterfall plot of a series of graphs that were produced by breaking down a recorded test signal by a process called a Fast Fourier Transform (or FFT for short). These transforms can be looked at in graphs that depict how much energy was released in which frequency over a period of time.
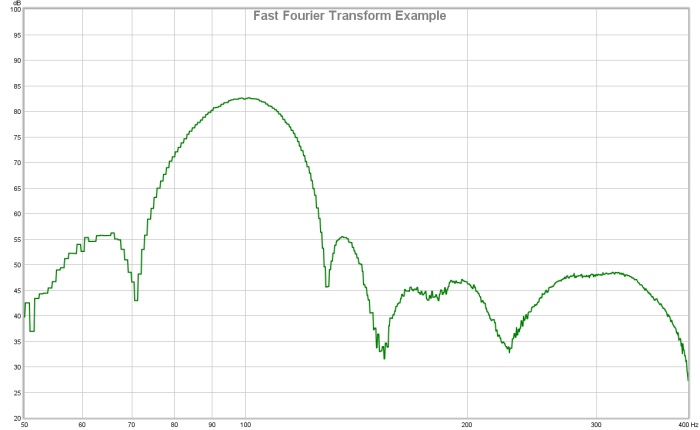
Fast Fourier Transform example
Let’s explain a bit more about how an FFT works briefly for this purpose before moving on. FFT graphs can be a way to look at energy quantities per frequency much like a basic frequency response chart. However, it is a measure of how much energy was measured over a period of time. Basic frequency response charts do not have a time dimension as a part of their metric, but a Fourier Transform converts a function of time (a recorded waveform) into a function of frequency (a frequency response graph). As an example, the above graph is a Fourier Transform of how much acoustic energy was released over a very brief moment. We can see that there was a lot of acoustic energy released that centered around 100 Hz and some additional minor quantities centered 200 Hz and 300 Hz. Whatever happened in this brief moment made a lot of noise at 100 Hz and some slight amounts of noise at 200 and 300 Hz. FFTs can look at a measure of energy for any duration of time, from a nanosecond to a billion years. Of course, to make an FFT graph useful, a reasonable amount of time must be set to observe the event that is being studied.
So how are FFT’s used to analyze subwoofer behavior? One way that we measure subwoofer performance is by running a test tone through them at some particular frequency and look for output at other frequencies. Any output produced at other frequencies that weren’t a part of the test tone is a distortion product. So, for example, if we sent a pure 100 Hz signal into a speaker, and we heard some additional sound at 200 Hz, that would be an unintended distortion byproduct. Every speaker will always produce distortion along with the original signal, as a totally distortion-free speaker or subwoofer is not something that occurs in real life. Instead of trying for the impossible task of building the perfect, distortion-free loudspeaker, engineers instead strive to get distortion levels that are so low they can’t be heard over the intended source signal, so the lower, the better.
One FFT-based test that we run on subwoofers to look at their dynamic range before heavy distortion sets in is called the ‘ANSI/CEA-2010-A Standard Method of Measurement for Powered Subwoofers’, but we will just call it CEA-2010 for the sake of brevity. The CEA had been renamed to CTA after the test had been established, and so the test has been officially renamed ‘ANSI/CTA-2010-A’. In this article, however, we will still call it CEA-2010, since it is better known by that acronym, and since I am also stubborn and don’t like change. CEA-2010 is a test of burst output; it measures how the sub handles a brief moment of output centered around a specific frequency, or, more specifically, CEA-2010 looks at how much distortion is produced for a certain frequency at a certain drive level. Most subs can manage fairly clean, relatively undistorted output at low enough drive levels, as long as the frequency is not too low. At higher output levels, as the subwoofer gets pushed harder mechanically and electrically, distortion can increase dramatically. CEA-2010 is a pass/fail test, so if the distortion products surpass certain levels relative to the fundamental (the fundamental is the frequency of the source test tone), then the subwoofer does not pass the test. The recorded measurements in a CEA-2010 test is how much output the subwoofer could manage before it ran into so much distortion that it failed or before it simply could not get any louder.
For more information on the CEA-2010 test tone and distortion thresholds used in CEA-2010, we refer you to this page: Total Harmonic Distortion (THD): Is It a Good Indicator of Sound Quality?
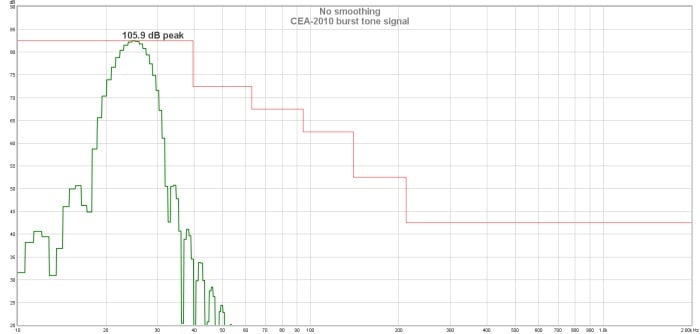
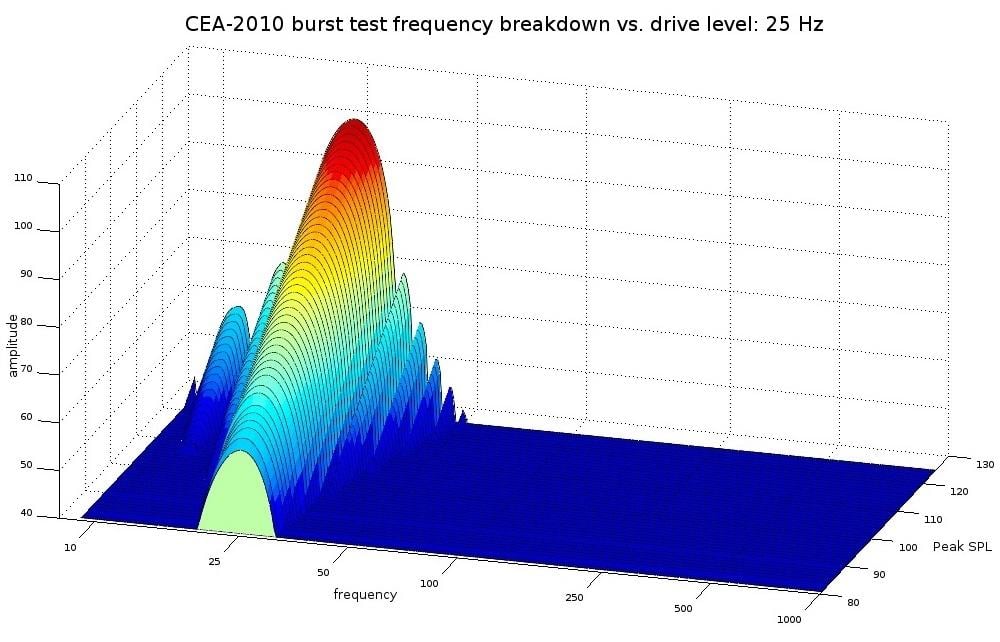
Let’s look at an FFT of a CEA-2010 burst tone at 25 Hz that has no distortion
The green curve in the above graph is the spectral shape of the burst tone, and this graph simply shows an FFT of the tone signal itself, and it is NOT what would be produced by any subwoofer in reality. One thing that you might notice is that the bulk of the acoustic energy seems to center around 25 Hz; this is the ‘fundamental’ frequency, which we normally just call the ‘fundamental’ and is the primary frequency of this particular test tone. There are some minor peaks that surround the fundamental, and that is because the tone is a shaped burst, so while the frequency of the waveform is predominantly 25 Hz, the burst shape of the waveform does slightly spread out the spectral makeup of the tone. Something else to note is that if you look at that red ‘staircase’ stepped line that touches the top of the test tone curve, that shows the distortion thresholds; if any distortion product exceeds those lines by having a higher amplitude level, the subwoofer fails the test. Now let’s look at an FFT of a 25 Hz CEA-2010 tone in a real-world test:
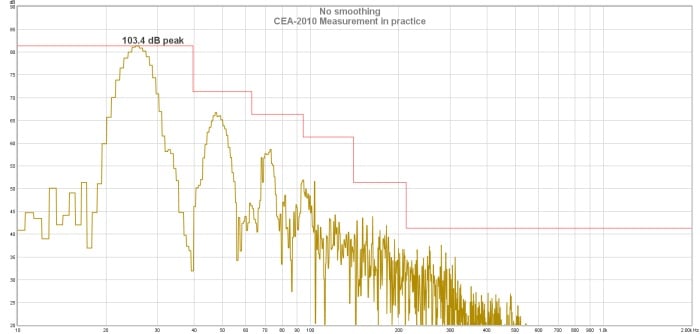
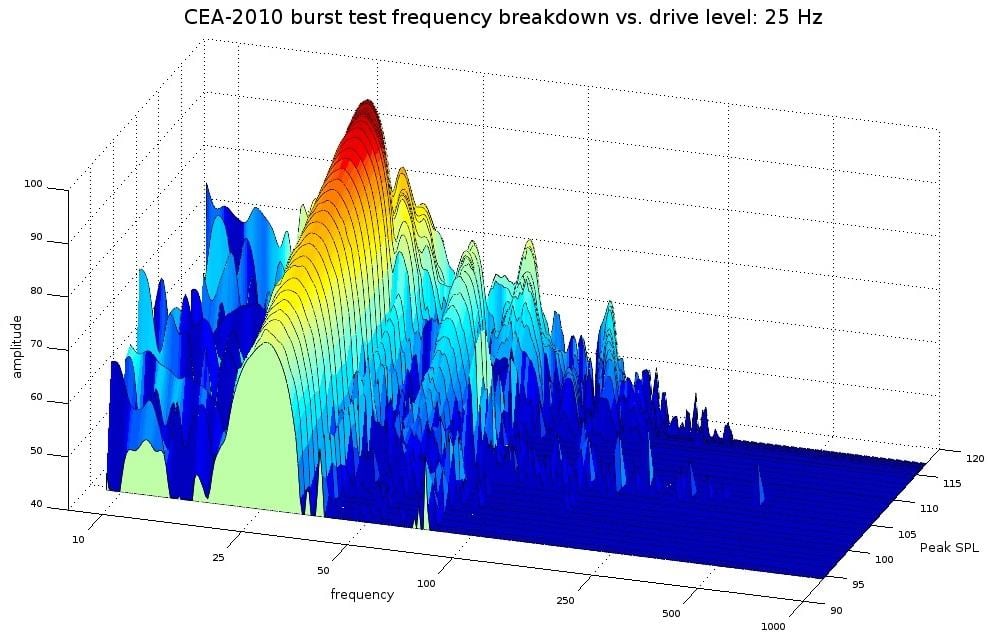
One thing that can be seen in the above graph of our real-world measurement is that there is way more acoustic energy at higher frequencies than what is seen in the FFT of the pure burst signal. This testing took place in real-world conditions, so some of that extra noise is from environmental sources like wind and distant traffic. However, environmental contributions are usually minor compared to sound pressure measured directly from the sub itself, since we try to measure in lower noise conditions. Sometimes a sudden environmental noise, like a low-flying jet, will contaminate the recording, and those measurements are discarded. Most of that extra noise that is not seen in the FFT of the test tone signal is distortion from the subwoofer. This particular measurement showed that while this sub was not exceeding the distortion thresholds of the CEA-2010 test, it was still exhibiting some significant non-linearities. However, there is still a nearly 20 dB gap between the fundamental and the next highest distortion component, so the fundamental still has nearly ten times the amplitude of the next strongest distortion component. It could very well be that, even with as much distortion as is seen on this graph, it is still entirely inaudible.
If the above graph is examined closely, the viewer will note that the major distortion components have a certain regularity of frequency when compared to the fundamental. The fundamental centers around 25 Hz, but the major distortion components center around 50 Hz, 75 Hz, 100 Hz, and so on. The major distortion components are multiples of the fundamental. These are ‘harmonics’, so this type of distortion is called ‘harmonic distortion’. The quantity of the harmonic distortion vs the drive level and the even/odd identity of the distortion can both be indicators of the source of the distortion. They can also be indicators as to the possible audibility of the distortion (we refer the reader to the above-linked piece about the audibility of distortion in bass frequencies for those who want to know how audible these distortion components might be).
CEA-2010 Testing
Hopefully, the reader will now understand the nature of FFT graphs and how these burst test measurements are displayed. Now let’s talk a little bit about how CEA-2010 testing is normally run and the significance of the results as they are traditionally displayed. CEA-2010 testing is usually conducted by running a burst tone from some nominal drive level, and raising the level until the subwoofer is pushed too hard and surpasses the distortion thresholds or until it can not get any louder. If the subwoofer’s output is pushed past any of the distortion thresholds, then the measurement is the recorded SPL (the sound pressure level that we hear as loudness) of the highest drive level just before it reached the distortion thresholds. If the sub can not get any louder but doesn’t surpass any distortion thresholds, the SPL of its loudest passing measurement is used. So a CEA-2010 measurement is essentially a single number per frequency, an SPL recording. Some subwoofer reviewers will note the distortion quantity of the passing CEA-2010 measurement, and whether that number was distortion limited or output limited, but the end measurement still only tells us a little bit about how the subwoofer performed at a single point in its performance envelope.
CEA-2010 only tells us how the subwoofer behaves at an extreme of its performance. It is undeniably important to know where that occurs, but most people don’t normally push their subs that hard. The vast majority of subwoofer usage occurs well under maximum output levels or below levels of major distortion output. So how does the subwoofer behave at levels below the extremes? This is what our waterfall graphs of burst measurement graphs show: how cleanly the sub operates at nominal to high levels within its performance envelope and the nature of the distortion that marks its operation.
The waterfall plots of the CEA-2010 FFT graphs show the spectral behavior of the sub from regular to high drive levels instead of just maximum output. They are made by measuring the burst tone output that is raised one dB at a time starting from some nominal level where the sub is not challenged. So we start testing at a lower level, record a measurement, raise the level by one dB, record another measurement, and so on. We then layer all of the FFT graphed measurements into a waterfall plot going from low drive level to high drive level so we can see what kind of distortion develops and at what levels the distortion starts to become more prevalent.
Let’s start our examination of these plots with one that is a recording of a test tone signal alone, so we can see what it looks like in a perfect world:
This is a simple layering of the FFT graphs of the signal itself, from a low level to high. You can recognize the shape from the previous FFT graph of the CEA-2010 signal. Of course, such behavior is impossible in the real world, but this still serves as a useful point of comparison. Now let’s look at a real-world example with some labels added for clarity:
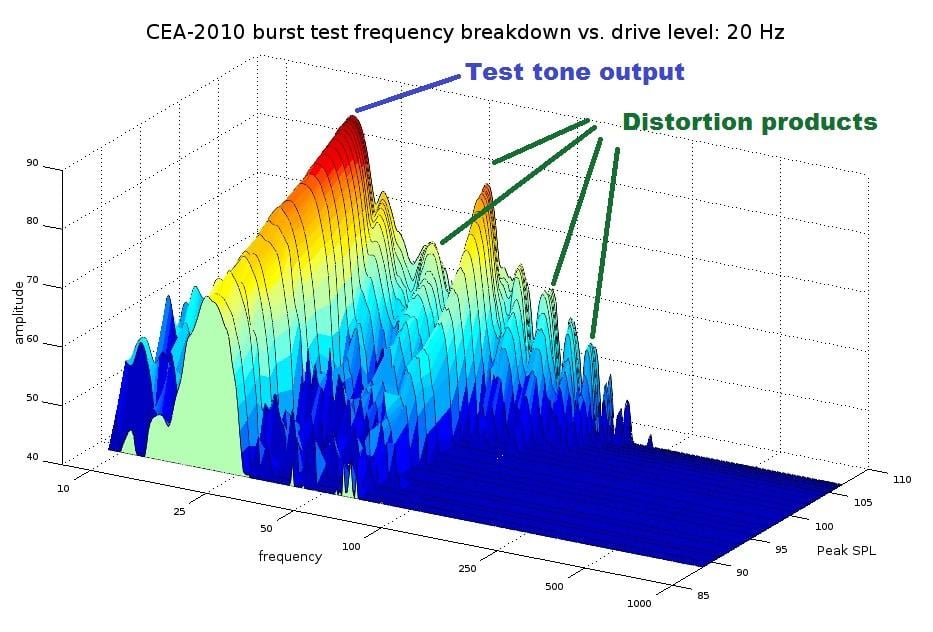
Like the real-world FFT graph that we looked at earlier, we see far more acoustic energy outside of the test signal, especially at the higher output levels of this testing. We can see a big spike of distortion around 60 Hz, which is the 3rd harmonic of the fundamental test tone of 20 Hz in this testing. We also see a sharp increase in other distortions a bit above the third harmonic which look like higher order harmonics: 4th, 5th, 6th, and so on. What should not be overlooked is the behavior up to the highest drive levels; yes, there is a very substantial amount of distortion nearing the maximum limits of this subwoofer’s output, but if we look at measurements just 5 dB or so below the peak output levels, we can see that the quantity of distortion drops dramatically relative to the fundamental. So long as this sub is not pushed to the limit, it should sound fine.
Let’s take a look at another plot at a slightly different angle:
The above plot shows that this subwoofer can’t be pushed into producing nearly as much distortion as the previous graph. This is a much cleaner and well-behaved subwoofer where distortion will likely be inaudible even at its highest drive level. A couple of things to observe here: in one of the FFT ‘slices’ we can see more ripples than the others outside of the usual distortion ridges. This is likely due to some transient environmental noise. We also see lots of activity to the left of the test tone fundamental, essentially a bunch of random blobs of activity. That stuff should all be ignored since it seems to be random noises. It crops up in all measurements, and to be honest, I don’t know what it is caused by exactly. It isn’t audible, and it is not what CEA-2010 tests for since it lies below the fundamental test tone. And before anyone suggests it is port noise, it crops up on sealed subwoofer measurements too. It is not environmental noise since it always occurs in nearly the same quantities beneath the fundamental, no matter what the fundamental test frequency is, so if it were not produced by the sub, it would also appear in frequencies above the test frequency, but it never does. It is one of the great mysteries of our time.
Conclusion
Hopefully, this explanation of the waterfall plots of burst tone measurements helps to clear up the meaning of these graphs for anyone who was having trouble interpreting them. To reiterate the quality to look for in these graphs, the less acoustic activity outside of the fundamental test tone, which is normally the largest ‘ridge’ in these graphs, the better. Harmonic distortion components will always show up along with the fundamental test tone output, so what should be looked for is what distortion quantities at what drive levels. If distortion quantities only pop up at the highest drive levels, then distortion will not be a factor until that point. If distortion quantities are present in a steady amount at all drive levels, then what needs to be looked at is the difference between the fundamental and the distortion level. A 20 dB difference in level between the fundamental and next highest harmonic distortion component is nothing to be concerned about, but a 10 dB difference might be audible. Even then, more context is useful in interpreting the measured behavior shown in these graphs. Audioholics’ reviews will always provide some commentary in interpreting these waterfall plots, so even if the reader didn’t catch all of the nuance and intricacy involved in these graphs, the review commentary will provide insight toward any notable features that might occur.
James Larson is Audioholics' primary loudspeaker and subwoofer reviewer on account of his deep knowledge of loudspeaker functioning and performance and also his overall enthusiasm toward moving the state of audio science forward.
View full profile