
Audioholics 2010 Subwoofer Shootout Measurements Overview
Subwoofers in our shootout
The goal of our most recent subwoofer shootout is to give us as consumers, a reliable and quantifiable way to purchase home theater subwoofers with some confidence that the products we hear and read about are in fact well designed and capable of sufficient output at low frequencies to reproduce both music and movies with the impact and realism that you expect from a well designed and executed product. The products in this comparison were chosen based on a box size of 6 cubic feet or less, and a maximum retail cost of $2000. This article discusses our testing methodology for measuring all of the subwoofers.
Product Entries
|
Brand |
Model |
Box Dimensions |
Dimensional Volume |
Retail Price |
Product Description |
|
18" x 24" x 24" |
6 ft^3 |
$1,300 |
15" ported servo with 600 watt amp |
||
|
24" x 24" x 14.5" |
4.83 ft^3 |
$1,950 |
12" ported with external 2000 watt amp |
||
|
25" x19" x 21" |
5.77 ft^3 |
$1,399 |
12" ported with 800 watt amp |
||
|
25" x 18" x 26" |
6.77ft^3 |
$879 |
15" ported with 350 watt amp |
Putting your products in the hands of a stranger whom you do not know is risky business. There are more than a few folks in audio who are more hobbyist than engineer or scientist. Having your flaws displayed publicly requires a lot of courage. I can say with a clear conscience, there were no perfect entries. For a certainty there were excellent, fair and mediocre products. Some were so mediocre in fact, they withdrew from the competition. When viewed in that light, keep in mind those left here, are here because they were the best of the batch. The few people in the audio business who do know me well will not tell you I am critical. They will tell you I am VERY critical. My job is basically finding flaws, eliminating them and designing a better product. A product which may make the typical consumer ecstatic, may draw faint praise from me.
Some years ago when subwoofers were becoming much more popular, while walking the show floor at CES, (the Consumer Electronics Show) I acquired a loudspeaker component (woofer) catalog from a nondescript Chinese driver vendor, who had gone to the trouble of identifying every single one of the woofers pictured in his catalog as “subwoofer”. In fact, among the dozens of woofers pictured, regardless of the application, or range of usable frequencies covered, they were ALL identified as “subwoofers”.
The use of the term is not necessarily a guarantee you will be buying the real thing. Please note; there were NO fakes in this reviewer's opinion in our shootout. All the products submitted represented the best ability to produce, design and source parts, of all the contestants in the shootout. That does not mean there were any perfect entries, or flawless products. Pretty much every decision you make as a loudspeaker designer requires a compromise. The reality is, some folks are better at making choices and compromises than others, and I am hopeful that the consensus of opinion of our readers will be that this reviewer has done his best to be fair and even handed with all entrants. There were things I liked and disliked about all the subwoofers. Those shall all be disclosed in the individual reviews that follow.
Is This Test Fair?
We can expect the participants who yield the best results (loudest outputs within the distortion ranges allowed) to say yes, very much so. Those entrants at the bottom of the maximum undistorted output table may say no. My opinion is not really, and here is why. The boxes are of different sizes and different prices. The companies will follow their own ideas and formula's for product creation, and some were clearly better equipped from the standpoint of resources and know-how than others. On the flip side, it's very difficult to find competitive products of exact box size and retail price, but we did our best to collect similar priced samples from willing participants. Still, the main limitation beyond amplifier power for system output is actually box size and tuning frequency (the lower the tuning frequency, the less efficient the subwoofer is, holding box size a constant). Since this is NOT controlled, the larger boxes have a considerable advantage over the smaller sized boxes. The advantage of the smaller size box is clearly in room placement location and wife-acceptance-factor. (Universally known and hereinafter referred to as WAF among speaker builders). Keep in mind Internet buyers tend to be less concerned about box size and more concerned about product performance, hence why many of the Internet direct brands have the larger box sizes compared to their brick and mortar competition.
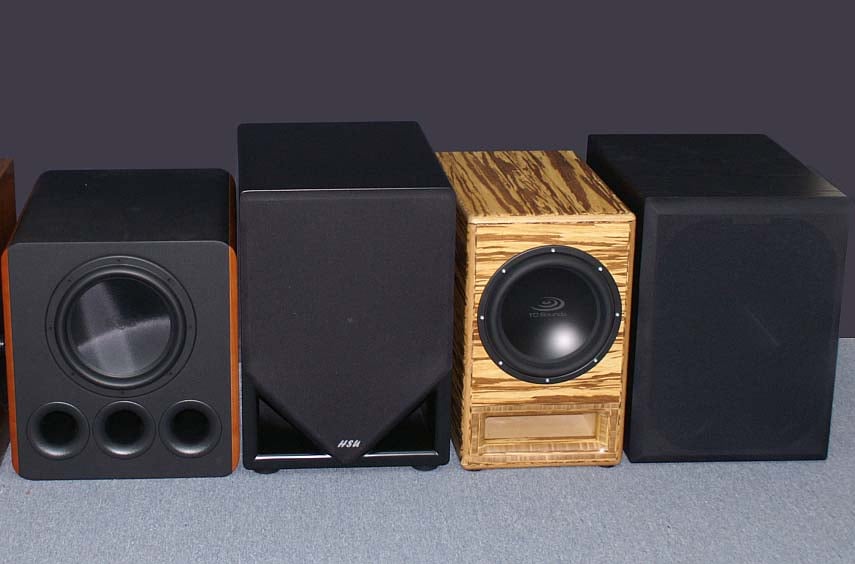
Pictured (left to right): SVS PB12 Plus, HSU VTF-15H, Funkywaves 12.x, Rythmik 15VHP
CEA 2010 Subwoofer Testing - What Is This and Why We Use It?
For many years, a traditional means of quantifiably measuring distortion has involved the very simple principle that if you excite a device under test with a single frequency, any other frequencies which it simultaneously produces must therefore be distortion. As a result of measuring this repeatedly, on all different kinds of gear we find that our reproduction devices tend to add multiples of the excitation frequency, called simply enough, harmonic distortion. (If you excite a speaker with a 1000 Hz signal, and it simultaneously produces 2000 and 3000 Hz, it has created a 2nd and 3rd harmonic of the fundamental frequency, or simple harmonic distortion. It has been know for quite some time by those attempting to relate the simply derived number which measures only the amplitude of those harmonics relative to the fundamental, known as THD or total harmonic distortion, correlates quite poorly with the human perception of how badly the original signal is distorted. The 2010 CEA standard addresses this issue by using a progressively more stringent limitation on the allowable distortion. Higher-order and/or odd-order harmonics have progressively lower allowable distortion limits, as these tend to subjectively be more offensive to the human ear than lower order and/or even-order harmonics. I have personally seen, as far back as the early 1990's from my own research as a subwoofer system designer for Miller & Kreisel Sound, that we often could "tweak" a compressor in such a way where we found the result more musical and pleasing, yet the THD as measured by some very expensive and reliable HP equipment would actually go up as a percentage of the output. In my own personal experience, this was almost always a trade-off for more low harmonics (notably second or third) for less higher harmonics (fourth or higher). We shall discuss this relatively new CEA 2010 standard in some detail, and hold true to it where feasible.
Audioholics 2010 Subwoofer Shootout Measurements Per CEA 2010
The Purpose of This Subwoofer Shootout
The purpose of this subwoofer shootout is simple: compare products for performance using measures and techniques as defined by the CEA 2010 standard. The CEA 2010 standard is a means for measuring the maximum output of subwoofers at the two lowest audible octaves, 16-32 & 32-63 Hz. Unlike a traditional harmonic distortion number, the CEA number attempts to weight different harmonic distortion components based not only on their amplitude relative to the fundamental, but on their separation in frequency as well.
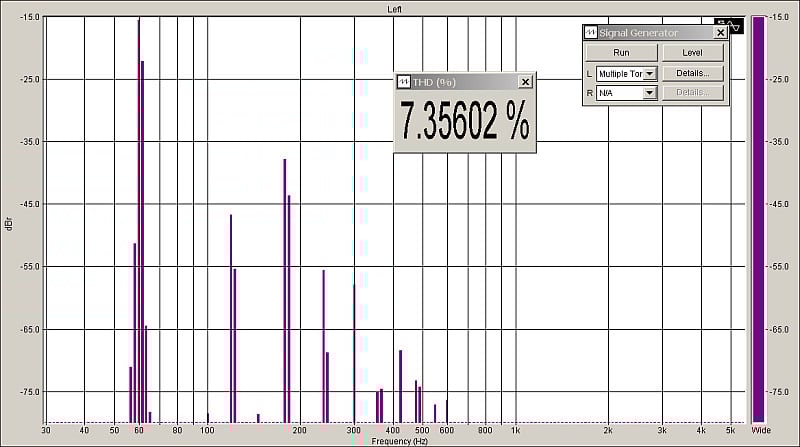
Example of Product with Excessive
3rd Harmonic Distortion
Fundamental Frequency =60 HZ, 2ND =
120 HZ, 3RD = 180 HZ, 4TH = 240 HZ, 5TH = 300 HZ, ETC.
Above is a spectral plot of the output of a 12” subwoofer in a box tuned to 40 Hz. While this author found this level of third harmonic distortion easily perceptible, I must note that this output would be considered well within the CEA third harmonic distortion limits imposed by the CEA standard. One of those individuals who had taken part in the creation of the standard has personally voiced opinions to me that perhaps the CEA standard is too lenient. I have also heard this comment from some of the vendors who submitted product for our own testing. Those vendors, such as SVSound, who held themselves to a higher standard than the CEA published “acceptable” distortion limits, actually placed themselves at a disadvantage because they had the system “draw the maximum line” at a location lower in distortion than CEA allowed for what it considers to be acceptable at maximum usable output. One must bear in mind, that both an amplifier with a built in compressor, as well as a loudspeaker, do not have a brick wall limitation in performance. (While technically possible to build an amplifier this way, the resultant distortion it would produce when it hit the threshold would be egregious. Some of you already know it, and refer to this as “Hard Clipping”.) When an amplifier is rated on power, the number is meaningless if not accompanied by a distortion figure, and whether or not the output is peak or RMS (which most of us think of as continuous instead of transient or short term.) The same is true when testing subwoofers for maximum output. You might be able to drive them past their intended maximum limit, but at what price in distortion? The CEA standard not only attempts to define that limit, but does so in a completely quantifiable way. Note the graphic below titled Signal Spectrum.
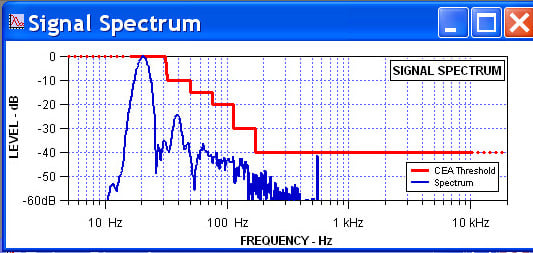
20 Hz Fundamental output within CEA allowable distortion limits
Please note the stepped red boundary which looks a bit like the side-view of a staircase. That red line represents the CEA 2010 Sub-Woofer standard limit on distortion. It does not represent a certain amount of distortion in absolute terms. It does shows the acceptable upper limits of distortion as a percentage of the fundamental output. (The test frequency). Note the center of the large “finger” shape in blue. It is centered at 20 Hz, in this case the test frequency. Notice a second finger centered at exactly twice the frequency, 40 Hz. That is second harmonic distortion. For this product, that is the dominant distortion when driven at 20 Hz to this output level. (It may well change if driven harder towards its physical limitations). Note also, the level of 0dB at the peak output centered at 20 Hz. This is NOT a measurement of the output in dB relative to any particular sound pressure. The program captures the signal output, and transforms the signal into a spectrum. Whatever the sound pressure is at the driving frequency (in this case 20 Hz), this peak value will be considered the reference, or “0 dB” value. It means that the other frequencies present are measured RELATIVE to the fundamental, which is why distortion can be expressed as a percentage. Notice that as the harmonic frequency is farther and farther away from the driving frequency, the CEA limitation, (like your ear) is more and more intolerant. The red stepped line means that the second harmonic distortion can be up to 10 dB less than the fundamental, the third an be up to 15 dB less, the fourth and fifth 20 dB less, and so on. This is weighting the distortion spectrum in a way that corresponds to how the human ear-brain mechanism responds. Since the distortion components are all below the threshold of the stepped red line, (CEA standard limits) this speaker at this test volume passed.
During my testing, I was sitting about 40 feet away (to the side) of the units under test. While I cannot determine how different the spectrum of sound was at the microphone relative to my position, on a relatively small number of occasions when the software recorded the output as a "FAIL", or "PASS", I might have decided from listening alone, that should not be the case. Despite that, I would argue that the CEA 2010 standard is as good or better than any other metric I can name for relating subwoofer distortion to usable output. The vast majority of the time, my ears would draw the line at the same levels the software would report a "FAIL". Let's take a look at the graphics shown to the test operator in the image below which shows a failure due to an excess of third harmonic distortion (60 Hz resulting from a 20 Hz input).
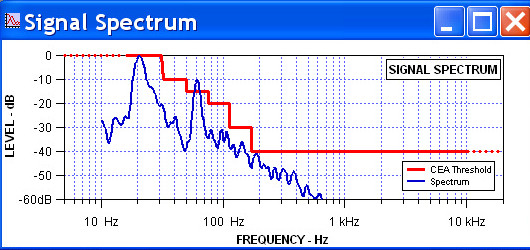
Excess Third Harmonic Distortion as per CEA 2010 Standard
As we can see from this example, the distortion of this speaker under test is predominated by third harmonic distortion (60Hz), and it rises in excess of what the Red stepped curve would allow as a maximum limit. At this point, we have crossed the line (literally) and are “in the red”, so the SPL produced by this speaker was not considered “usable”. That is, in a nutshell, how this program works. It produces ratings of Pass or Fail only. The only two discernible frequency components in this upper graphic are the fundamental driving frequency (test pulse centered at 20 Hz) and the 3rd harmonic distortion, centered at 60 Hz. During testing, the frequency center is changed from 20 to 63 Hz in 1/3rd octave steps (20, 25, 32, 40, 50 & 63 Hz). Unlike a traditional tone burst, which consists of a single frequency, this stimulus has a 1/3rd octave width. Traditionally 1/3rd octave is considered to be “critical bandwidth” of the human ear, meaning we lack the ability to distinguish tones that are within this close to one another in frequency. What does that mean? Well, take a look at the first graphic (#1). You can take note of the single vertical blue line which looks like it is centered at or about 550Hz. This is a very narrow-band noise, which likely has less to do with the speaker under test than it does to noise being emitted by a nearby factory. This line is how a traditional tone burst might appear, very narrow in comparison to the 1/3rd octave pulses used in testing. The advantage of 1/3rd octave signal pulse for testing, is that it will tend to average a speakers strengths and weaknesses over that 1/3rd octave. It is ENTIRELY possible for a speaker to have a big HUMP centered at EXACTLY 40 Hz, while at 35 Hz, it might have a huge and narrow notch. A traditional 40 Hz tone burst would show a huge output yet would be blind to the notch. Since 35 Hz is not a standard frequency center, this defect might go unnoticed by tone burst testing stepped in a similar way, 1/3rd octave at a time. With the 6.5 cycle burst from Don Keele's CEA test software, running on the graphics program Igor Pro, the nature of the signal is to be DOWN -3dB at a 1/6th octave increment on either side of the center frequency. (Meaning these pulses are 1/3rd octave wide). This is in fact quite similar (though not identical) to the kind of signal proposed by Siegfried Linkwitz to be used for testing on his site.
(http://www.linkwitzlab.com/sys_test.htm Scroll down to the section titled shaped tone burst generator).
Why do we care? Is this just to make my job easier? (As if anyone really cares!) No, this is important as it is a useful way for us to collect data in a way that corresponds to how we hear, without having thousands of data points to represent all the single frequencies we can perceive. It is also exciting the speaker with a signal far closer to music, as instruments tend to make sounds of a complex nature, containing many frequencies simultaneously. It is common to test a speaker with a single frequency, either stepping or sweeping it up and down to “connect the dots”, yet this kind of excitation is essentially unheard of in music. Musical tones are full of harmonics and generally have a wide spectrum looking completely different from traditional test tones.
Audioholics 2010 Subwoofer Shootout Measurement Methods
The Ground Plane Testing Method
All of the subwoofers in the review were placed on the ground, in a large parking lot free from obstructions or objects from which sound would be reflected save for the ground.
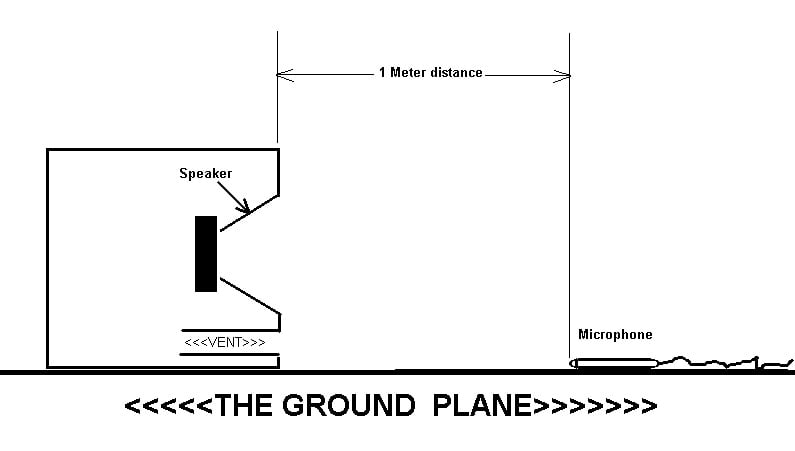
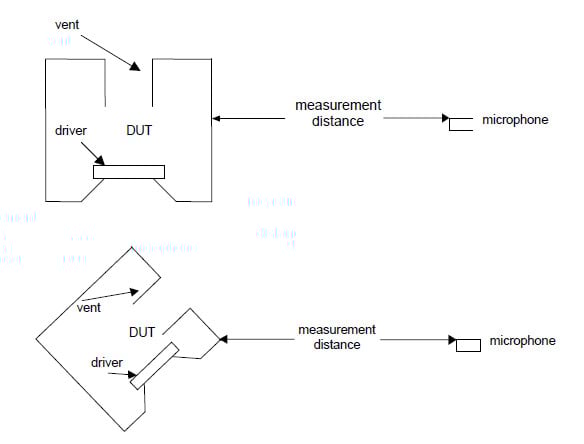
While this is the method shown in the CEA standard, I imposed my own "peculiar" take on this based on 20 plus years of experience in measuring vented sub-woofers in real world rooms. This method as shown will emphasize the output of the vent relative to the driver output because of proximity errors, (in other words the mike is closer to the port than it is to the speaker). Another source of error will occur as differences in the size of the speaker vs the port are common. (Because the port is smaller, it contributes more at very close distance from the mike than the larger surface area of the sub, even if far far away, their contribution would be equal). My solution was simple, if not perfect. I turned the box on its side, and measured the microphone relative to a line midway between the center of the ports, and the center of the driver. This would tend to give me greater accuracy than the method as pictured above, and all subwoofers with this configuration were tested on their sides for this reason. This is something we hope CEA will notate in their next revision of the standard.
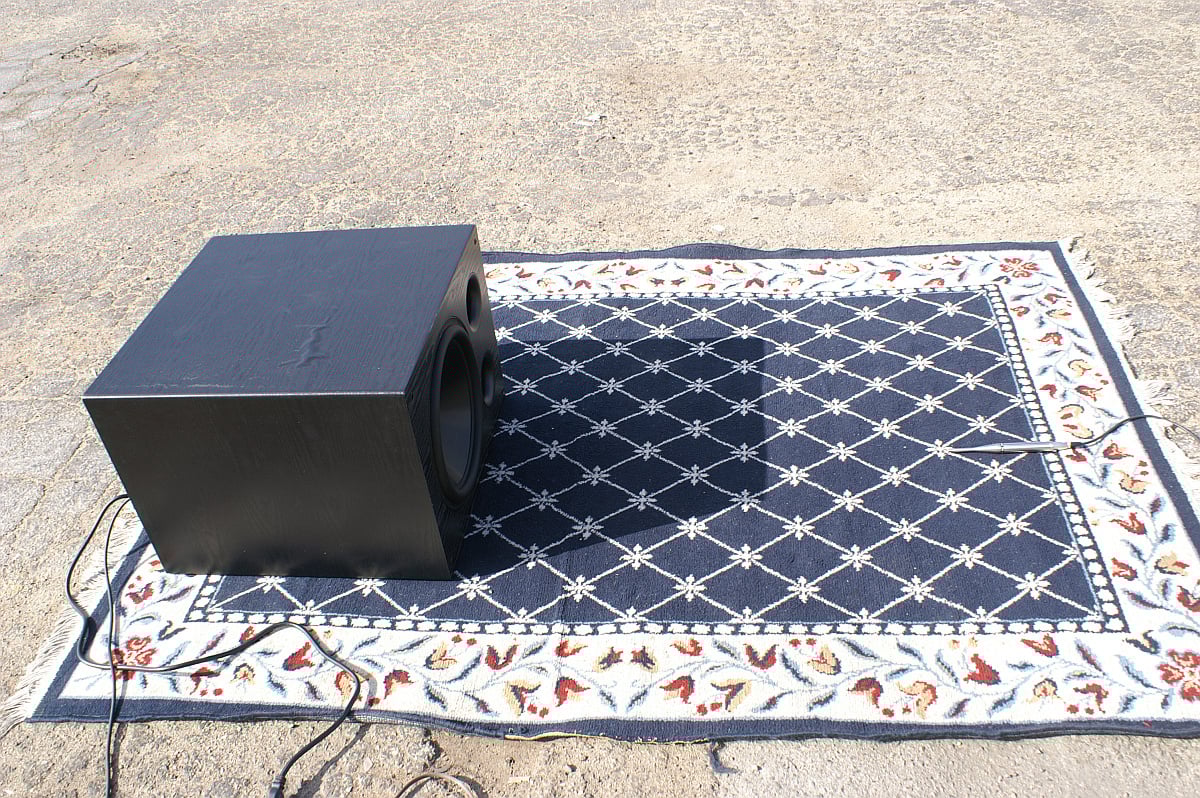
Subwoofer Box orientation with ports and driver both against the ground
This is how I tested the Rythmik sub in my parking lot. Notice the ports are to the side of the driver, not underneath as you would place it at home.
The area where the subwoofer was placed was on a carpet to protect the cabinets and microphone, on the ground as per the guidelines shown in the CEA 2010 standard. This mike was placed on the ground 39.37 inches (that's a meter to you mate) from the front of the baffle (no grilles were used for front firing woofers). This technique, while reasonable does place larger woofers, and systems with side firing woofers and/or ports at a disadvantage in large part because it still requires the meter be measured to the front of the cabinet instead of the centerline between speaker and ports or passive. In my opinion, the standard groundplane measurement as we previously illustrated deals with those configurations in an unfair way. This may be in large part due to many years of precedent in calling for measurements to be made relative to the front of cabinets instead of the acoustic center of the radiator(s). That is a simplification which is reasonable, even if an additional source of error.
CEA 2010 Proposed
Alternative Groundplane Measurement Technique
for Alternate Driver
Port Configurations
This tradition of measuring the SPL at 1 meter from the cabinet face (or side) may be in large part due to many years of precedent in calling for measurements to be made relative to the front of cabinets instead of the acoustic center of the radiator(s). That is a simplification which is reasonable, even if an additional source of error. (One could point out that a deep woofer actually mounted to the front panel, has an acoustic center farther away than the shallow woofer mounted in the same box. At some point, we have to pick a convention and stick with it, regardless of its imperfection.) One way to make this issue less bothersome is by increasing the measurement distance to 2 or 3 meters. The problem with that solution is that the further away from the speaker you get, the lower the ratio of direct sound versus the reflected sound which is essentially a function of the acoustic space in which you measure, and not the speaker itself.
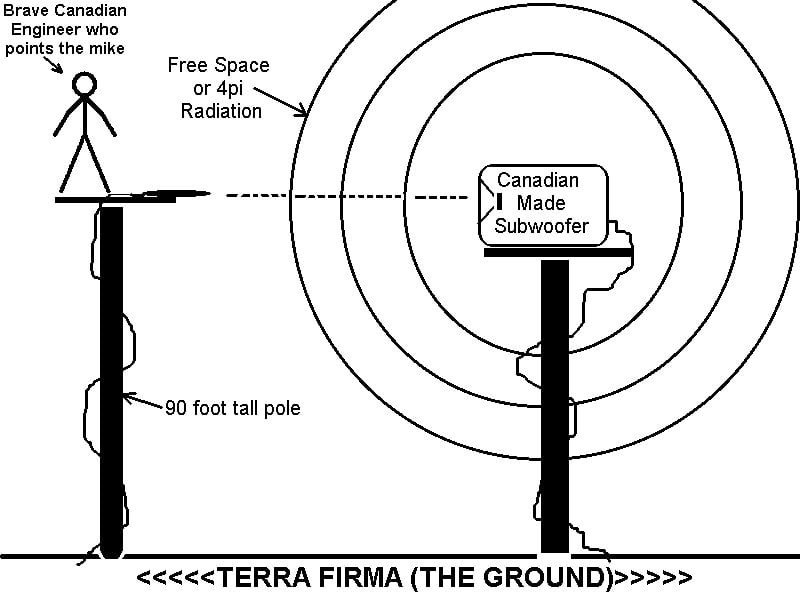
Testing subwoofers accurately and without the response of the room added to your measurement requires either an outdoor measurement setup, or a very very large anechoic chamber, the kind of which few in the world exist large enough to be usable down to the lowest frequencies we can hear (16Hz). I being a poor soul, devoid of either a chamber or a 90 ft pole with a platform and ladder, allowing me to do true “free air” testing, opted for the outdoor method. It is common knowledge among those of us who measure sound frequently in real rooms that once your mike is more than a cm or two away from the cone, most of what you are measuring is room reflection, not speaker output. So, how do we get around this problem without a multi-million dollar room that will eat all reflections? (An anechoic room). We measure outside. But what about ground reflections? Are they not also a source of errors? Yes, unless you place the microphone directly on the ground so the “reflection” is actually in phase with the direct sound! This method is known in the industry as “ground plane” measurements.
Is this the best way to measure the speaker? Shouldn't it be up in the air, pointing directly at the center of the subwoofer? Those are all good questions, so let's take a minute to consider how sound forms around the speaker box at very low frequencies.
There is a
school of thought that says, ground-plane measurements are too, a source of
less than perfect information, so they prefer to climb a tall pole and hoist
their speakers far above the ground. On
a clear, sunny and windless day, this is indeed, the best of all methods (minus
that huge anechoic chamber) but this particular writer has another peculiarity,
fear of great heights. So, between that
and the CEA standard as cover, I
opted for the ground-plane method. For
those unfamiliar with the concept, let me explain it like this. First of all, we need remember what sound is,
a wave motion propagated through particles (air molecules) which end up in
tightly or sparsely populated groups with densities greater or lesser than
ambient air pressure. The louder the
noise, the more intense the difference between the maximum and minimum density
of air molecules.
Softer sounds barely effect the relative pressure at all. Since the speed of sound is a relative constant (it varies slightly with temperature pressure and humidity), we can calculate the distance between the pressure peaks and minima's in a waveform based on the frequency. The relationship is simple and stated thusly: C = λ * F (Speed of sound (C) = Wavelength (λ) times frequency (F)). Since C is a constant, if we know the frequency (F) we can calculate λ (lambda) which is the distance between the peak-to-peak pressure (either negative to negative or positive to positive) in whatever units the speed of sound is expressed in.
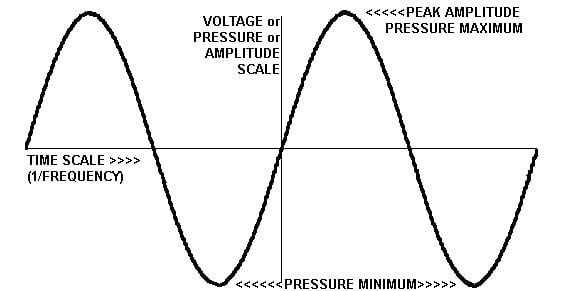
2 Full Cycle of Sine Wave – Single Frequency vs Time
Let's do some simple math now. I want to know how long a 20 Hz wavelength is. In the graphic above, if the horizontal time scale is equal to 0.100 seconds, and I have two cycles as shown, my frequency would be = (2/0.100 seconds) = 20 Hz. My normal C is 343 Meters per second = 13,504 inches per second = 1125.3 ft per second. So expressed in inches, the wavelength at 20 Hz is 13,504/20 = 675.2 inches long, or about 56.27 ft or 17.15 Meters long. Wavelength is the distance that 20 Hz covers in one cycle and it takes 50 milliseconds to complete. Another way to say the same thing is the period of 20 Hz is 50 milliseconds. (Period = 1/F) At 200 Hz, the wavelength is 1/10th as long, and at 2000 Hz, the wavelength is 1/100th as long; and at 20,000 Hz, the wavelength is exactly 1/1000th as long or only 0.675 inches. Remember, since the speed of sound is essentially constant, what changes as we change the frequency at which we excite the air, is the number of peak and minimum pressures within a given distance. We call one cycle of distance the wave-length (Length of the wave, of course!)
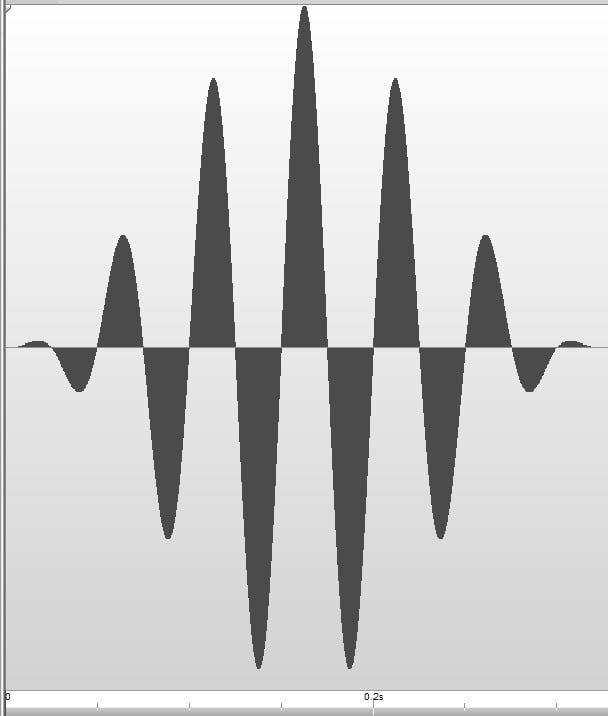
The 6.5 Cycle Waveform Used In Don Keele's CEA Testing Program
Above is the graphic which shows the waveform used in the CEA test program. This waveform has the requisite 1/3rd octave width needed for testing. An important note regarding this test is that the program, and the numbers which we will publish in the specific product reviews are all representing the PEAK output of the subwoofer, NOT the RMS (root mean square) value which is so often the gold standard used to quantify amplifier power, or loudspeaker power handling. This is appropriate because a sine wave has only a 3dB peak to rms ratio. (Meaning a 100 watt RMS sinewave, has a peak value of 200 watts). Subwoofers have such a restricted bandwidth, only the least expensive of them ever get destroyed by heat or rms power delivered. The real test for a subwoofer is in the amount of peak power it can take, and more importantly the peak SPL within reasonable distortion limits it can deliver.
For the CEA measurements, while the harmonics are measured up high, the highest fundamental frequency of importance is 80 Hz, where the wavelength is 168.8 inches long. Because this wave-length is still large compared to the size of the box, and the distance from the acoustic center to the ground, our measurement error resulting from ground-plane measurements remains small. (Of course, since we are looking up to the sixth harmonic of the maximum driving frequency center (63 Hz), we might also want to know how big that 378 Hz wavelength is, since we are not on the speakers main axis, and judging its output up that high by looking at the distortion components!) As the frequency increases, and the box and speaker are no longer small by comparison, the sound no longer envelopes the enclosure or propagates evenly in every direction. At a high enough frequency, the errors from the ground-plane method become so large as to make the measurements useless. That is not the case for the subwoofer bandwidth. Here, the wavelengths are large enveloping bubbles of air that move about equally in all directions. Unless of course, you are on the ground. Here, the air stops, and the vibrations move out not as spheres, but hemispheres. (See graphic below)
What this means is a number of things. If the cabinet is small compared to this wavelength, then placing it and the microphone both on the floor is a pretty good way for us to approximate with relative ease what the speaker does at LOW frequencies ONLY, provided we have a big enough parking lot, and a long enough mike cable, and the sound from the speaker is loud relative to the background noise you are subject to.
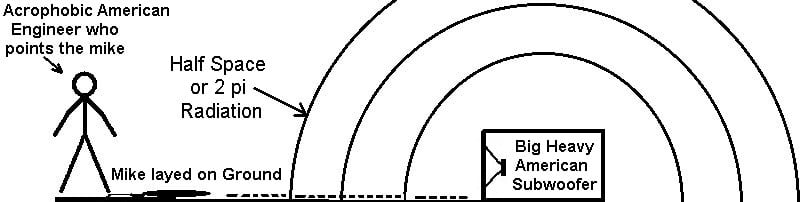
Ground Plane Measurement
This relatively useful approximation to true “free space” radiation (sometimes called 4 pi) is called half-space or (2-pi) radiation. In our case it's technically more correct to refer to it as groundplane since the driver is not flush mounted to the actual ground. In simpler terms, the bubble forming about the speaker (which is at the center of the radiation) is forming a hemisphere about itself, not a complete sphere. If the size of the wave-length were near or less than the distance from the acoustic center of the port or speaker, (relatively high frequencies) this approximation would be poor, and the ground plane technique would introduce intolerable errors. At very low frequencies however, it remains both a practical and well accepted practice among sound professionals for characterizing very low frequency performance of loudspeakers. You will notice the ground-plane technique produces not a full sphere, but rather a half (hemi) sphere of sound. Since we are maintaining the same pressure in half the volume, we find our ground plane measurements show an increase (approaching, yet never exceeding) 6dB compared to the true free space 4 pi measurements (measured at the same distance). Those are the numbers we will show here, and while this results in a source having an effective height double to that made with a free space measurement, the error is acceptably small. (Unless you went out and bought a 90 ft pole, and a really tall ladder already.)
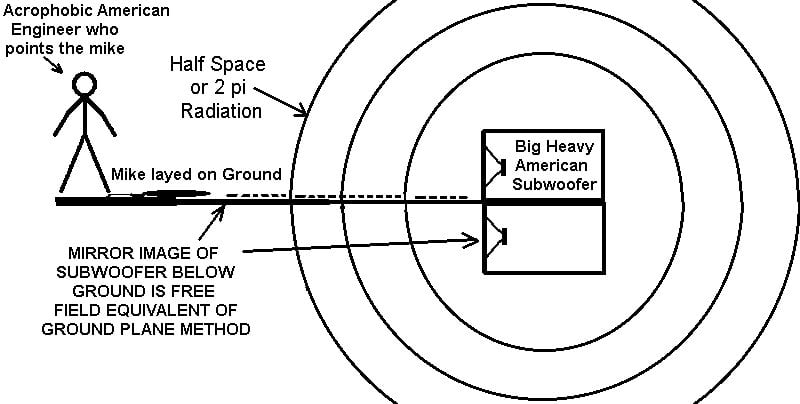
Mirror Image Equivalent of Ground Plane if Done In Free Space
You can think of ground-plane technique like a free space technique where you have two subwoofers stacked one on top of another. The ground itself acts a bit like an acoustic mirror, reflecting the wave that hits it.
For more information about 4pi, 2pi and groundplane, please read: Subwoofer Measurement Tactics
Test Gear Used
- The microphone used was a brand new Earthworks M30 omnidirectional laboratory grade measurement microphone (http://www.earthworksaudio.com/our-microphones/m-series/m30/) which came with a calibration.
- Microphone preamp = True Systems P-Solo (http://www.true-systems.com/p-solo.html)
- Echo Mia Midi Soundcard (http://www.echoaudio.com/Products/PCI/MiaMIDI/index.php)
- Dell Optiplex Computer running Windows XP SP3
- Don Keele's CEA 2010 Measurement software (God bless Don Keele!)
- Lots and lots of cables of every kind, mostly 1/4” TRS and/or XLR Canon
- Far too many large diameter extension cords
- B52 Professional Audio's parking lot (when the rain finally let up)
CEA 2010 Subwoofer Definition
Right off the bat, I was less than impressed with this standard when I got to section 2.2, where they define subwoofer as “A speaker designed to reproduce all or a portion of the audio signals below 120 Hertz (Hz).” Well, by that definition, a mini speaker I use next to my PC which has no bass to speak of, yet a corner frequency of 100Hz (-3dB pt.) is a subwoofer. Clearly this revision of the standard has not yet been put under a lot of scrutiny, but while on the subject, let me attempt to define subwoofer, a word which I am frequently reminded by my spell-checker does not exist as I write it.
A subwoofer is a speaker which is designed to specifically reproduce the lowest usable frequency range of any given sound system. It is usually characterized by a relatively large size of both the cabinet and driver, and generally has limited usable frequency response above 200Hz, especially off the main axis. The term Sub-Woofer (meaning literally below the woofer) is an indication of the intent of its use below (frequency band) a regular woofer, which typically has a frequency range sufficient in bandwidth to cross over to a mid range or high frequency loudspeaker. How is it we all know that, yet the CEA standard seems to define so poorly the very thing which it displays expertise at measuring? I will ask them, and see if they will agree to a different definition.
What's Next?
The actual system testing of course. We are going to bring the subwoofers outside, and find their maximum output by virtue of the CEA testing standard we touched on above. The following articles will have more detail about the actual levels you can expect, as well as some simplified physics, so you can all become experts at judging subwoofers in your own right.