
Legacy Audio Studio HD Bookshelf Speaker Review
Legacy Audio Studio HD Various Finish Options
- Product Name: Studio HD
- Manufacturer: Legacy Audio
- Performance Rating:


- Value Rating:
- Review Date: February 10, 2015 09:00
- MSRP: $ 1795/pair
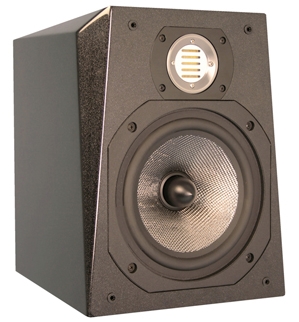
- Tweeter: 1” dual pole AMT folded ribbon
- Woofer: 8" silver/graphite woven diaphragm, cast basket, with phase compensation plug
- Dimensions (WxDxH): 10.8x10.8x13”
- Weight (per speaker): 31 lbs.
- Frequency Response: 41Hz-30kHz (+/- 2dB)
- Sensitivity: 93dB (Room, 2.83V)
- Impedance: 4 Ohm
- Price: $1,795/pr standard finishes (+$185 premium finishes, +$300 exotic finishes)
- Warranty: 7 years
Pros
- Fantastic Mid and High frequency Detail
- Solid Cabinet and Components
- High-end finish options
- Easily switched low and high-filters account for room, placement, and taste
Cons
- Elevated treble response can be unforgiving in reflective rooms or with poor source material
- Still requires a subwoofer for full-range playback with maximum impact
Introduction
The Legacy Studio HDs are larger and higher-performance than most “bookshelf” speakers, but represent only the tip of the iceberg for Legacy Audio’s offerings. Since 1983, Legacy Audio has been manufacturing high-performance speakers in Springfield, IL. For more on their full product range, you can read the review of the more substantial Legacy Focus SE here on Audioholics, or head over to the Legacy website to check out their no-holds-barred statement pieces like the Legacy V, matched with the Legacy Wavelet pre-amp/DSP/DAC ($49,500).
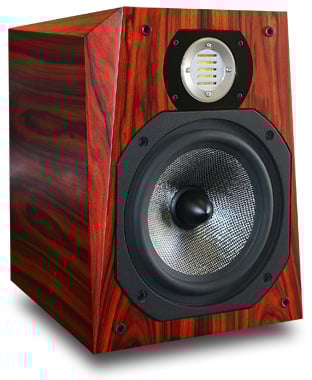
Legacy Audio Studio HD in Black Pearl Finish
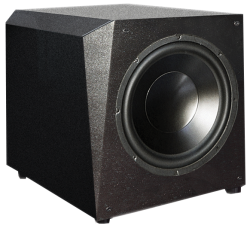
At less than $1,800 per pair in standard finishes ($1,980 as tested), the more diminutive Studio HD Bookshelf speakers have the quality of cabinet and components that trickle down from Legacy’s higher-end offerings, in a more affordable and compact package. Though Legacy makes a number of horizontally-oriented center channels, I requested 3 identical Studio HDs for a matching front soundstage in my 5.1 home theater.
Legacy Audio Studio HD Bookshelf/Monitor Speaker Youtube Video Review
Unpacking and First Impressions
The speakers arrived adequately packaged, in a double-walled-box with reinforced corners. Shipped via pallet, the speakers arrived safe and sound, with the boxes stapled shut for extra durability. Foam inserts up to 3” thick held the speakers securely, and black velvet bags shrouded the speakers themselves. The cloth grills were shipped already attached.
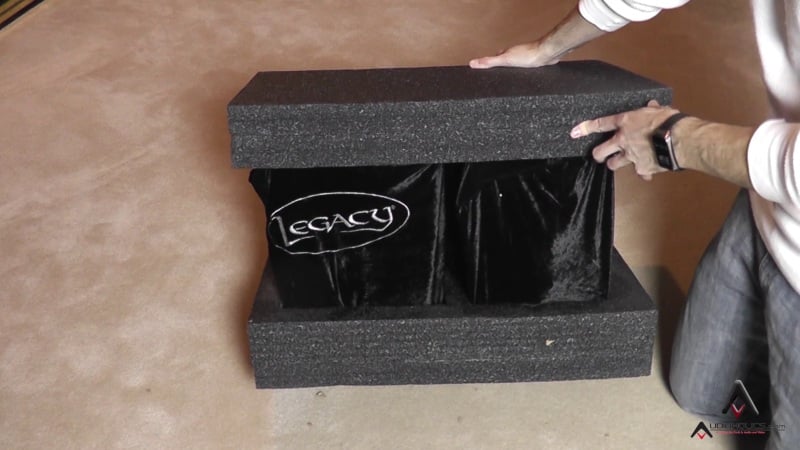
The Legacy Audio Studio HDs were packing in 3" foam and velvet bags.
The Studio HDs were finished in “Black Pearl” in a process that takes 14 steps and 3-weeks to cure the finish. “Black Pearl” could be mistaken for high-gloss piano black from a distance. From a bit closer, it becomes apparent that it's actually a pearlescent sparkle akin to what you'd find on an award-winning show car. It’s just enough to provide a little interest and signal that these are not your run-of-the-mill speakers, without drawing too much attention to themselves. If that doesn't float your boat, you have 10 other options in real wood veneer from Standard Black Oak to some truly ostentatious finishes such as “Exotic Olive Ash Burl” or “Birdseye Maple.”
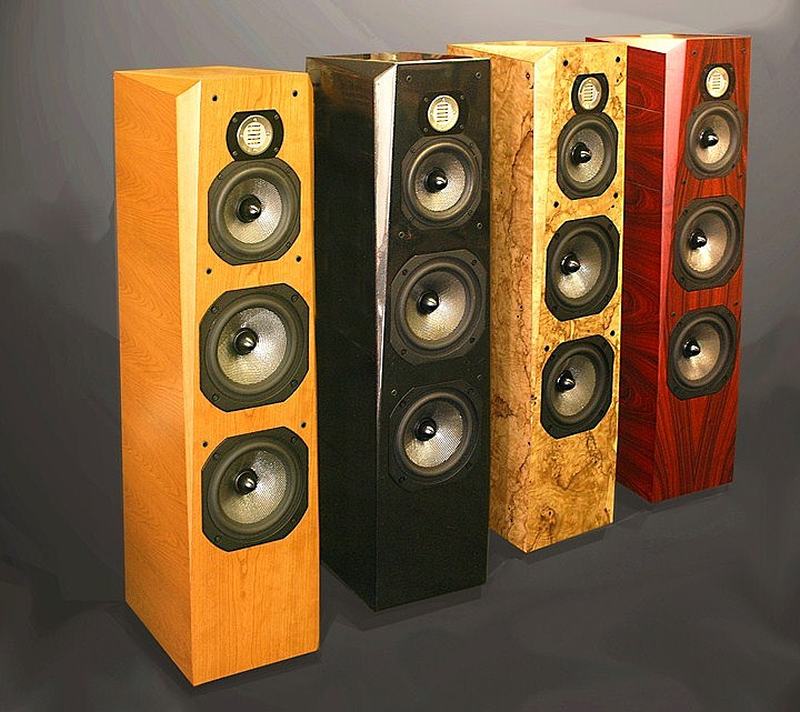
Four of the 11 finishes available, from left to right: Natural Cherry, Black Pearl, Olive Ash Burl, and Rosewood
The cabinet itself is crafted of 1” thick MDF which is thicker than any bookshelf speaker I’ve laid hands on, no doubt contributing to the 31 lb weight of each speaker. These speakers definitely meet our requirements for Identifying Legitimately High End: Cabinets.
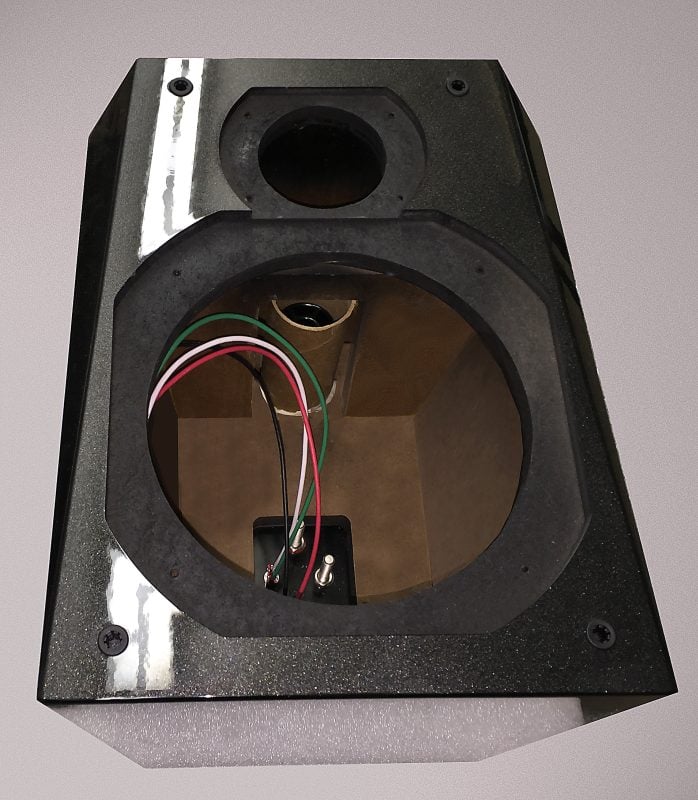
Note the internal bracing, the 1” MDF construction, and the binding posts that will connect directly to the crossover.
The speakers are on the large-side for “bookshelves”, squat in stature, with a 10.8x10.8” base and 13” height. There are only 2 parallel faces, the front baffle and rear panel, as the sides widen at the front and the top angles upward. This serves to reduce internal standing waves, but also gives the speakers more interesting angles than your typical black box. Internal bracing ties together the front, back, and side panels, and is notched to allow for proper airflow through the rear port. Cloth grills, stretched over an MDF frame, are attached via plastic binding posts just shy of a ¼” thick and the grill sits flush to the front of the speaker. If you know me, you know that I really favor magnetic grills, but at least the thick posts on the Studio HD seem very unlikely to break-off.
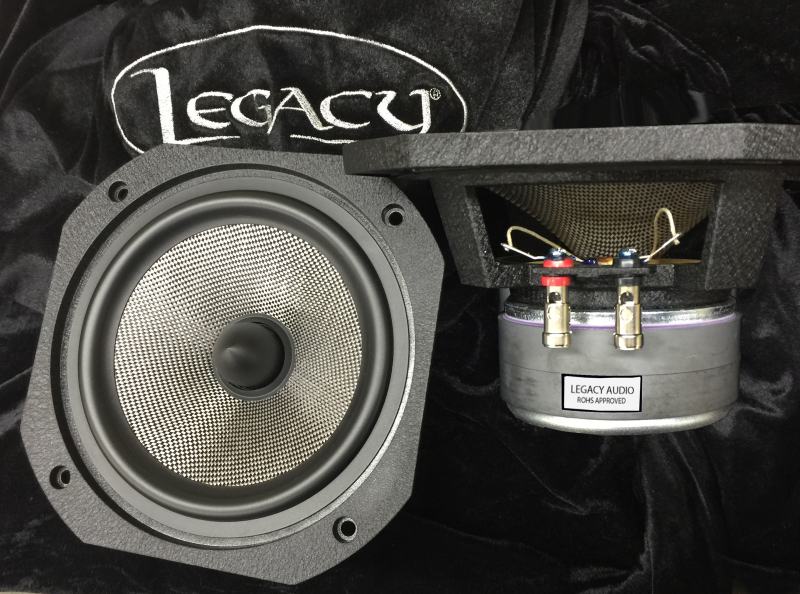
The 8” woofer in the Legacy Studio HD features a double magnet structure and heavy cast frame.
Looking at the driver complement will give you a clue as to where some more of that weight comes from. The Studio HD features a large 8” woven graphite woofer that is exclusive property of Legacy Audio and features a thick, cast basket. The woofer is crossed over at 2.8kHz and phase plug is implemented to prevent acoustic interference across the large surface area of the driver. The tweeter is a metal-encased, 1” AMT, or Air Motion Transformer, which operates like a small accordion squeezing out high frequencies. The use of AMTs is rare, but growing more common as these tweeters are being recognized for their low distortion characteristics and “speed”, an audiophile term for the time it takes a driver to transition from silence to active and back again to silence making staccato notes really snap and high-frequency detail more realistic. The Legacy Studio HDs meet our Identifying Legitimately High End Speakers: Drivers.
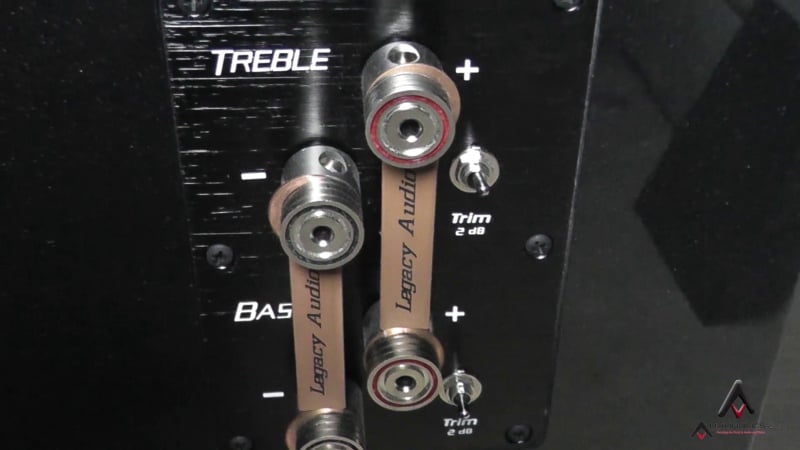
The Legacy Adio Studio HD binding posts and filter switches.
Around the back of the Studio HD, you’ll find 2 pairs of binding posts for bi-amping and a pair of insulated copper jumpers for standard wiring. The Studio HD is rear-ported for greater bass frequency extension, so you might not want to wall-mount these 31 lb speakers. You’ll also find a filter switch that shelves high frequencies by -2dB at 10kHz for bright rooms. Another switch shelves low frequencies by -2dB at 60Hz for placement near boundaries, and raises the impedance for use with budget amplifiers. Left in the “up/off” position, the Studio HD is anechoically flat across a broad range to an order of +/- 2dB from 41Hz-30kHz, according to the manufacturer specs. I’ll revisit the audible effect of these switches in the listening section.
Binding posts all start to look alike after a while, but Legacy has gone to lengths to make theirs stand out. The posts are large enough and spaced wide-enough to accommodate very large wire gauges and the most substantial of spades and rings. I’ll pick one nit here: the posts have a smooth texture with no ridges or knurling. This made for a slightly slippery grip when trying to crank them down tight.
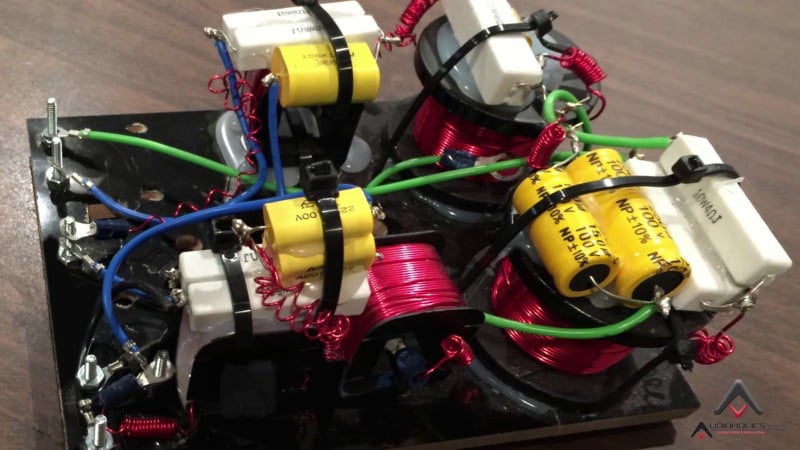
Legacy Studio HD Crossover
The binding posts are also designed to extend all the way through the crossover circuit board for a direct connection to ground and the hand-wired circuit. In talking crossover design, Bill Dudleston, the President and founder of Legacy Audio, notes the capacitors and resistors are positioned atop the chokes to aid as thermal sinks. This also allows Legacy to individually adjust the zobel and driver resonance damping circuits, matching the speakers output first to a reference curve, and then to each other in a matched pair (or set of 3, in my case). Again, these speakers meet our Identifying Legitimately High End Speakers Crossovers.
The process looks like this: a microphone is placed 1.5 meters away, equidistant to each speaker. The input to the right speaker is inverted. This subtractive technique isolates the difference between the loudspeakers, and adjustments are made to minimize the difference. To be clear: this happens to every, single Legacy speaker. Where other manufacturers might simply slap together identical components and hope that manufacturing tolerances are tight enough to provide similar performance from unit to unit, Legacy verifies this by instrument and ear for every product sample to ensure consistency. This hand-tuning of every speaker is, to paraphrase Bill, “where science meets art.”
Connections, Associated Equipment, and Listening Environment
I powered the Legacy Studio HD with my Onkyo TX-SR706 AVR, an older, midrange AVR rated to 4 ohms. They were connected with 12 gauge Blue Jeans speaker cable. The mains were perched atop 24” of cinderblock and the center channel was used with Auralex Mo-Pad isolation pads aimed at ear-level. When used with an SVS PB12-NSD subwoofer, the Studio HD were crossed over at 80Hz. In surround, JBL Control One speakers served as rear channels. In surround listening, 6-point Audyssey MultEQ and Audyssey DynamicEQ were used. The room is lightly-treated, 13x14’ with a vaulted 9-14’ ceiling, and has lots of openings to the rest of the house.
Legacy Audio Studio HD Listening Test
From the first track I fired up, I was struck with how well the Legacy Studio HDs image. In stereo mode with minimal toe-in, vocals were reproduced with pinpoint accuracy right in the center of the left and right speakers. When I sat my partner in the sweet spot and cued up the first verse of Ani DiFranco's track “Hypnotize”, she was convinced that the center channel was active. I was also struck at the high frequency detail of the Studio HDs, bringing Ani’s voice into greater clarity than I had ever heard before, all without harshness which can lead to listening fatigue.

Ani DiFranco - Reprieve
At the same time, cues not anchored in the center enveloped the listener marvelously. In the first 8 seconds of Paul Simon’s “I Know What I Know” the snappy electric guitar danced in the left quarter of my room, while the long-decaying crash seemed to sweep around my right. This was a perfect example of how good the 3D-ness of simple stereo can be. I attribute a great deal of the Studio HD’s imaging quality to the flat high frequency response and detail of the quick-moving AMT tweeters.
Paul Simon - Graceland
I did find that I toed-in the Studio HDs far less than my other speakers. To my ear, the on-axis high-end was a little more pronounced than I preferred. Here is where I tried out that high-filter switch. Flipped in the circuit, the reduction in high-frequencies was suitable for restoring balance in a bright, untreated room, or in a smaller room where positioning may not be ideal. However, in my room, I felt the filter whittled away the lively high-end detail of the Studio HD. In the end, I much preferred the filter “off” and the speakers with only slight toe-in. The produced a spacious image with high-frequency sparkle that brought my music to life.

Cassandra Wilson - Another Country
Staying in Pure Stereo mode, I moved to focusing on low-frequency reproduction. I cued up “Another Country” by Cassandra Wilson from the free High Definition Audio Sampler available at HDtracks.com. With a frequency response rated flat down to 41Hz, I expected the Studio HD to hold their own, and the thrumming, low bass that bubbles below the verses was present, but not quite impactful. In a smaller room, or near-field listening environment, I may have found the low-frequency response adequate for use without a subwoofer, and might have even reached for the low-filter switch. However, when listening in my large, open room at spirited levels, I found that the Studio HDs didn't quite have the low end oomph needed to deliver the track in all its glory.
Legacy Audio Metro Subwoofer
Don't get me wrong: the Studio HDs are sufficient for most music listening; however, like any bookshelf speaker, they are best when mated with a subwoofer. Legacy’s Metro is a perfect aesthetic match for the Studio HD, and would provide true full-range performance. With a sub filling in the last 2 octaves, and the Legacy carrying the lion’s share of the spectrum with their detail, dynamics, and spaciousness, “Another Country” filled the large room with delicate shakers and percussion, Wilson’s rich vocals, and a bouncing bass-line.
Surround/Movies
Now in “.1” mode, it was time to fire up the full 5.1 system and test out some surround content. I stuck with music content by way of Showtime’s “Lost Songs: The Basement Tapes Continued.” This documentary details the partial history of Dylan’s “lost years” in which he retreated to Woodstock, NY and wrote so prolifically that he couldn’t keep track of it all. Decades later, a cache of forgotten lyrics turned up. These lyrics were given to T Bone Burnett to record with the super-group of Elvis Costello, Marcus Mumford, Rhiannon Giddens, Taylor Goldsmith, and Jim James in a session that would become “Lost on the River: The New Basement Tapes.”
Lost Songs: The Basement Tapes Continued | Official Trailer (2014)
The documentary details much of the writing and recording process. The final compositions are multi-layered, but some of the most fun was hearing sparse, single instrument accompaniment build into multi-layered compositions as each artist added their instruments and voice. The realism of these single instruments and the ambiance of the room was well-conveyed by the detailed Studio HD, and then, as the dynamics of the full compositions kick in, the Legacys kept pace with high-output due in part to their greater than average sensitivity. The broad horizontal dispersion characteristic of the Studio HD in the 3 front speaker positions really created a consistent image up front, even when sitting off center, and the detail of these speakers continued to shine from the gravel in Marcus Mumford’s voice as he tries out an early version of “The Whistle is Blowing“, to Rhiannon Giddens’ trailing and fading vibrato in “Spanish Mary”.
Disney's Maleficent - Official Trailer
For blockbuster content, I turned to Disney’s “Maleficent”, a perfectly OK movie with great sound. It’s easy to point to a scene, like the final battle with its fire, explosions, and huge orchestral score, and be impressed dynamic range of the Studio HD. But, here again, it’s the audio detail present, even in more subtle cues, that continues to impress. The way footsteps echo in a large empty room has a realism that really transports you to the cavernous hall. When a chain is thrown, you would swear that you could count the links by sense of hearing alone.
Legacy Audio Studio HD Measurements and Analysis
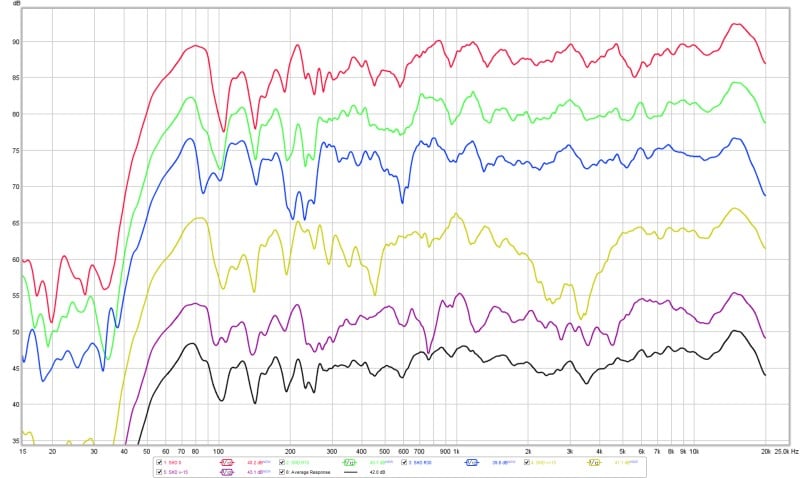
The graph below shows the frequency response of the Legacy Studio HD on-axis (red), 15 (green) and 30 (blue) degree off-axis horizontally, 15 degrees off-axis above (yellow) and below (purple) the tweeter, and an average of these responses (black) at 1 meter, smoothed 1/12 of an octave, and offset for easier viewing. All measurements were taken in room, so keep in mind that the low-frequency response is affected by room modes.
Listening window response of the Legacy Audio Studio HD
And here is the average response spliced at 300Hz with a .5 meter indoor ground-plane measurement for a more accurate picture of the bass response.
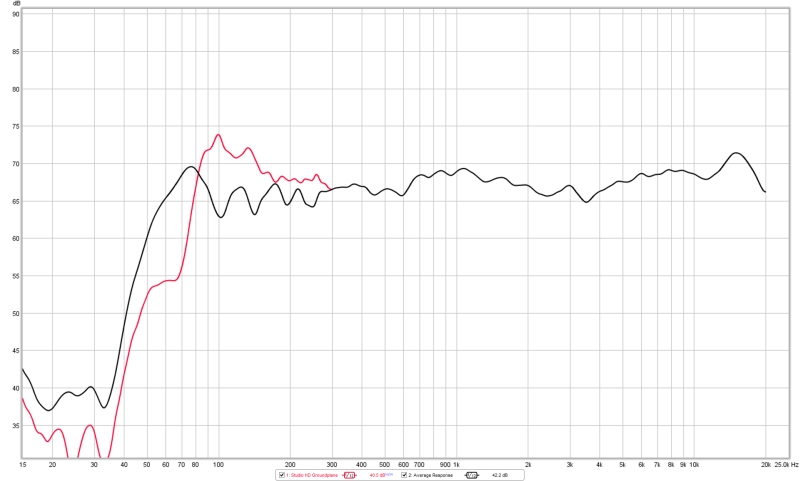
Averaged Listening Window Response (Black) and Indoor .5 meter groundplane (Red)
You might notice that slight rise around 15kHz. All measurements were taken with the grill off, while I did the vast majority of my listening with the grill on. In the graph below, you can see on-axis measurements with the grill on (red) and off (blue), and how that rise is flattened with the grill in place.
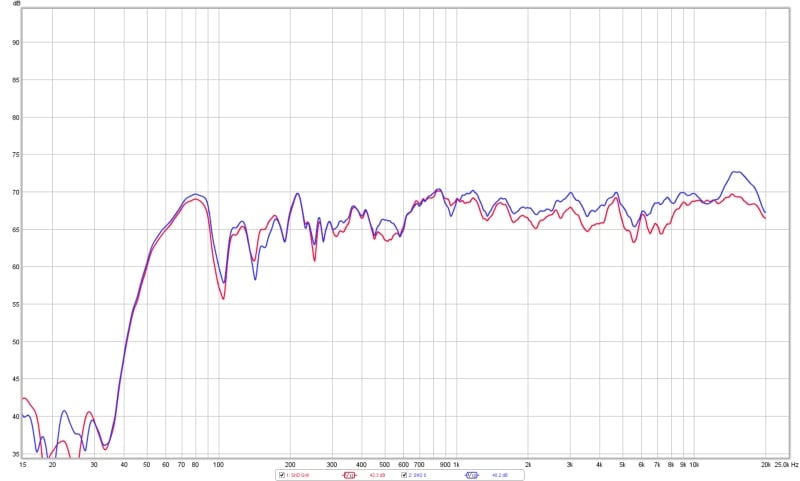
In-Room Frequency response, on-axis, with the Grill On (Red) vs Grill Off (Blue)
Below is the on-axis response as affected by the Treble Filter Switch.
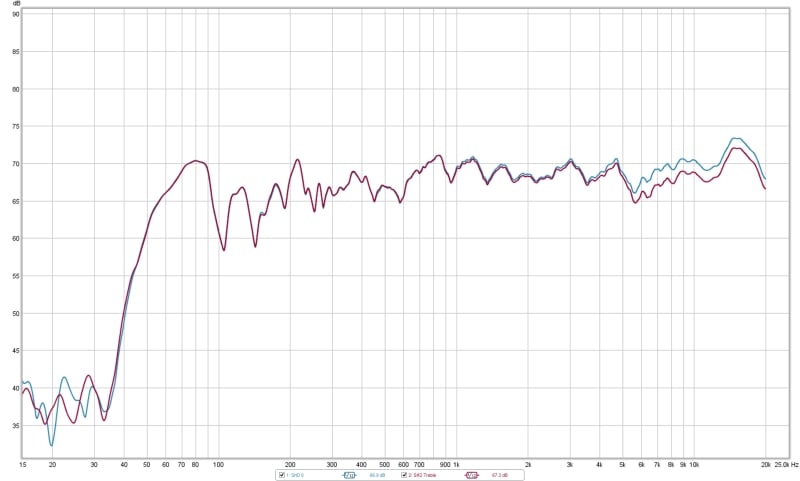
In-Room Frequency response, on-axis, with the Treble Filter In (Red) vs Out (Blue)
The treble filter produced predictable results, dropping the high frequencies centered at 10kHz by about 1.5dB, a little less than spec.
Legacy Audio Studio HD Conclusion
 Can I just say
these are amazing speakers and a great value, and leave it there? Probably not.
After all, there are plenty of speakers that deliver fantastic detail,
dynamics, and imaging. However, to my
ears, the Legacy Studio HDs provided the best mid and high frequency detail that
I’ve ever heard in my room. They cast a
huge image that is forgiving of positioning, and they reproduce frequency range
and dynamics on par with some of the best bookshelves (though a subwoofer is
still required for full-range impact.)
Simply put, at the end of several nights of listening sessions since
these speakers arrived, I’ve fallen asleep each time thinking about how good
these speakers sounded while I was listening.
I’ve had to fight the urge to get out of bed and go back to listening,
beauty rest be damned. If this is
Legacy’s entry level, I’d hate to think about how much sleep I’d lose listening
to their higher-end models.
Can I just say
these are amazing speakers and a great value, and leave it there? Probably not.
After all, there are plenty of speakers that deliver fantastic detail,
dynamics, and imaging. However, to my
ears, the Legacy Studio HDs provided the best mid and high frequency detail that
I’ve ever heard in my room. They cast a
huge image that is forgiving of positioning, and they reproduce frequency range
and dynamics on par with some of the best bookshelves (though a subwoofer is
still required for full-range impact.)
Simply put, at the end of several nights of listening sessions since
these speakers arrived, I’ve fallen asleep each time thinking about how good
these speakers sounded while I was listening.
I’ve had to fight the urge to get out of bed and go back to listening,
beauty rest be damned. If this is
Legacy’s entry level, I’d hate to think about how much sleep I’d lose listening
to their higher-end models.
Of course, they should sound good. Despite being downright modestly priced compared to some high end offerings, they are also the second-most expensive bookshelf speakers I’ve had in my room. Nonetheless, I consider them one of the best values I’ve heard, especially, when taking into account the return on a long-term investment for a lifetime of good sound and pride of ownership of having a US-made speaker so well crafted.
If I were talking to myself from 10 years ago, past-Marshall would think I was crazy for calling an $1,800/pair speaker a remarkable value. Of course, he also thought Canadian LTD was "good hooch" and only owned two pairs of shoes. But, present-day-Marshall finds himself appreciating the vast distance between "good" and "good enough". The Legacy Studio HDs are exciting and refined speakers, but priced at a point that even past-Marshall could have afforded if he’d only redirected some money from his whiskey budget. If he had, he'd still be happy listening to them 10 years later. I can’t give the Legacy Audio Studio HD speakers anything less than my highest recommendation for speakers in the $1,000/each or less category.
Legacy Audio Studio HD Bookshelf/Monitor Speaker Youtube Video Review
Legacy Audio Studio HD Review
MSRP: $1795/pair
Address:
3023 E Sangamon Ave.
Springfield, IL 62702
United States of America
Contact Details:
E-mail: info@legacyaudio.com
Telephone: 800-283-4644 or (217) 544-3178
Web: http://www.legacyaudio.com
Sales: sales@legacyaudio.com
The Score Card
The scoring below is based on each piece of equipment doing the duty it is designed for. The numbers are weighed heavily with respect to the individual cost of each unit, thus giving a rating roughly equal to:
Performance × Price Factor/Value = Rating
Audioholics.com note: The ratings indicated below are based on subjective listening and objective testing of the product in question. The rating scale is based on performance/value ratio. If you notice better performing products in future reviews that have lower numbers in certain areas, be aware that the value factor is most likely the culprit. Other Audioholics reviewers may rate products solely based on performance, and each reviewer has his/her own system for ratings.
Audioholics Rating Scale
 — Excellent
- — Very Good
- — Good
- — Fair
- — Poor
| Metric | Rating |
|---|---|
| Build Quality | |
| Appearance | |
| Treble Extension | |
| Treble Smoothness | |
| Midrange Accuracy | |
| Bass Extension | |
| Bass Accuracy | |
| Imaging | |
| Soundstage | |
| Dynamic Range | |
| Fit and Finish | |
| Performance | |
| Value |
Marshall is an Educator by trade, and currently lives in Oregon. He was lucky enough to grow up in a musical household, and though the AV equipment wasn't the greatest, it was always on. His dad introduced him to Queen, Paul Simon, and Sgt. Pepper's, and his mom played Lionel Richie and Disney Soundtracks. When Marshall was 14, his uncle passed down a pair of JBL towers and Marshall finally had his own system. Having enjoyed podcasting and video production over the past 10 years, Marshall is happy to be contributing at Audioholics.
View full profile