
Loudspeaker Power Ratings Part III: The Test Results
Originally published: September 24, 2008
In parts one and two, I made a case for the idea that real power handling was intimately tied to the nature of the signal, as well as the electromechanical parameters of the speaker under test. We reviewed basic electrical concepts of power, relying on the universal concepts of Current, Voltage and Impedance in determining what the actual power delivered to the speaker load was, instead of the much more common method of calculating it by a knowledge of the voltage and nominal impedance only.
In Power Handling part three, I perform an experiment to determine if the underlying theory has merit, or if I am simply full of hot air. (Hot air is not good for either loudspeakers or authors.)
Before continuing on, be sure to check out our recent YouTube video discussion on matching amplifier power to loudspeakers.
YouTube Discussion: The Truth about Matching Amplifier Power to Loudspeakers
Today we will examine test results of three (3) samples of the same 6.5” midbass speaker provided with the courtesy and generosity of Axiom Audio. All three samples are tested to make sure they are normal in regards to their DCR (to be sure there are no shorted turns or large Impedance variations). All three drivers are subject to a sweep from 20 Hz to 5000 Hz to be certain that none of them are buzzing or rubbing so that we can ensure the samples are not defective prior to power testing them. Having decided I had 3 good samples, I hooked these small (but valiant) drivers to a QSC PLX3002 power amplifier, capable of delivering 550 watts per channel (stereo mode) into an 8 ohm load. I start at the modest level of 28.3 volts, or 100 watts into a nominal 8 ohm load, with one channel using white and the other pink noise. The signal is generated by Sound Tech Spectra RTA software (Version 1.32.16a) running under Windows 2000 on a Digital Audio Labs Cardelux Sound card. The balanced analog outputs of the Sound card are connected directly to the input of the QSC PLX3002 amplifier.
The speakers were wired with short lengths of 16 gauge stranded copper wire, and the voltage was measured at the amplifier terminals with a FLUKE model 45 five digit multimeter. This meter is one of the few that can actually give us true RMS readings without the caveat that the signal must be a 1000 Hz sine wave (Like most “True RMS” meters sold do).
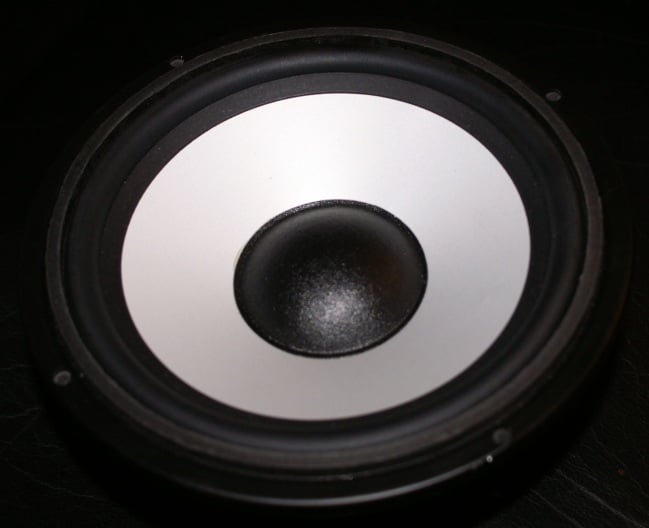
6.5 Inch Woofer with 1
inch Diameter Voice Coil
When the speakers were subjected to the signal, I could tell immediately from the tonal characteristics, which was driven with pink versus white noise. Even deaf, if one looks at the drivers under test, the motion of the Pink noise driven speaker is considerably larger than the white noise driver under test. What is also obvious from this is the cooling of the VC (Voice Coil) caused by air passing across its surface while it pumps back and forth was far better on the speaker with pink noise than it was on the speaker with white noise.
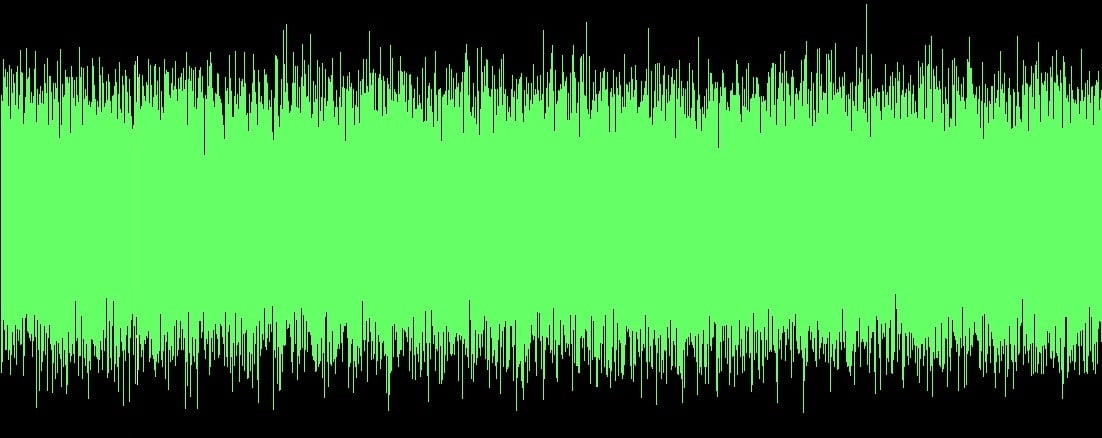
WHITE NOISE OSCILLOGRAM
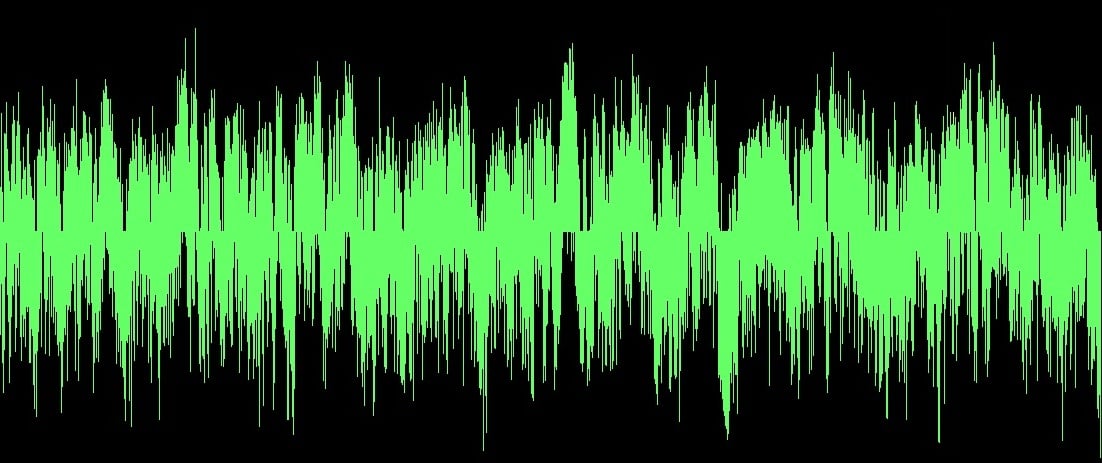
PINK NOISE OSCILLOGRAM
Both of these drivers were powered simultaneously and placed without an enclosure into the bottom of an empty speaker box with the front of the box facing up so the sound (and heat) emanate out of the box. The drivers are 6 inches apart so they are in a similar ambient temperature, in an air conditioned lab set to 72 degrees F. Although the voltage across both speakers was the same, if my proposed theory is correct, based on the impedance variations of a normal loudspeaker, and this one in particular (see below), the actual power delivered to the load by the pink noise should be much higher.
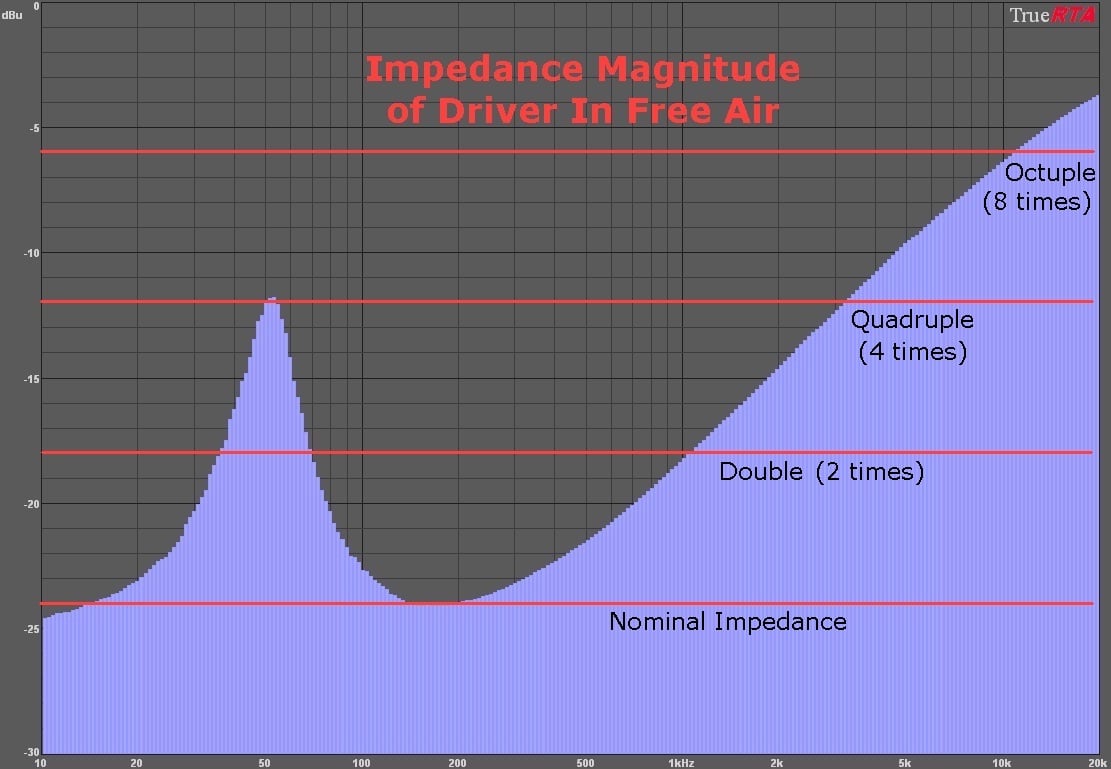
IMPEDANCE VARIATION VERSUS FREQUENCY OF SPEAKER UNDER TEST
If that is in fact the case, the pink noise speaker should perish first. As review, we can look again at the spectrum of white noise (equal energy per unit hertz) versus pink noise (equal energy per unit octave) below.
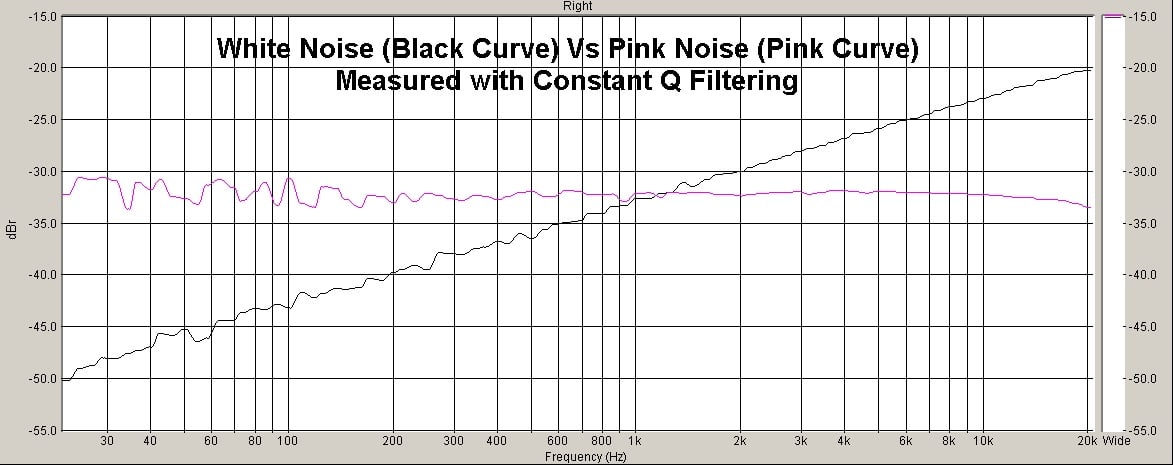
POWER SPECTRUM OF WHITE VERSUS PINK NOISE
Since white noise is weighted heavily towards high frequencies where the Impedance (AC resistance to flow of current) is very high in a typical woofer owing to voice coil inductance, then the actual power delivered will be much less than what is delivered with a signal having more low frequencies. Therefore with the same voltage, the Pink Noise speaker is actually receiving MORE power, and will therefore burn out sooner than the white noise speaker. (If my theory is correct).
After about ½ hour, the tonal characteristics of the speakers began to change. There was no smell of burnt VC, so I assumed this was a result of a large change in the DCR of the voice coils with its subsequent changes to the speakers frequency response. What was also clear from watching the speakers is how much more the white noise speaker was moving just a ½ hour after the beginning of the test compared to the beginning of the test. (Compliance increase due to break-in I theorize.)
After 45 minutes of cooking (I mean testing) the speakers at 28.3 volts without any evidence they were going to fail, I raised the signal input by 1db to 125 Watts to further stress them. I continued this 1db incremental rise in drive until one or both of the speakers failed. After 10 minutes at the 125 Watt RMS level, I notice the smell of VC was getting strong so I began checking in every 5 minutes to see the health of the patients. About 15 minutes into the 125 watt portion of the test, I started to hear a slight clicking noise. Free air testing with Pink Noise is a particularly brutal way to destroy a loudspeaker. In most instances (especially in the high-fidelity end of the speaker business) most speaker/box combinations are far more stiff than are the speakers alone in free air. The result is signals that will destroy the speakers in free air do not do so when the same exact speaker is fitted to a properly designed box. The box, especially in a sealed or closed box design, adds a great deal of stiffness to the suspension that is not available from the spider and surround alone. That stiffness results in far less excursion of the woofer at low frequencies and therefore less chance of self destruction from application of very low frequency energy.
After ½ hour at 125 watts, and no destruction, I raised the level of the signal by another 1 db to 160 watts. At this level, I was smelling burnt VC within the first 30 seconds and my belief was that we have reached the end of the line for at least one of the test participants. 15 minutes later, to my surprise, the burnt VC smell was still powerful, but more amazing is that both speakers were still going strong, and neither has of yet bit the dust. (Nor ignited the box stuffing!) (An examination of the failures after the fact reveals why this small loudspeaker would endure so much thermal energy, so please gentle reader, read on).
Loudspeakers & Power Ratings Part III: The Test Results Continued
After 90 minutes of testing without failure, I pump it up to 200 watts RMS, in the hope of putting this speaker to bed. Well, at this point, the smell was reminiscent of a garbage dump on a really hot day. The amp was running out of voltage, so either this bad boy gives up or I’d have to retest with the amp set to bridged mode. (6 minutes later...) OK!! We have TOAST!! At 1 hour and 36 minutes into the test, the pink noise speaker gave up with a puff of smoke. I dare not put my hand in there for fear of getting burnt by the hot frame. The heat from the speaker was intense enough that it can be felt from 6 inches above the driver. I removed the speaker and indeed, the frame was too hot to touch. After 10 minutes of cooling down, I noticed the speaker was so hot, it burned a hole through the polyester fibers lining the back of the test box! The white noise tested speaker by comparison was only slightly warm to the touch. This, in my mind was proof positive that the actual power delivered by 28.3 volts of white noise was considerably less real power to this speaker load than 28.3 volts of pink noise. (Photo Below...)
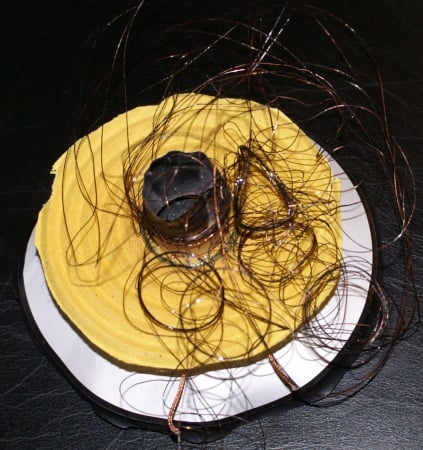
200 WATTS RMS OF PINK NOISE RESULTS
Upon dissection, it appeared the VC wire got so hot it expanded right off the bobbin (or former) and was sitting in the bottom of the gap. I had to remove it a turn at a time, and so it appeared like a plate of spaghetti. (photo above)
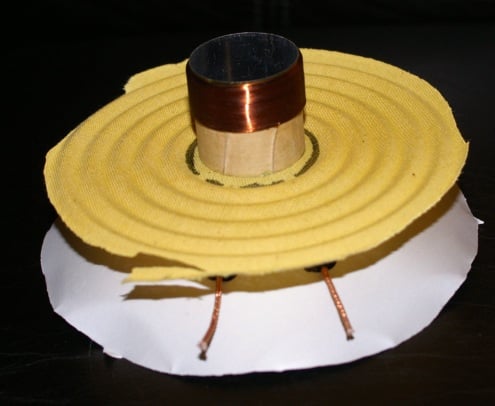
THIS IS WHAT A NORMAL UNBURNT VC LOOKS LIKE
Upon inspection of the deceased, it became apparent why it took so much power to burn this speaker. The VC wire was wound on an Aluminum bobbin, which in turn was directly coupled to an aluminum cone. This combination of parts allowed much heat to be drawn away from the VC, keeping it cooler than almost all other 1” VC's of this height and size would be. Kudos to the designers at Axiom for an excellent design job.
I remove the deceased, and replace it with subject # 3, the speaker which was going to get tested with a tone burst. Bear in mind, the tone burst was DESIGNED to kill the speaker. It was designed to do NOTHING else. The frequency is at the speakers free air resonance so this will maximize the excursion required for the given voltage, PLUS the impedance magnitude is so high at resonance, the current demand is only ¼ of what it is at 200 Hz. (See Impedance magnitude curve). The combination of high excursion and low current draw is a guarantee that this signal will break the speaker long before it is burnt.
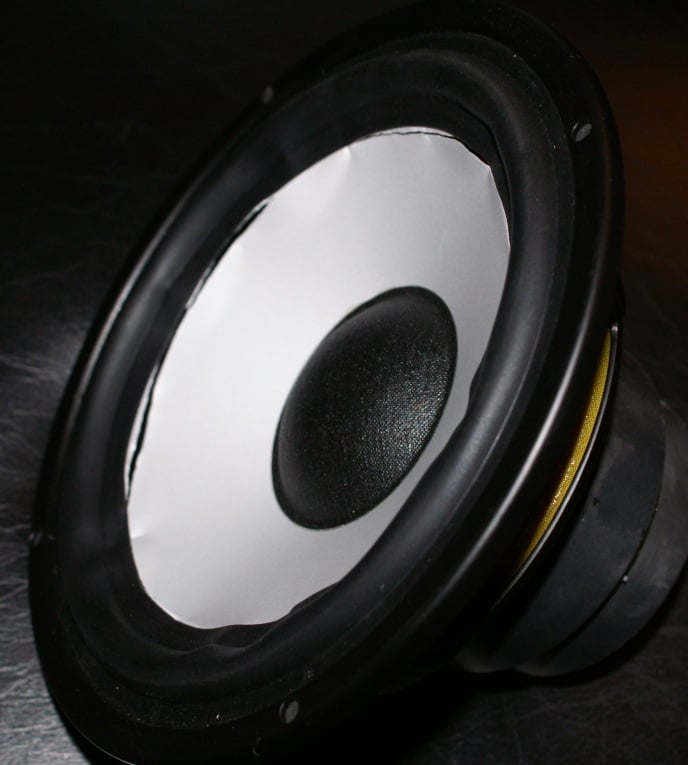
1100 WATT PEAKS DESTROY THIS SPEAKER QUICKLY
The RMS level was set with the signal constant, and then the duty cycle was set for the signal to be on for 11 cycles and off for 99 cycles. That means the speaker was excited for 1/10th of the time so the RMS level drops by 10 db relative to the always on condition. This required more voltage than the amp was able to deliver when hooked up in the stereo mode. I therefore limited the peaks to 1100 watts for the tone burst part of the test. In under 60 seconds, I noticed the speaker (which sounded OK) looked warped. A closer examination revealed the speaker cone was torn near the surround/cone bond-line, and had partially separated from the surround. (See photo above)
This failure results from the enormous peak causing the speaker to move with sudden explosive force. It breaks at the point where the cone/surround subassembly goes from being thickest to thinnest, the point where the cone attaches to the inside edge of the surround flange. (See photo). Bear in mind, 1100 watts (peak from the 550 watt RMS tone burst) is almost 1.5 horsepower. Considering the duty cycle of this signal, the RMS value is only 55 watts!!
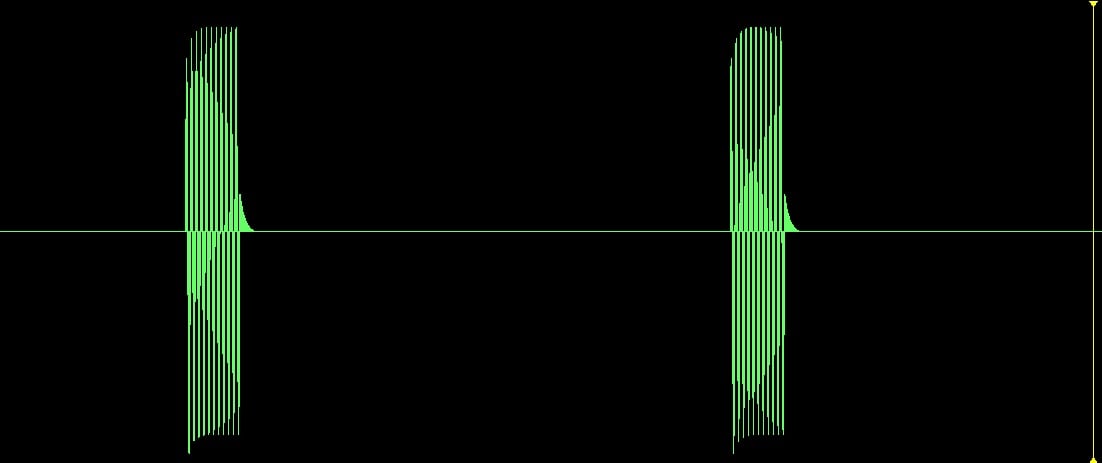
TONE BURST 11 CYCLES ON 99 CYCLES OFF
Oscillogram of same tone burst below, viewed over 11 cycles.
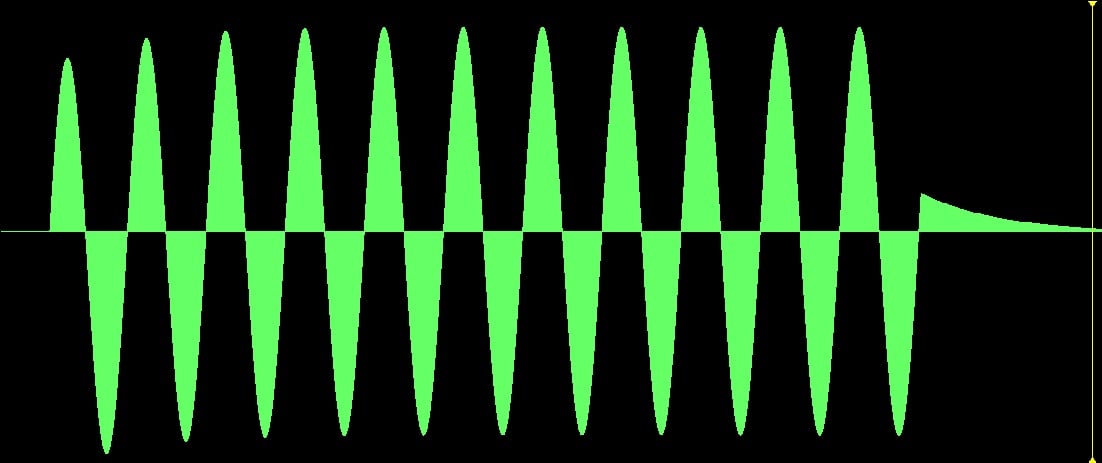
11 CYCLES OF 55 HZ
Conclusions
There are two ways to kill a loudspeaker; thermal or mechanical.
In this experiment we destroyed one of these small drivers in each way. The most dangerous and destructive signal used was one composed of a single low frequency tone burst on for 11 cycles and off for 99. Despite this signal containing only 55 watts of RMS power, the speaker failed as a result of the peak voltage, correlating to a power (into nominal impedance) of 1100 watts peak. Peaks of very short duration can serve to destroy a loudspeaker even though they are of such a short duration, they are not able to heat up the speaker significantly. Frequency content and Peak to RMS ratio (crest factor) are critical in determining the potential for loudspeaker destruction of a test signal. The loudspeakers impedance magnitude gives us clues as to the potential harm from a signal based on the variation of impedance with frequency.
High frequencies are NOT DANGEROUS to the typical woofer, and the notion that clipped signals of a given RMS value are more dangerous to a woofer than unclipped signals is not necessarily correct. Clipped signals do put a higher percentage of amplifier power into the tweeter or high frequency device, and are therefore more dangerous to multi driver systems or high frequency units. Low frequency drivers (woofers) have very high impedances at high frequencies and are therefore not able to easily draw power from the amplifier at the highest frequencies. Without specifying the frequency content and crest factor of the test signal used, the POWER HANDLING NUMBER IS MEANINGLESS!