
Human Hearing: Amplitude Sensitivity Part 1
The human ear has been held by armchair acousticians and physicists as The Ultimate Microphone Ever Created. I suppose in a superficial way that sentiment has, at first glance, a satisfying ring of truth to it. Reality, though, holds a different opinion.
Truth is there are today microphones that can, with ease, outperform the human ear. Where the ear may, however, lay claim to the ultimate mic award is when it's considered in combination with the post-processor to which it is hard wired, namely, the human brain. Now there is one formidable combination!
Head out on the Internet and pull together a collection of research documents devoted to the process of hearing and two things quickly become apparent: (1) Its one complex and fascinating topic; and (2) there is much more research that needs to be done.
I propose to put together within this primer an outline-form collection of characteristic parameters known by psychoacoustics (the field of science devoted to studying how we perceive sound and extract meaningful data from acoustical signals) to describe the performance of the ear-brain combination. Knowing how we hear, as well as understanding the limits that define our auditory mechanism, is essential when rendering subjective judgments on the performance of any piece of audio hardware.
I. Amplitude
Canonically quoted as 20 Hz to 20 kHz, the frequency response across the audible spectrum is probably that characteristic most familiar to audio pro and enthusiast alike, as well as being that which has been most thoroughly studied by those who build careers and make their living studying such things.
The 1937 Fletcher - Munson Equal Loudness curves (Graph 1) and later the 1956 Robinson - Dadson Equal Loudness Curves (Graph 3) are but two examples of research into the response of the ear/brain system to pure tones, in this case at varying loudness levels (with loudness being expressed in phons).
As such, the charts actually present equal loudness contours: pick a point on any given contour and all other frequencies along that continuum of frequency points will be subjectively perceived by the listener as being equally loud.
It's clear from the chart just how adaptive the ear\brain combination is to varying levels of intensity: note how the contours change with varying loudness levels. Select a particular contour, invert it and you now have the relative frequency response plot of the human ear for all frequencies on that particular contour.
You've no doubt noticed that the high frequency data as gathered by the two research teams is in conflict. A subsequent study by Hellman, et. al. concluded that of the data presented by the two studies, the Robinson - Dadson data was the more accurate of the two. Graph 2 shows the Hellman study's data curves (RIEC data) compared to the Robinson - Dadson and Fletcher - Munson curves at 15 & 16 kHz
Today, the Robinson - Dadson curves are generally preferred over the Fletcher - Munson curves owing to their more reliable measurement results. The International Standards Organization agreed and adapted the Robinson - Dadson curves as the basis for ISO 226:1987; Normal Equal-Loudness Level Contours (ELLC).
Beneath the outward simplicity of the Robinson - Dadson ELLC lays a wealth of useful information. For example, f ocus now on the lower 3 or 4 octaves of the contour plots in Graph 2. The steep negative slope of the curves illustrate just how important low levels of non-linear distortion in LF drivers are, where it comes to the accurate reproduction of music by way of a loudspeaker system. For example, at 20 Hz the absolute threshold of hearing is ~ 70 dB. Given a 20 Hz tone at that level (and the initial slope of ~ -24dB/octave) a 2nd harmonic at 40 Hz playing 24dB down from the fundamental would sound equally as loud as the fundamental. And if the 3rd harmonic were playing at ~40 dB down, it too would sound equally as loud as the fundamental.
Much is made of the ear's sensitivity at the mid and upper-mid range portions of the audible spectrum (as well it should be), but the realities presented by the ELLC all add up to the requirement of low-level LF distortion that cannot be ignored either, where it comes to the accurate reproduction of music.
The absolute threshold of hearing (ATH) mentioned earlier is defined as the intensity level where a sound becomes just audible. For a continuous tone of between 2 kHz and 4 kHz, perceived by a person with excellent hearing acuity under ideal listening conditions, this is defined as 0.0002 dyne/cm2 (also expressed as: 2 x 10⁻⁴ microbar (µbar); 2 x 10⁻⁵ Newton/m2 (N/m2); or 2 x 10⁻⁵ Pascal (Pa)). and is given the reference level of 0 dB. The MAF (minimum audible field, dB SPL for pure tones ) curve seen in the Robinson - Dadson chart is the ATH curve.
At the intensity levels encountered along the MAF curve the human ear drum is vibrating with a displacement on the order of ~.000000001 cm. And that's just as sensitive as the ear needs to be: were it any more sensitive than that, we'd be treated to the never-ending white noise of molecular density fluctuations, or Brownian movement. Clearly, then, there exists very real lower limits to which even the goldenest golden-eared audiophile or critic must abide by - and there are no exceptions.
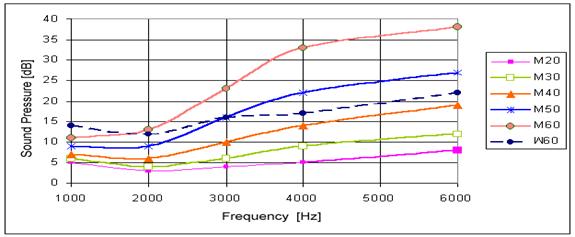
The actual ATH attained in practice by an individual is highly frequency, age, sex, and background-noise level dependent. Graph 3 shows ATH performance attained by men (M) & women (W) for the 20 to 60 year age group.
We've seen minimum detectable levels and how they represent limits where it comes to discerning very low level acoustic signals. But what about small changes in level at a given frequency - how small a change is actually discernable?
Differences in intensity or more specifically just noticeable differences (JND) are how the
acuity of the human ear is assessed where it comes to discerning very small changes in acoustic signal intensity at particular frequencies. The Difference Limen (DL) is the amount of change in intensity necessary to produce a JND in perceived loudness. The relative intensity DL (determined by previous research using the forced-choice testing paradigm) can be calculated to a good approximation by:
DL I = I / I = 0.463 · ( I / I 0 ) -0.072
Where: I = the intensity of the sound in Watt/m2,
I 0 = the intensity of the auditory threshold (i.e. 10-12 Watt/m2 at 1000 Hz),
I = the JND.
Alternatively, we can calculate the number of DLs above threshold by:
(1 / (0.463·0.072)) (10 (0.072/10)(10log( I / Io )) - 1)
In earlier research, Reisz did a study of differential thresholds for intensity as a function of intensity. His research showed (Graph 4) that once you are well above ATH, IDL remains fairly constant (around .5 - 1 dB) and remains so across a broad range of intensities. Essentially, his research showed that the ear/brain combination maintains very good intensity discrimination in the face of varying intensity; though this ability lessens the closer the intensity gets to the ATH. Another words, as things get quieter, the ears ability to discern level differences decreases.
Years later (1977), Jestaedt, et. al. would also document this trend in decreasing discrimination as levels decrease.
Speaking now in terms of dB SPL, the minimum discernable changes by the human ear/brain mechanism I've seen in the research that I've reviewed ranged from about 0.5 dB to 3 dB, depending on a number of factors.
|
Study Authors |
Year Published |
Min. Detectable Fluctuation |
|
Reisz |
1928 |
~1 dB |
|
Dimmick & Olson |
1941 |
JND = 1.5 dB to 3 dB |
|
Atal, et. al. |
1962 |
~ 1 dB |
|
Jestaedt, et. al. |
1977 |
JND @ 80 dB = 0.5 dB JND @ 5 dB = 1.5 dB |
|
Toole and Olive |
1988 |
.25 dB for a 5kHz resonance, Q = 1 |
In Table 1 we see a collection of studies spanning 60 years. It should be kept in mind that in each case the results were obtained under laboratory-ideal conditions. Even so, we see a range of values from .25 dB to 3 dB. The resultant range is owing to varying methodologies used by the researchers and, of course, the response of the human hearing apparatus to the applied acoustic signals.
For example, Reisz in his 1928 study used two tones, close in frequency that beat slowly.
The beating caused amplitude fluctuations and the minimum audible fluctuation was ~ 1dB. Toole and Olive, on the other hand, in their 1988 study used pink noise for their acoustic signal source and determined that a 5 kHz resonance, with Q = 1 was just detectible at .25 dB.
They found pink noise to be the most revealing signal. They did employ other types of acoustic signals in their study and discovered that when using the least revealing of these that just detectible threshold increased by a factor of 5.
From the third column of Table 1, we see the minimum detectable value, for the most part, hovers around 1 dB, +/- a fraction of a dB, and that attainable only with ideal (or at least as ideal as technology allowed for at the time the study was done) laboratory test conditions and test subjects. I tend to use .75 dB to 1 dB when considering minimums.
Editorial Note
One of the most difficult aspects of writing about human hearing performance is that there are so few absolutes to be found in the mountains of variables that characterize the process of human hearing. Choosing the .75 to 1 dB limit of discernment was based on the research cited, along with long-standing personal experience.Over the years I've had my hands on plenty of gain controls and EQ sliders and often experimented with minimums. My experience has been when real music (as opposed to pink noise, burst tones, etc ) is played back in real (as opposed to laboratory) settings that the minimum level differences I've been able to discern is in the range of .75 dB to 1 dB.
This held true whether I was in a 3-chair living room experimenting with an EQ or a 3000-seat venue where I have enough power at my fingertips to light up a small city.
They represent the minimum change I can hear while still guaranteeing that I'm on the safe side of the line where reality ends and the placebo effect begins.
The .25 dB figure quoted from the Toole & Olive research seems to contradict this, but consider the filter Q = 1. That's a pretty broad chunk of the audible spectrum over which that resonance exists. With the ear-brain combo performing an integration across that broad a portion of the audible spectrum than its easy to see how a large amount of acoustical energy is captured, leaving a change that small noticeable. However, pink noise is not real world and one thing my research has shown is that the hearing process reacts very differently to different types of sound; a .25 dB detectable difference using real music just isn't plausible and the research supports that.
Bibliography
B. Atal, M. Schroeder, K. Kuttruff, "Perception of Coloration in Filtered Gaussian Noise Short-time Spectral Analysis of the Ear", 4th ICA , Copenhagen , Denmark 1962, paper H31.
F.L. Dimmick and R. M. Olson, '`The Intensive Difference Limen in Audition" JASA, vol. 12, pp. 517-525 (1941)
W. Jesteadt, C. C. Weir and D. M. Green, "Intensity Discrimination as a Function of Frequency and Sensation Level" JASA, vol. 61, pp. 169-177 (1977)
R. Reisz, "Differential Intensity Sensitivity of the Ear for Pure Tones", Physical Review, vol 31, pp 867-875 (1928)
F.E. Toole and S. Olive, "The Modification of Timbre by Resonances: Perception and Measurements", JAES vol 36, # 3, March 1988, pp 122-142
R. Hellman, et. al., "Determination of Equal-loudness Relations at High Frequencies", Department of Psychology and Institute for Hearing, Speech, and Language, Northeastern University, Boston, MA USA,