


Amplifier Damping Factor Explained: Why This Spec Doesn’t Tell the Whole Story
Amplifier Damping Factor
original publish date: August 30, 2004
Much ballyhoo surrounds the concept of amplifier damping factor, and for decades it has been used to explain alleged differences in sound between tube and solid-state amplifiers. Damping factor is fundamentally related to an amplifier’s output impedance and the impedance of the loudspeaker load. The basic premise has some physical validity: a sufficiently low amplifier output impedance can help control the motion of a loudspeaker driver at resonance and elsewhere. For example:
"reducing the output impedance of an amplifier and thereby increasing its damping factor will draw more energy from the loudspeaker driver as it is oscillating under its own inertial power."
This is certainly true—to a point. But many claims surrounding damping factor, particularly the supposed need for extremely high triple-digit or even higher values, exaggerate its importance. Once amplifier output impedance is sufficiently low, simply increasing the damping-factor number does not necessarily translate into tighter bass, better sound quality, or audibly superior loudspeaker control. Consider this claim:
"a damping factor of 5, ..., grossly changes the time/amplitude envelope of bass notes, for instance. ... the note will start sluggishly and continue to increase in volume for a considerable amount of time, perhaps a second and a half."
As we’ll demonstrate, the reality is considerably more nuanced. A single damping-factor specification also doesn’t tell the whole story about how an amplifier will interact with a loudspeaker. Loudspeaker impedance varies considerably with frequency, and an amplifier’s output impedance and frequency response can also vary with frequency and load. This can result in load-dependent frequency-response changes that a manufacturer’s single damping-factor number may not reveal.
That’s why damping factor should be considered alongside measurements of an amplifier’s frequency response into different load impedances, such as 8-ohm and 4-ohm loads. An amplifier that maintains essentially the same response as the load changes behaves more like an ideal voltage source, while a load-variant amplifier can interact with a loudspeaker’s complex impedance in ways that alter frequency response. As we’ll see, this behavior can occur with different amplifier topologies, making the quality of the implementation more important than simply whether an amplifier is Class D, Class A/B, or another design.
So how much damping factor is actually enough, and what should we be measuring instead of obsessing over one impressive-looking number? That’s where the engineering—and the measurements—become far more interesting.
Amplifier Damping Factor: This Spec Doesn’t Tell the Whole Story 🤔
What is Damping Factor in Amplifiers?
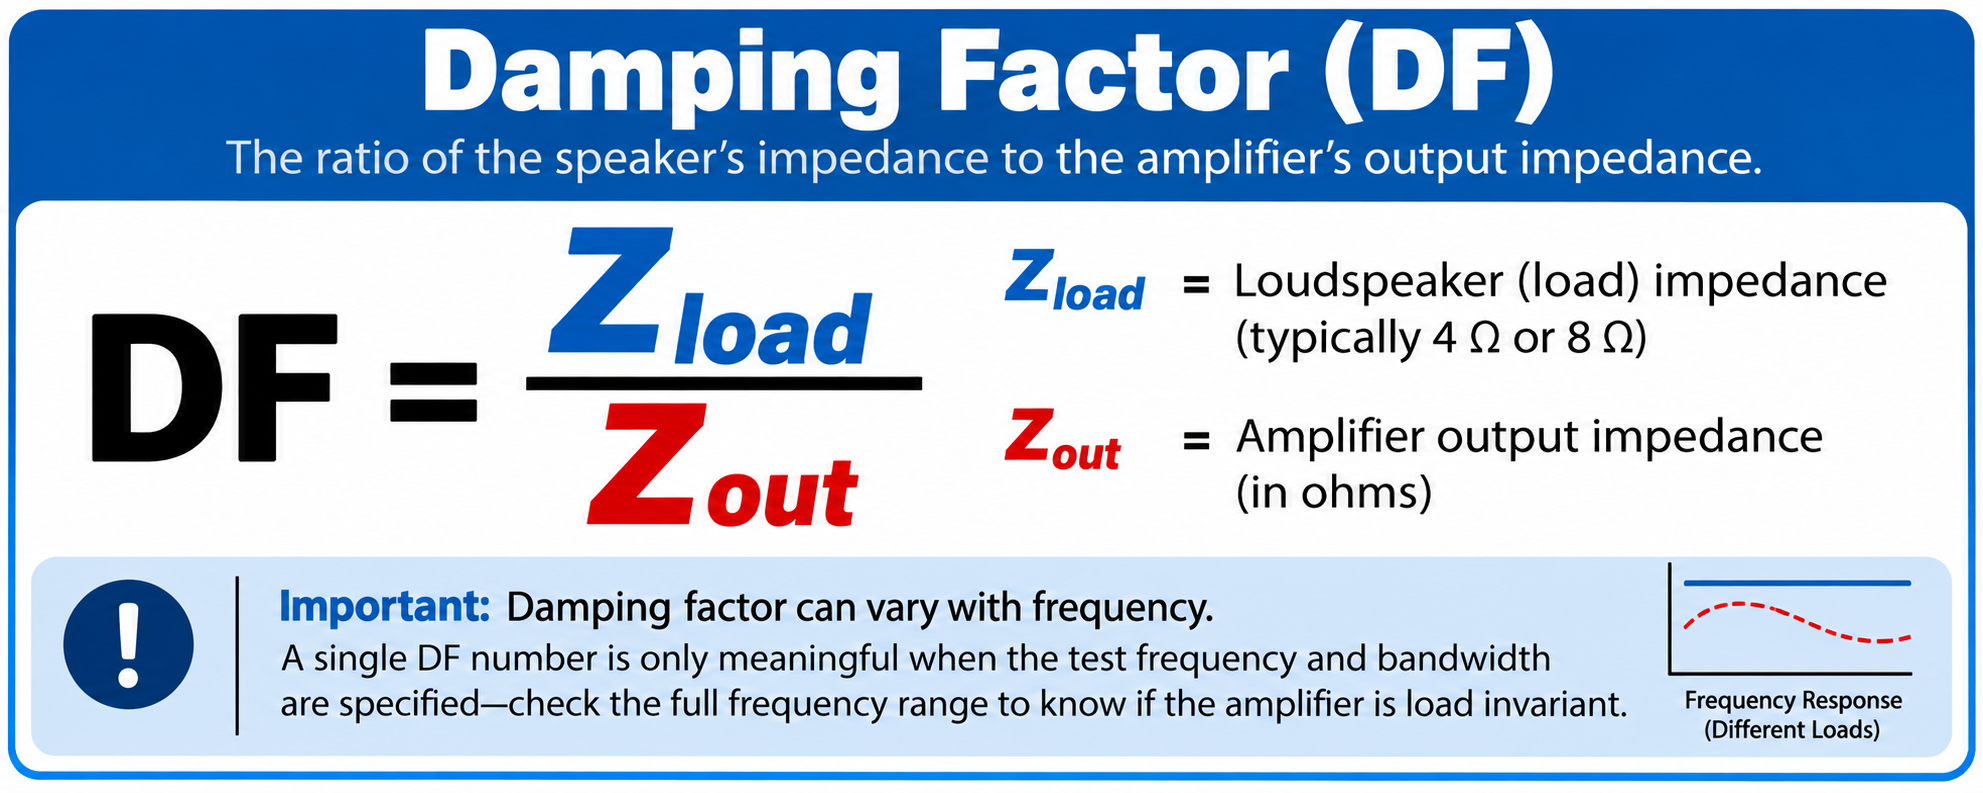
What is damping factor? Simply stated, it is the ratio between the nominal load impedance (typically 8W ) and the source impedance of the amplifier. Note that all modern amplifiers (with some extremely rare exceptions) are, essentially, voltage sources, whose output impedance is very low. That means their output voltage is independent, over a wide range, of load impedance.
Many manufacturers trumpet their high damping factors (some claim figures in the hundreds or thousands) as a figure of some importance, hinting strongly that those amplifiers with lower damping factors are decidedly inferior as a result. Historically, this started in the late '60's and early '70's with the widespread availability of solid state output stages in amplifiers, where the effects of high plate resistance and output transformer windings traditionally found in tube amplifiers could be avoided.
Is damping factor important? Maybe. We'll set out to do an analysis of what effect damping factor has on what most proponents claim is the most significant property: controlling the motion of the speaker where it is at its highest, resonance.
The subject of damping factor and its effects on loudspeaker response is not some black art or magic science, or even excessively complex as to prevent its grasp by anyone with a reasonable grasp of high-school level math. It has been exhaustively dealt with by Thiele and Small and many others decades ago.
System Q and Damping Factor
The definitive measurement of such motion is a concept called  . Technically, it is the ratio of the motional impedance to losses at resonance. It is a figure of merit that is intimately connected to the response of the system in both the frequency and the time domains. A loudspeaker system's response at cutoff is determined by the system's total
  , designated
  , and represents the total resistive losses in the system. Two loss components make up
  : the combined mechanical and acoustical losses, designated by
  , and the electrical losses, designated by
  . The total
  is related to each of these components as follows:

 is determined by the losses in the driver suspension, absorption losses in the enclosure, leakage losses, and so on.
  is determined by the combination of the electrical resistance from the DC resistance of the voice coil winding, lead resistance, crossover components, and amplifier source resistance. Thus, it is the electrical
  ,
,  , that is affected by the amplifier source resistance, and thus damping factor.
The effect of source resistance on  is simple and straightforward. From Small(3):
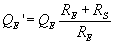
where  is the new electrical
  with the effect of source resistance,
  is the electrical assuming 0W source resistance (infinite damping factor),
  is the voice coil DC resistance, and
  is the combined source resistance.
It's very important at this point to note two points. First, in nearly every loudspeaker system, and certainly in every loudspeaker system that has nay pretenses of high-fidelity, the majority of the losses are electrical in nature, usually by a factor of 3 to 1 or greater. Secondly, of those electrical losses, the largest part, by far, is the DC resistance of the voice coil.
Now, once we know the new  due to non-zero source resistances, we can then recalculate the total system
  as needed using eq. 2, above.
The effect of the total  on response at resonance is also fairly straightforward. Again, from Small, we find:
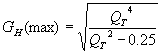
This is valid for  values greater than 0.707. Below that, the system response is over-damped and there is no response peak.
We can also calculated how long it takes for the system to damp itself out under these various conditions. The scope of this article precludes a detailed description of the method, but the figures we'll look at later on are based on both simulations and measurements of real systems, and the resulting decay times are based on well-established principles of the audibility of reverberation times at the frequencies of interest.
Practical Effects of Damping Factor on System Response
With this information in hand, we can now set out to examine what the exact effect of source resistance and damping factor are on real loudspeaker systems. Let's take an example of a closed-box, acoustic suspension system, one that has been optimized for an amplifier with an infinite damping factor. This system, let's say, has a system resonance of 40 Hz and a system  of 0.707 which leads to a maximally flat response with no peak at system resonance. The mechanical
  of such a system is typically about 3, we'll take that for our model. Rearranging Eq. 1 to derive the electrical
  of the system, we find that the electrical
  of the system, with an infinite damping factor, is 0.925. The DC resistance of the voice coil is typical at about 6.5 W . From this data and the equations above, let's generate a table that shows the effects of progressively lower damping factors on the system performance
|
Damping |
R S |
Q E ' |
Q T ' |
G H(MAX) |
Decay |
|
¥ |
0 W |
0.925 |
0.707 |
0.0 dB |
0.04 sec |
|
2000 |
0.004 |
0.926 |
0.707 |
0.0 |
0.04 |
|
1000 |
0.008 |
0.926 |
0.708 |
0.0 |
0.04 |
|
500 |
0.016 |
0.927 |
0.708 |
0.0001 |
0.04 |
|
200 |
0.04 |
0.931 |
0.71 |
0.0004 |
0.04 |
|
100 |
0.08 |
0.936 |
0.714 |
0.0015 |
0.04 |
|
50 |
0.16 |
0.948 |
0.72 |
0.0058 |
0.04 |
|
20 |
0.4 |
0.982 |
0.74 |
0.033 |
0.041 |
|
10 |
0.8 |
1.04 |
0.77 |
0.11 |
0.043 |
|
5 |
1.6 |
1.15 |
0.83 |
0.35 |
0.047 |
|
2 |
4 |
1.49 |
0.99 |
1.24 |
0.056 |
|
1 |
8 |
2.06 |
1.22 |
2.54 |
0.069 |
The first column is the damping factor using a nominal 8W load. The second is the effective amplifier source resistance that yields that damping factor. The third column is the resulting  caused by the non-zero source resistance, the fourth is the new total system
  that results. The fifth column is the resulting peak that is the direct result of the loss of damping control because of the non-zero source resistance, and the last column is the decay time to below audibility in seconds.
Damping Factor: Effects On System Response
Analysis
Several things are apparent from this table. First and foremost, any notion of severe overhang or extended "time amplitude envelopes) resulting from low damping factors simple does not exist. We see, at most, a doubling of decay time (this doubling is true no matter what criteria is selected for decay time). The figure we see here of 70 milliseconds is well over an order of magnitude lower than that suggested by one person, and this represents what I think we all agree is an absolute worst-case scenario of a damping factor of 1.
Secondly, the effects of this loss of damping on system frequency response is non-existent in most cases, and minimal in all but the worst case scenario. Using the criteria that 0.1 dB is the smallest audible peak, the data in the table suggests that any damping factor over 10 is going to result in inaudible differences between that and one equal to infinity. It's highly doubtful that a response peak of 1/3 dB is going to be identifiable reliably, thus extending the limit another factor of two lower to a damping factor of 5.
All this is well and good, but the argument suggesting that these minute changes may be audible suffers from even more fatal flaws. The differences that we see in  figures up to the point where the damping factor is less than 10 are far less than the variations seen in normal driver-to-driver parameters in single-lot productions. Even those manufacturers who deliberately sort and match drivers are not likely to match a
  figure to better than 5%, and those numbers will swamp any differences in damping factor greater than 20.
Further, the performance of drivers and systems is dependent upon temperature, humidity and barometric pressure, and those environmental variables will introduce performance changes on the order of those presented by damping factors of 20 or less. And we have completely ignored the effects presented by the crossover and lead resistances, which will be a constant in any of these figures, and further diminish the effects of non-zero source resistance.
Frequency-Dependent Attenuation
The analysis thus far deals with one very specific and narrow aspect of the effects of non-zero source resistance: damping or the dissipation and control of energy stored in the mechanical resonance of loudspeakers. This is not to suggest that there is no effect due to amplifier output resistance.
Another mechanism that most certainly can have measurable and audible effects are response errors due to the frequency dependent impedance load presented by the speaker. The higher the output resistance of the source, the greater the magnitude of the response deviations. The attenuation can be approximated given the source resistance and impedance vs. frequency:
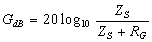
where  is the gain or loss due to attenuation,
  is the amplifier source resistance, and
  is the frequency dependent loudspeaker impedance.
As a means of comparison, let's reexamine the effects of non-zero source resistance on a typical speaker whose impedance varies from a low of 6 ohms to a high of 40 ohms.
|
Damping |
R G |
G dB(MIN) |
G dB(MAX) |
G dB(ERROR) |
|
¥ |
0 W |
0 dB |
0 dB |
0 dB |
|
2000 |
0.004 |
-0.006 |
-0.001 |
±0.003 |
|
1000 |
0.008 |
-0.012 |
-0.002 |
±0.005 |
|
500 |
0.016 |
-0.023 |
-0.003 |
±0.01 |
|
200 |
0.04 |
-0.058 |
-0.009 |
±0.025 |
|
100 |
0.08 |
-0.115 |
-0.017 |
±0.049 |
|
50 |
0.16 |
-0.229 |
-0.035 |
±0.098 |
|
20 |
0.4 |
-0.561 |
-0.086 |
±0.23 |
|
10 |
0.8 |
-1.087 |
-0.172 |
±0.46 |
|
5 |
1.6 |
-2.053 |
-0.341 |
±0.86 |
|
2 |
4 |
-4.437 |
-0.828 |
±1.8 |
|
1 |
8 |
-7.360 |
-1.584 |
±2.9 |
As before, the first column shows the nominal 8 ohm damping factor, the second shows the corresponding output resistance of the amplifier. The second and third columns show the minimum and maximum attenuation due to the amplifier's source resistance, and the last column illustrates the resulting deviation in the frequency response caused by the output resistance.
What can be seen from this analysis is that the frequency dependent attenuation due to the amplifier's output resistance is more significant than the effects on system damping. More importantly, these effects should not be confused with damping effects, as they represent two different mechanisms.
However, these data do not support the assertion often made for the advantages of extremely high damping factors. Even given, again, the very conservative argument that ±0.1 dB deviation in frequency response is audible, that still suggests that damping factors in excess of 50 will not lead to audible improvements, all else being equal. And, as before, these deviations must be considered in the context of normal response variations due to manufacturing tolerances and environmental changes.
Damping Factor Doesn't Tell the Whole Story: Load Variance Matters
By: Gene DellaSala
Damping factor is typically published as a single scalar number, but that number alone doesn't tell us how an amplifier behaves across the entire audio bandwidth or into different loudspeaker impedances. Since damping factor is related to an amplifier's output impedance, ideally we want that output impedance to remain sufficiently low and well controlled with frequency. A manufacturer claiming a damping factor of 200, 500, or even 1,000 without specifying the test frequency or bandwidth therefore gives us an incomplete picture of amplifier behavior.
This becomes particularly important when examining an amplifier's frequency response into different loads. A well-designed amplifier should behave essentially as a voltage source, maintaining nearly the same frequency response whether it is driving an 8-ohm or 4-ohm resistive load. If the response changes appreciably as load impedance changes, the amplifier is load variant, meaning its interaction with a real loudspeaker's frequency-dependent impedance can alter the resulting frequency response. This extends the mechanism discussed above: loudspeakers don't present a constant impedance with frequency, so an amplifier whose output characteristics also vary with frequency can produce measurable—and in sufficiently large cases potentially audible—response differences. Audioholics
This is why Audioholics amplifier testing looks beyond a manufacturer's damping-factor specification. Measuring frequency response unloaded and into 8-ohm and 4-ohm loads across the audio band can reveal behavior that a single damping-factor number may conceal. Some Class D amplifiers, for example, can exhibit high-frequency load dependence associated with their output-filter implementation, while other Class D designs remain remarkably load invariant. Linear Class A and Class AB amplifiers can likewise exhibit excellent load-invariant behavior when properly engineered. The amplifier topology itself therefore doesn't determine the result—the implementation does.
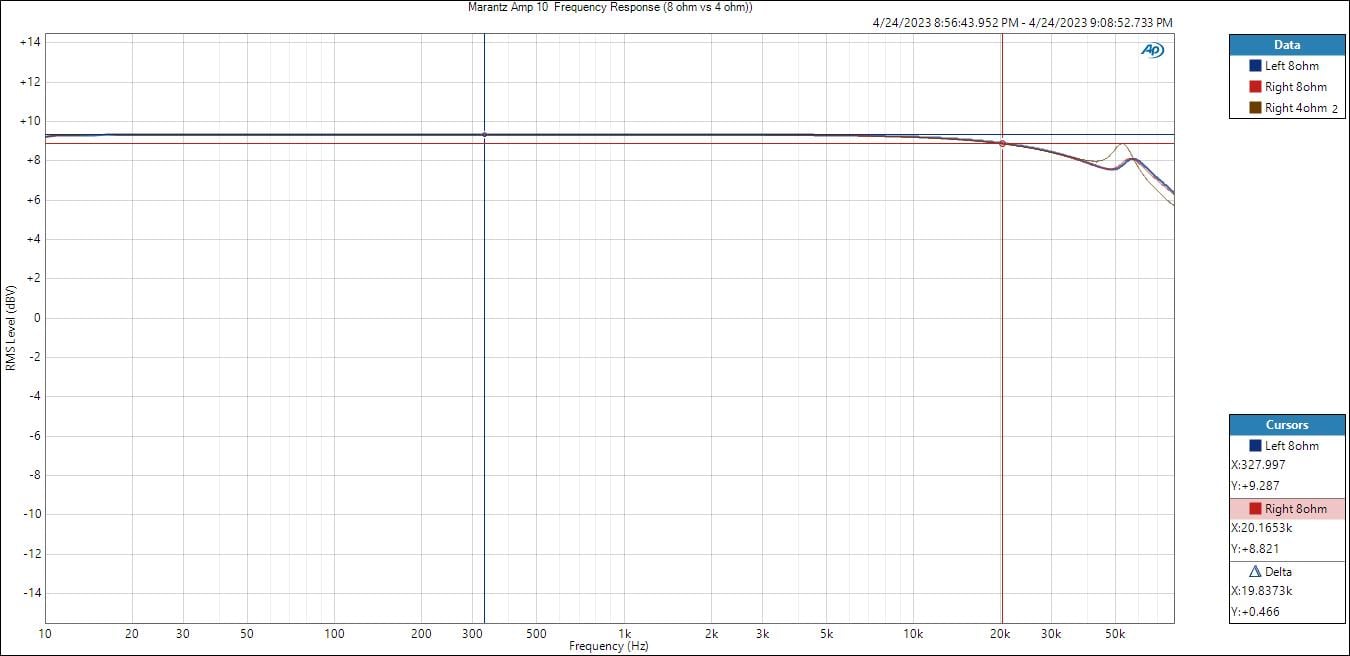
Marantz AMP 10 Frequency Response Comparison - No load, 8-ohms, 4-ohms
In our accompanying video, at the beginning of this article, we examine actual amplifier measurements illustrating these differences, including Class D designs using ICEedge (Marantz AMP 10) and Hypex, an Axiom amplifier exhibiting significant high-frequency peaking/load variance, the Lyngdorf TDAI-3400, and a high-performance linear amplifier whose response remains remarkably consistent with changing load impedance. The takeaway isn't that damping factor is meaningless. Rather, a single damping-factor specification shouldn't be used in isolation to judge amplifier performance. Frequency response versus load provides valuable additional information about how an amplifier may interact with real loudspeakers.
Conclusions
There may indeed be audible differences caused by non-zero amplifier source resistance. However, the analysis, measurements, and listening evidence presented here demonstrate that these differences are not adequately explained by the popular notion that extremely high damping factors are required to “control” the loudspeaker cone at system resonance. Even when we consider the larger frequency-response variations caused by the non-flat impedance-versus-frequency behavior of real loudspeakers, the magnitude of the traditional damping problem is simply not what is often claimed.
But that doesn’t mean we should ignore amplifier output impedance or damping factor altogether. A single damping-factor specification doesn’t tell the whole story. Damping factor and output impedance can vary with frequency, and some amplifiers exhibit measurable changes in frequency response as the load changes. Since real loudspeakers present complex, frequency-dependent impedances rather than fixed 8-ohm or 4-ohm resistances, a load-variant amplifier can interact with the loudspeaker and alter system frequency response.
This is why measuring an amplifier’s frequency response unloaded and into different impedances, such as 8-ohm and 4-ohm loads, across the audible bandwidth can be more revealing than simply comparing published damping-factor numbers. A well-engineered amplifier should maintain a largely consistent frequency response as the load changes, regardless of whether it uses Class D, Class A/B, or another topology.
The takeaway is not that damping factor is meaningless, nor that the highest number automatically produces better sound. Once damping factor is sufficiently high, chasing ever-larger numbers offers little useful information by itself. Instead, look at how the amplifier actually behaves across frequency and into different loads. When evaluating amplifier/loudspeaker interaction, frequency response versus load can tell us far more than an impressive damping-factor number printed on a spec sheet.
Appendix
The debate over damping factor is hardly a recent one. For example, the following letter appears in the August 1947 issue of Wireless World:
"In your April issue, D. T. N. Williamson refers to electromagnetic damping of a baffle-loaded loudspeaker, through low output resistance of the amplifier, as being important. I used to think so myself, and was the first to use the word 'damping factor' but my belief was much shaken by the following argument.
"If a loudspeaker can be represented by an equivalent circuit consisting of a resistance in series with an 'ideal' loudspeaker of 100 per cent efficiency, then the damping must be applied across the input terminals.
"In this case, even if the amplifier output resistance is zero, the damping is limited by the series resistance which, for 5 per cent efficiency, would be twenty times the resistance of the ideal loudspeaker. This extreme simplification, of course, leaves out the reactive components of the speaker impedance, but the argument still holds qualitatively.
"Can any reader of Wireless World point out any error in this argument? If it is true, there is very little gained by attempting to achieve excessively low output resistances."
F. Langford Smith,
Sydney, Australia
August 1947
Copyright © 1994-2003 by Dick Pierce.
Permission given for one-time no-charge electronic distribution. All other rights reserved.
 Subscribe to our newsletter