
RBH Sound T-30LSE Signature Tower System Review
T-30LSE
- Product Name: Special Edition Signature Series T-30LSE
- Manufacturer: RBH Sound
- Performance Rating:

- Value Rating:

- Review Date: January 06, 2007 18:00
- MSRP: $ 15000/pr
|
Model Name/Number: T-30LSE Primary Use: Freestanding Tower Series: Signature Series System Type: 3-way Sealed & Bass Reflex Frequency Response: 18Hz — 20kHz ± 3dB Sensitivity: 91dB (2.83 Volts @ 1 Meter) Recommended Power: 150-700 Watts Drive Units: (2) 10” Aluminum Cone Subwoofers (4) 6 1/2h Aluminum Cone Woofers (3) 1” Silk Dome Tweeters
|
Crossover Frequency: 80Hz, 2000Hz Crossover Slope: Asymmetrical 6-18dB/Octave Impedance: 4 Ohms Color: Custom Veneers Only Grille: Black Cloth Video Shielding: No Dimensions: 15 ½” W x 60 ½” H x 18” D Weight: 160 Lbs. Warranty: 5 Years |
Pros
- Unparalleled audio performance at any price
- Limitless dynamics
- Lifelike soundstage
Cons
- Big and heavy
- Expensive
- Bulky
RBH Sound T-30LSE Introduction
The RBH Sound T-30LSE system is a speaker system cut from a different cloth. It provides that "better than being there" sonic experience typically only found in unamplified live musical performance. It was born to reproduce music with unparalleled realism, free of dynamic range or bandwidth limitations. This system can go toe-to-toe sonically with some of the most expensive gear made and comfortably hold its own. With only 100 pairs being produced, you better get your dose of overindulgence before they are going going … gone.
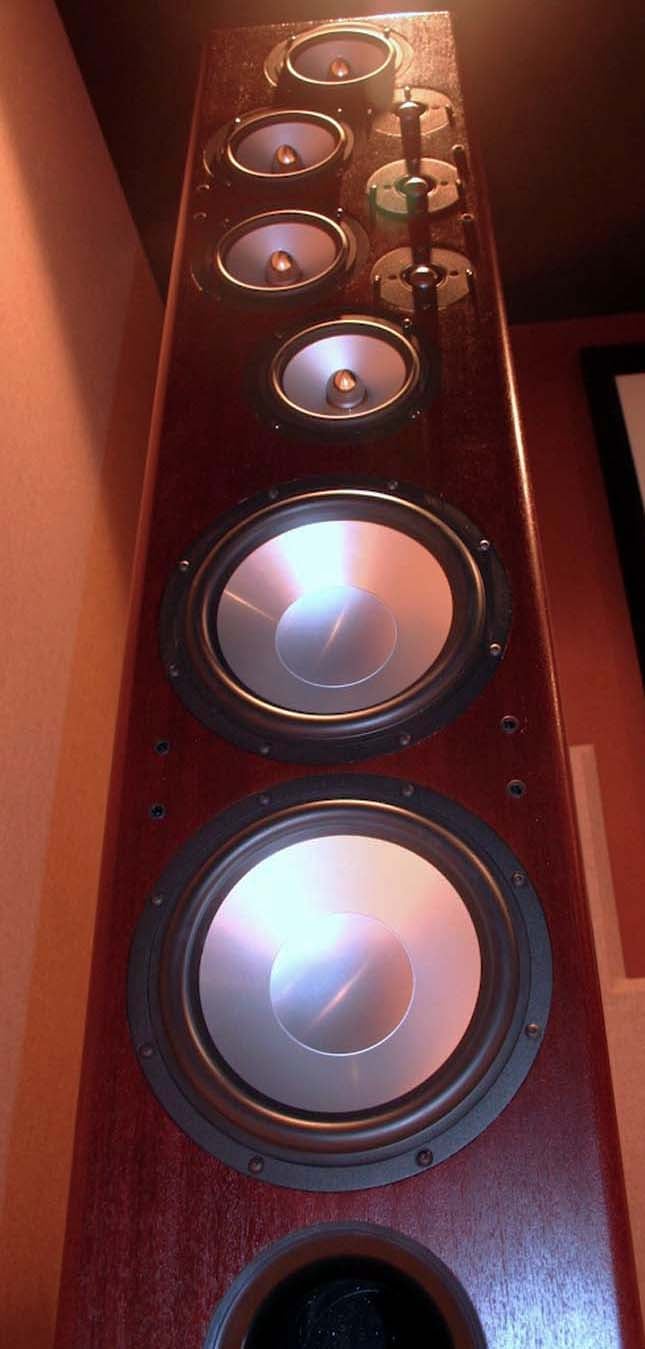
RBH Sound T-30LSE Tower Speaker
There comes a time in life where self indulgence becomes a calling, much like a wolf is drawn to howl at the moon. Some face a mid life crisis by splurging on an exotic sports car in an effort to redefine their youth. Well I haven’t hit middle age yet, but I definitely feel my calling to self indulgence would include dumping some coin on a truly state-of-the-art speaker system.
RBH Sound is no stranger to Audioholics. In fact they are “speaker of the house” for many of our senior staff reviewers, including me. There is a reason to this madness – it’s called performance. As audioholics, we are always seeking to push the envelope of performance without breaking the bank. In this category, RBH Sound has been a shining example of what a loudspeaker company NOT driven by marketing and litigation can produce for true audiophiles.
First Impressions
When the freight truck showed up to the Audioholics Showcase home I knew I was in for some heavy lifting. What I didn’t expect was the truck driver to forget the lift gate, causing me to carry each 300lbs+ speaker (speaker packed in crates) off the truck. Luckily my neighbor, who just returned from service in Iraq, helped me carry these mammoths up my flight of steps into the primary listening room.
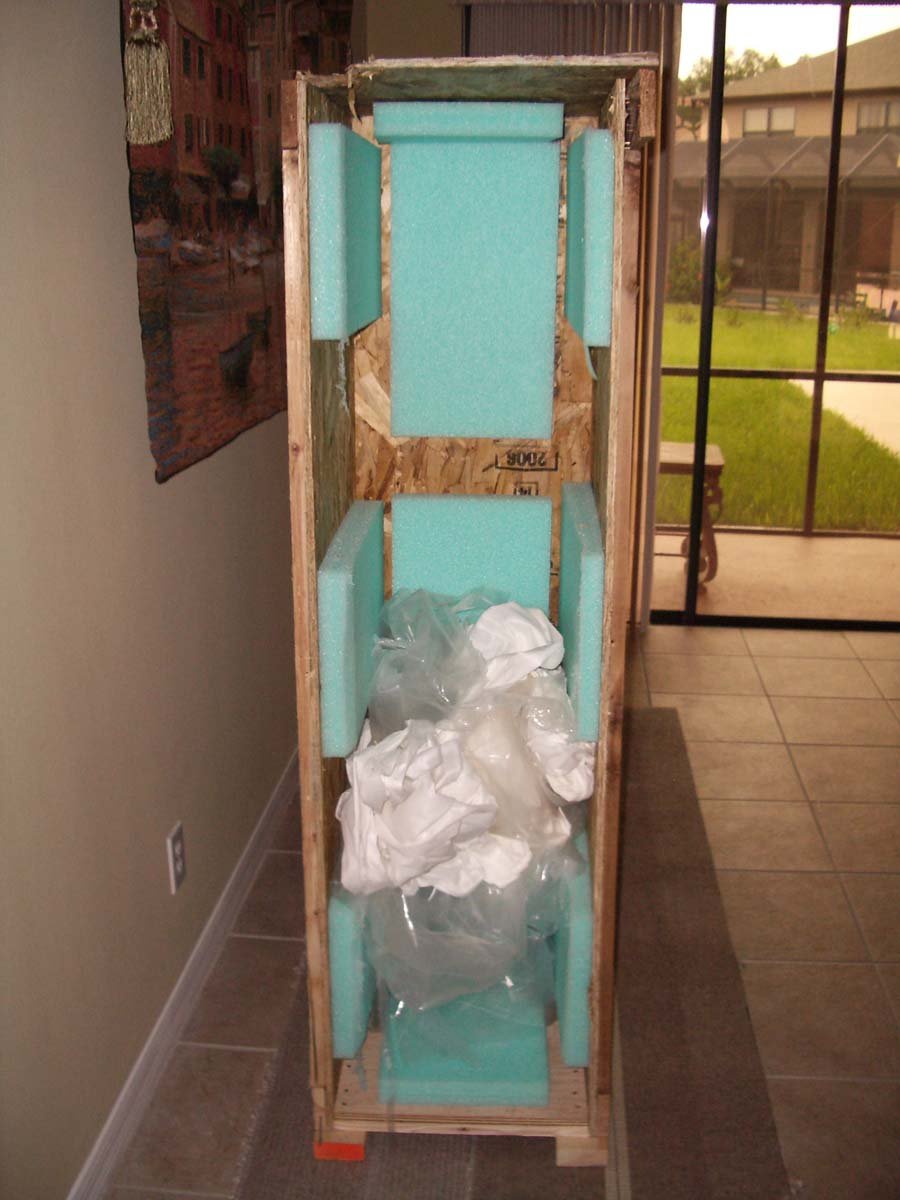
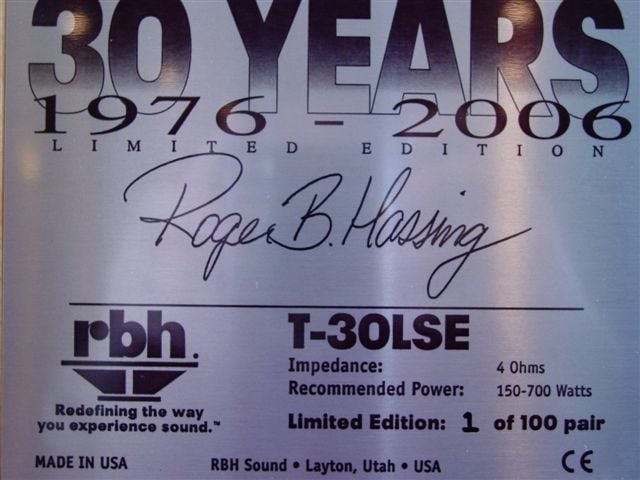
RBH T30-LSE Crate (left pic) ; 30 Year Rear Panel Plaque (right image)
Standing at just over 5ft tall these speakers don’t exactly blend into a room, or carry a particularly high WAF factor. I would say they are designed for the serious audiophile who decisively creates a room specifically for sound… or is a bachelor… or both. Don’t try to convince the wife these speakers would look great next to the armoire – they won’t.
Similar in size and shape to the venerable T2-P system that we previously reviewed, the T-30LSE system takes performance to the next step by integrating everything into a single-cabinet design. There are pros and cons to this approach, which we will get to later in this review, but they look stunning as a single box.
RBH Sound is only running 100 “Limited Edition” matched pairs of this product. Since their preview at CEDIA speakers have been shipping to customers and reviewers alike. I was honored to receive the pre-production first run pair with RBH’s owner Roger Hassing’s personal signature stamped on the back. Each production pair also gets the “Special 30 year Anniversary” plaque and comes in numbered pairs.
RBH T-30LSE Build Quality
RBH Aluminum Bass Drivers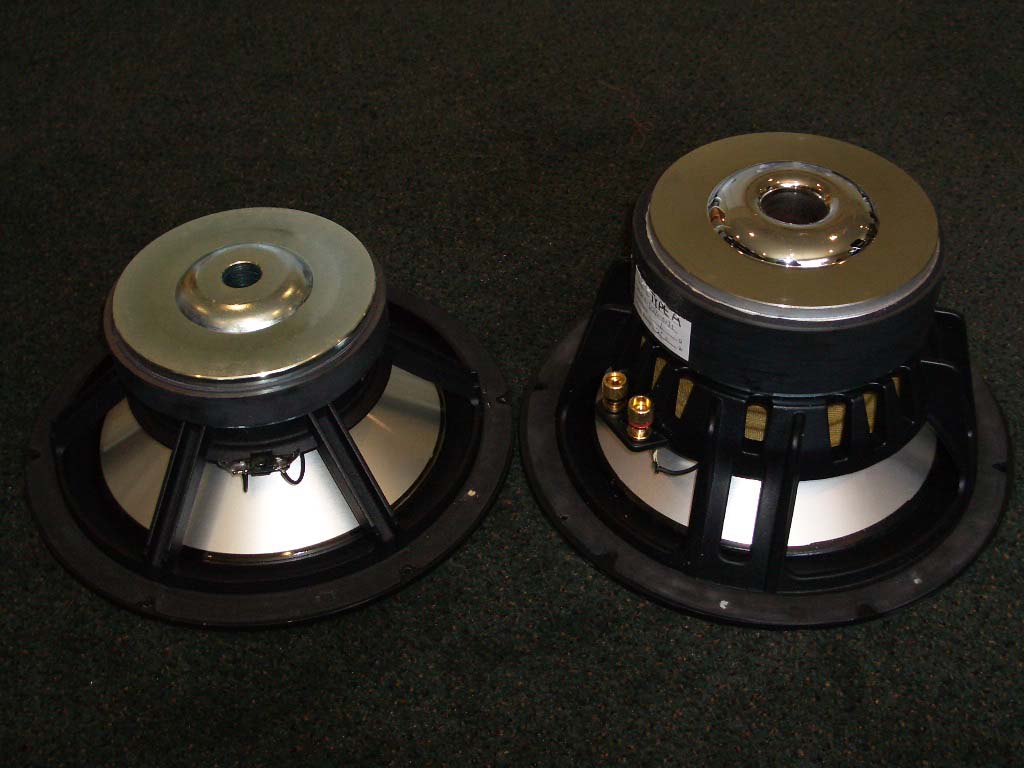 There are several
good reasons why RBH aluminum midrange and bass drivers excel in
performance. These include careful
engineering and quality control.
Granted, many manufacturers use aluminum drivers these days, but all are
NOT created equal. Without the proper
damping (both in the cone and the surround), cone shape, motor structure, and
tight manufacturing tolerances, these types of drivers can be worse than
conventional paper cones.
There are several
good reasons why RBH aluminum midrange and bass drivers excel in
performance. These include careful
engineering and quality control.
Granted, many manufacturers use aluminum drivers these days, but all are
NOT created equal. Without the proper
damping (both in the cone and the surround), cone shape, motor structure, and
tight manufacturing tolerances, these types of drivers can be worse than
conventional paper cones.
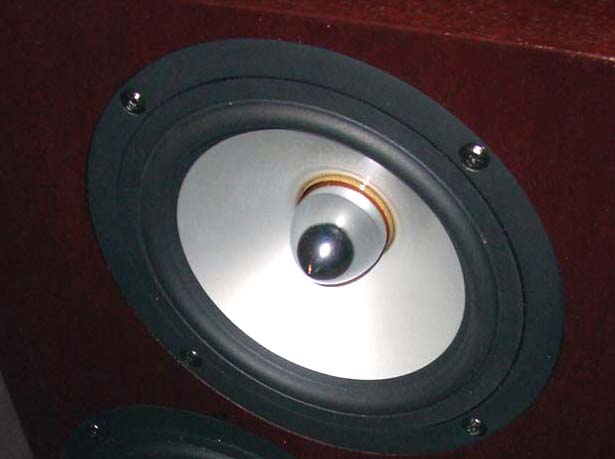
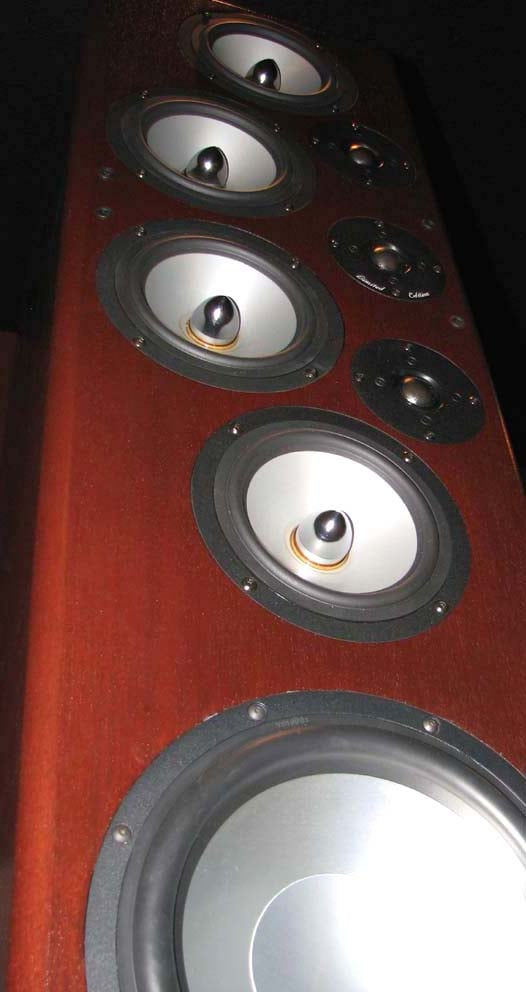
In order for the new T-30LSE system to significantly improve upon dynamic range and bass extension, RBH decided to employee a much higher excursion sub driver than is found in the original T-2P and 1010-SEP subwoofer products. Though the surface of the driver looks similar to its predecessor, (as you can see in the picture) its motor structure (right driver) is much improved upon. As a result the magnet size has been nearly doubled while the voice coil has been beefed up, and the driver’s excursion ability is about twice that of the original driver.
RBH Aluminum Midrange Drivers
 As we learned in
our Signature SE/R review, RBH Sound uses voice coil formers manufactured from
Kapton in both the mid and bass drivers. This greatly increases their ability to handle
heat under the most demanding conditions, which minimizes power compression and
distortion. The aluminum cone material
is coated with a silicon-based material and the surround is made from butyl rubber
to minimize ringing and resonance. This
allows the cone to enter its break up mode at a frequency well above the system
crossover point. These measures undertaken by RBH ensure linear performance
from the drivers, allowing them to operate higher in frequency than most
conventional cone drivers. The result is
a more acoustically seamless blend with the tweeter.
As we learned in
our Signature SE/R review, RBH Sound uses voice coil formers manufactured from
Kapton in both the mid and bass drivers. This greatly increases their ability to handle
heat under the most demanding conditions, which minimizes power compression and
distortion. The aluminum cone material
is coated with a silicon-based material and the surround is made from butyl rubber
to minimize ringing and resonance. This
allows the cone to enter its break up mode at a frequency well above the system
crossover point. These measures undertaken by RBH ensure linear performance
from the drivers, allowing them to operate higher in frequency than most
conventional cone drivers. The result is
a more acoustically seamless blend with the tweeter.
All four of the mid drivers in the T-30LSE system were upgraded to the Status Acoustics phase plug version of the Signature 6.5” driver. The phase plug eliminates the need for a dust cap which in turn reduces cone mass, permitting extended frequency response. This also results in more airflow through the motor structure, which improves cooling and increases power handling. A phase plug also helps to reduce on-axis beaming by dispersing higher frequencies the cone is producing.
Editorial Note on Phase Plugs
Beware, many loudspeaker manufacturers use a quasi phase plug which looks like a phase plug for marketing purposes but does not physically separate from the cone of the driver. These "so called" phase plugs can do more harm than good as they provide an inconsistent surface area. They increase the mass of the cone, yielding poorer frequency response and linearity.
RBH Tweeters (ScanSpeak)
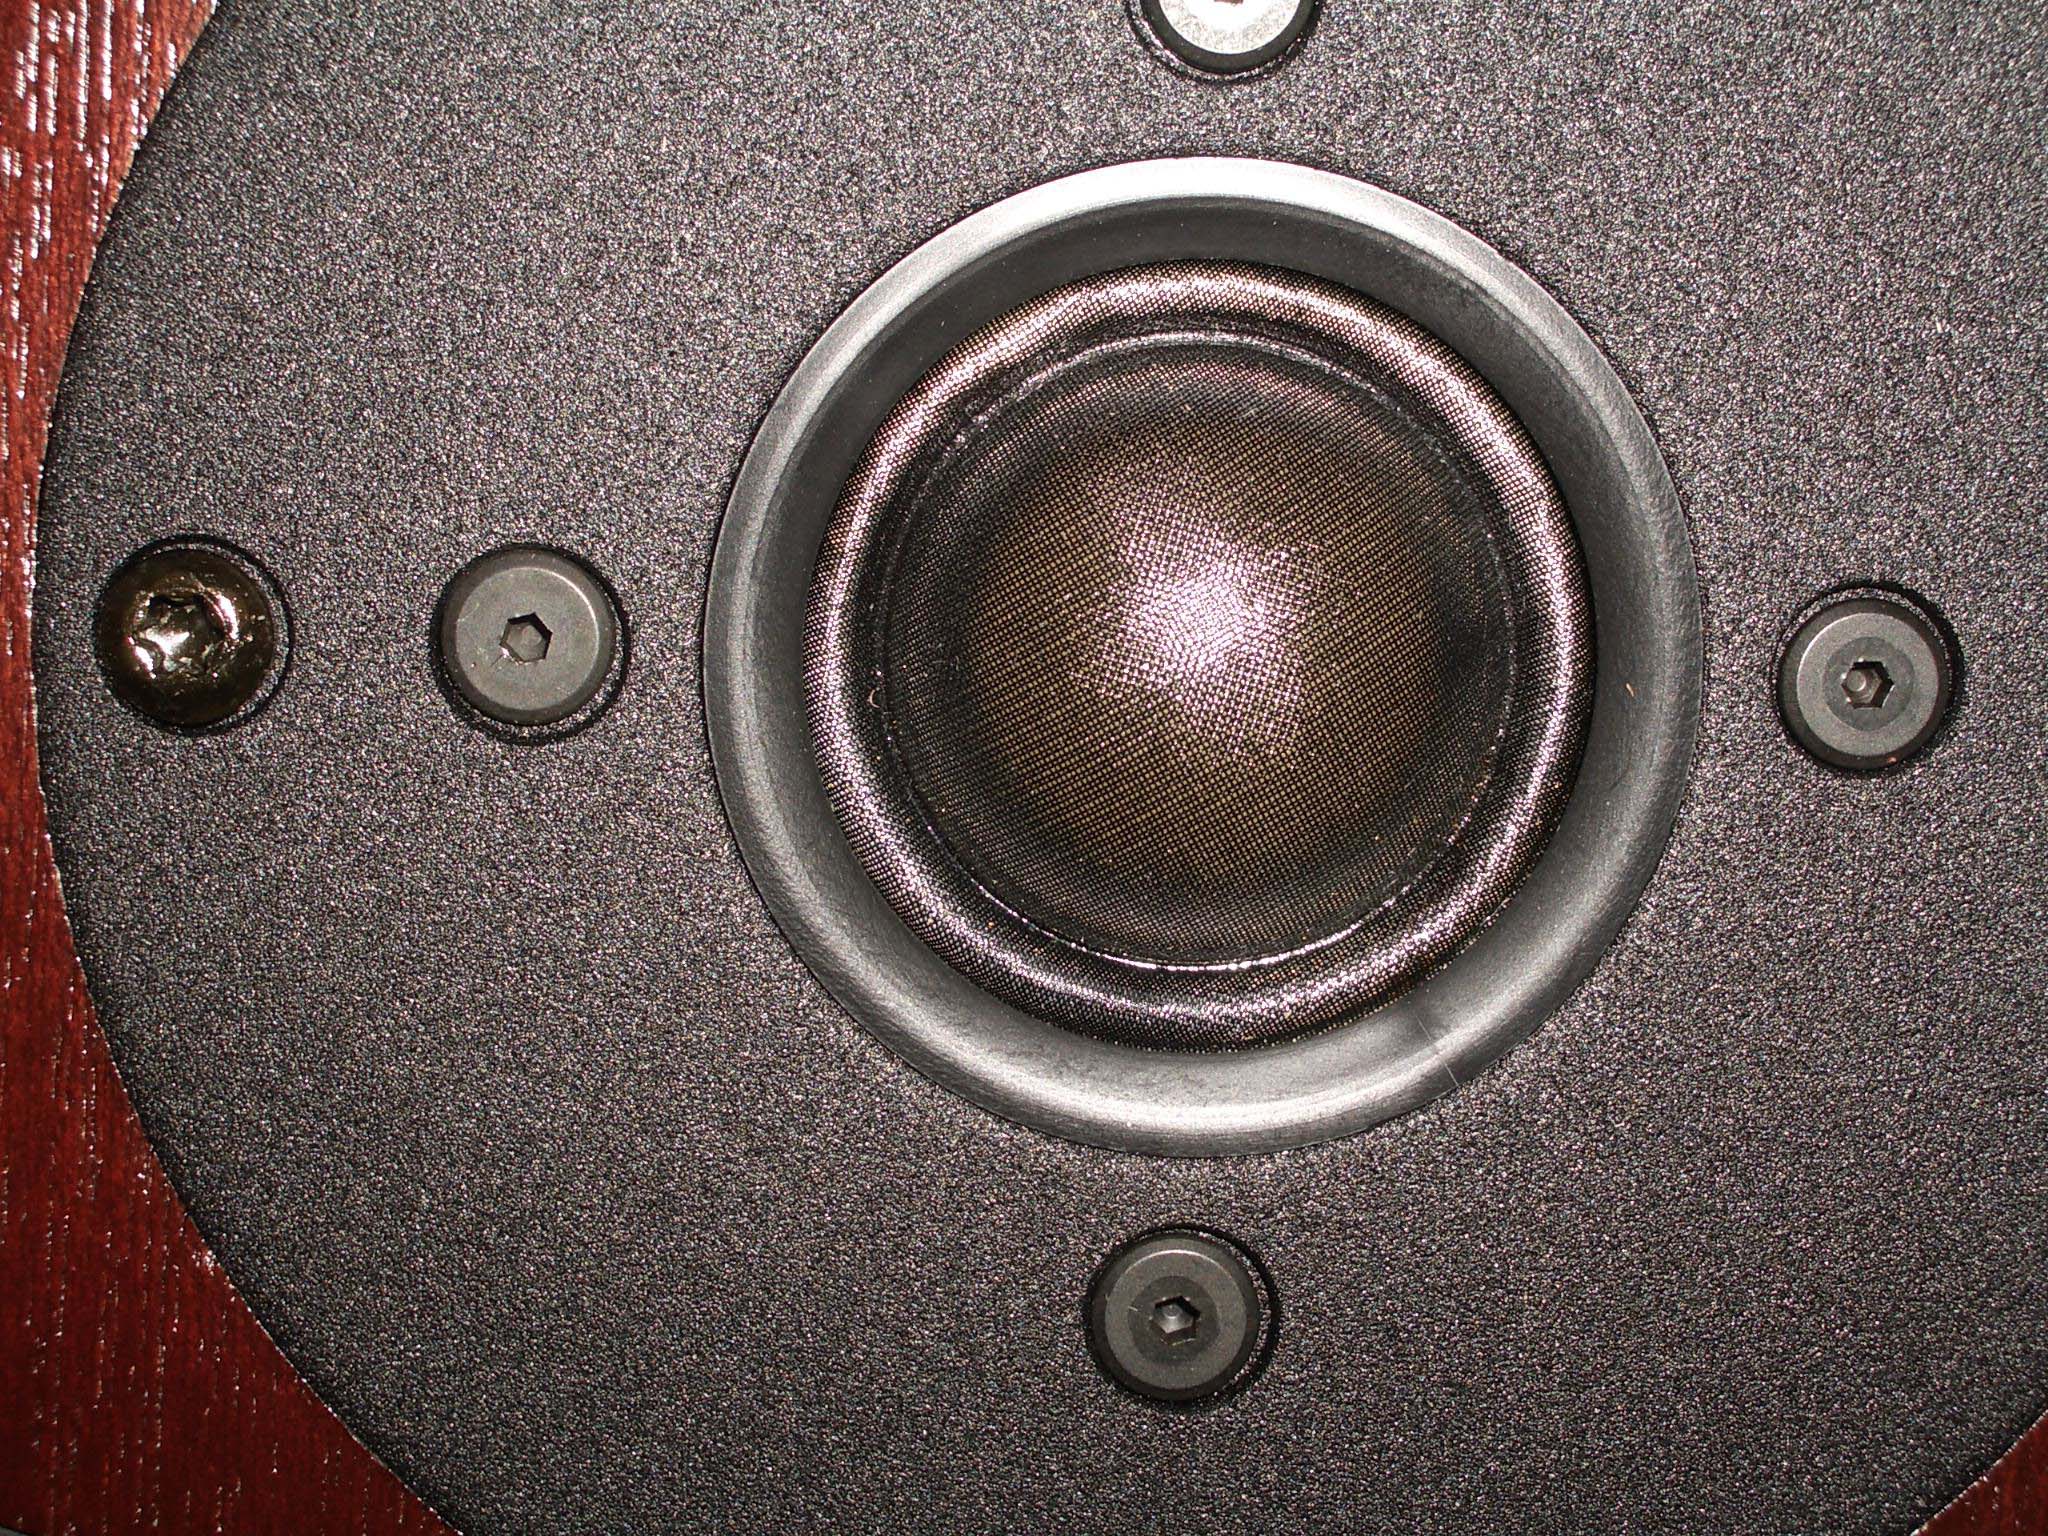 While the
standard tweeter RBH uses in their Signature product (Vifa D27 series) is no
slouch, I simply love the ScanSpeak upgrade. The tweeter employed in the
T-30LSE system is a 4 ohm version of the venerable ScanSpeak 9500 tweeter
(which is arguably one of the best tweeters ScanSpeak has ever made). This tweeter has higher power handling,
lower resonant frequency (550Hz as opposed to the 1kHz of the Vifa), and better
off axis response. This yields a
smoother, more open and airy sound quality with less compression. Because of a longer rear chamber the ScanSpeak
driver can play much lower than pretty much any 1” dome tweeter on the
market. This takes the stress of producing
frequencies out if its most efficient range off the midrange drivers.
While the
standard tweeter RBH uses in their Signature product (Vifa D27 series) is no
slouch, I simply love the ScanSpeak upgrade. The tweeter employed in the
T-30LSE system is a 4 ohm version of the venerable ScanSpeak 9500 tweeter
(which is arguably one of the best tweeters ScanSpeak has ever made). This tweeter has higher power handling,
lower resonant frequency (550Hz as opposed to the 1kHz of the Vifa), and better
off axis response. This yields a
smoother, more open and airy sound quality with less compression. Because of a longer rear chamber the ScanSpeak
driver can play much lower than pretty much any 1” dome tweeter on the
market. This takes the stress of producing
frequencies out if its most efficient range off the midrange drivers.
The disadvantage of this tweeter is a slight reduction in efficiency and on axis high frequency response. The loudspeaker designer must reduce the overall system efficiency to compensate, causing a need for more power to achieve similar playback volume when compared to the more efficient Vifa design. Is it worth it? Yes, if you have a discerning ear, quality electronics, good room acoustics and a slightly fatter wallet. The ScanSpeak driver is nearly 4x the cost of the Vifa, one of the reasons for the moderate price differential between Signature and Signature SE/R upgraded loudspeakers. Since the T-30LSE system employs three of these drivers, system efficiency (or lack there of) becomes a moot point.
High Quality Crossovers
RBH Sound uses nothing but the best inductors, high tolerance resistors and film caps in their crossovers. Their crossovers are designed to ensure optimal performance of each driver within its audible bandwidth, guaranteeing proper phase and frequency response of the speaker system. All of the cables are 12AWG twisted pair to minimize signal loss and reduce crosstalk. The inductors are spaced apart to minimize coupling as per our Inductor Crosstalk Basics article.
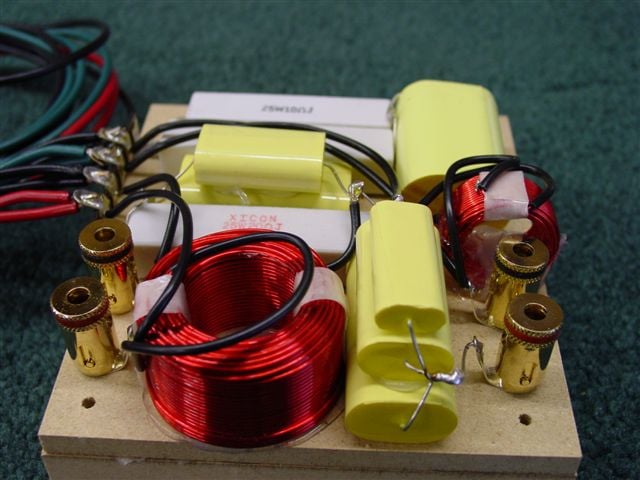
RBH T-30LSE Crossover
Editorial Note on Capacitors
Beware, many loudspeaker companies use cheap electrolytic capacitors in series with their mid and tweeter drivers. Electrolytic capacitors are not very linear at high frequencies and thus should not be used in series for these crossover sections.
The Cabinets
The RBH cabinets are constructed of 3/4-inch HDF (high density fiber-board) which is denser and more costly than the standard MDF found in most speaker cabinets. It’s a single cabinet design with a sealed off chamber for the mid woofer / tweeter array. As can be seen in the picture, the cabinet is well braced with baffling and damped with Dacron insulation. It is also lined with high density absorption materials for the bass portion of the enclosure. The drivers and crossovers are all wired with quality 12AWG cabling.
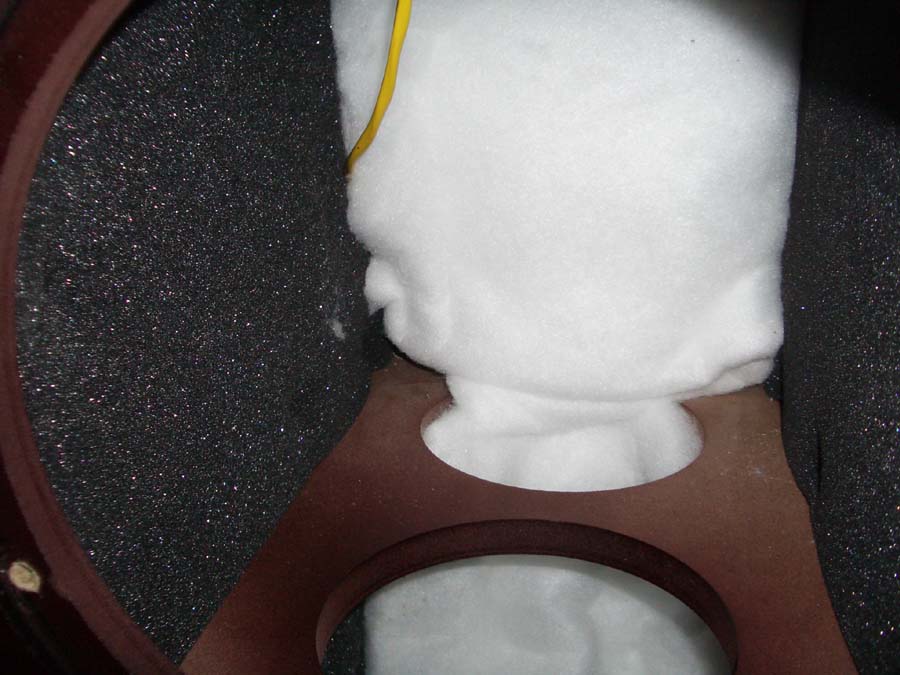
RBH T-30LSE Cabinet - Inside View
As with all the RBH speakers we’ve reviewed, the cabinet has a very solid feel to it and makes a nice thud sound when tapped on with your knuckles. We have never had issues with RBH build quality and this product is a shining example of their no-compromise engineering and commitment to make the best constructed product within its price class.
Design Overview
 Just
over four years ago RBH Sound unveiled a rather unique speaker system at
CES known as the Signature
T-2P System. This system won our 2004 CES
Best of Show award and became our reference speaker shortly
thereafter. RBH Sound referred to the
driver topology in the T-2P system a “truncated line array”. This system shared many of the virtues of a
classic line array speaker, such as unparalleled dynamic range and seemingly
infinite soundstage – characteristics responsible for producing the very
lifelike sound for which these products are known. One area where the T-2P system defined itself
was in its ability to provide a competently focused soundstage and excellent
imaging characteristics, strengths that are NOT common in many large line array
type speakers, especially those with wide front baffles like the T-2P system. The result was that this system quickly
became the Audioholics reference speaker.
Life was good, our Audioholic appetite was fulfilled….. until now.
Just
over four years ago RBH Sound unveiled a rather unique speaker system at
CES known as the Signature
T-2P System. This system won our 2004 CES
Best of Show award and became our reference speaker shortly
thereafter. RBH Sound referred to the
driver topology in the T-2P system a “truncated line array”. This system shared many of the virtues of a
classic line array speaker, such as unparalleled dynamic range and seemingly
infinite soundstage – characteristics responsible for producing the very
lifelike sound for which these products are known. One area where the T-2P system defined itself
was in its ability to provide a competently focused soundstage and excellent
imaging characteristics, strengths that are NOT common in many large line array
type speakers, especially those with wide front baffles like the T-2P system. The result was that this system quickly
became the Audioholics reference speaker.
Life was good, our Audioholic appetite was fulfilled….. until now.
RBH Sound has never been a company to rest on its laurels. Just as they’ve demonstrated in the past, it was time for them to take a successful existing speaker system and improve upon its design by employing driver and electronics technologies from their ultra high-end Status Acoustics division. Thus the Signature T-30LSE was born.
Visually the T-2P and T-30LSE appear to be very similar loudspeaker systems. Both of these systems employ a similar truncated line array driver alignment. While their driver alignments (the placement of the drivers on the front baffle) are essentially the same, this is where the similarities end.
Editorial Note on Truncated Line Arrays
A truncated line array is simply a shortened version of a traditional line array. A line array is defined as a group of omnidirectional radiating elements arrayed in a straight line. The physical size of the line array is large in relation to the wavelengths of the frequencies being produced. While the driver array of the T-30LSE is truncated (shortened), RBH prefers to refer to the alignment as a "dispersion averaging array". The array of drivers is aligned so the combination of the dispersion properties of the individual elements in the array produces a uniform average of the constructive and destructive interference between the elements.
The T-30LSE incorporates a number of design improvements which elevate the level of performance compared to the T-2P. The T-30LSE employs the same driver topology as the T-2P system but, as previously mentioned, all drivers have been upgraded to their high end Status Acoustics versions for extended dynamic range and reduced distortion.
The most noticeable aesthetic difference between the T-2P and the T-30LSE is the latter uses a single cabinet design versus the two-piece modular design of the T-2. The one-piece cabinet design of the T-30LSE allows the dual 10” subwoofers to utilize the previously unused volume of air behind the mid/woofers and tweeters. With almost 50% more subwoofer cabinet volume than the T-2P, the T-30LSE’s bass extension is deeper (flat to 18Hz) and the overall bass alignment of the system is better damped (tighter sounding). In fact, because the new woofers have such a low resonance frequency, RBH was able to employ a 6th order tuning with fc around 18Hz while keeping the frequency response between 20 to 40Hz slightly shelved down. This makes the system compatible with most rooms and allows the installer to place the speakers closer to a back wall. The other factors which contributed to improved bass performance include a larger 4” dimpled port, designed for improved air flow, and a new extended-excursion 10-inch subwoofer (found in the new $50k/pair Status Acoustics Titus prototype speaker system).
The crossover system (brains of the speaker) for the T-30LSE has also been redesigned to allow the crossover point between the mid/woofer and tweeter for the T30LSE to be set at 2000 Hz versus 2500 Hz on the T-2P. There are no crossover components used to high-pass filter the mid/woofers or low-pass filter the subwoofers. The transition between the subwoofer and mid/woofer drivers is optimized using the natural acoustic roll-off of the drivers.
The other notable difference between the nomenclatures of the two systems, is the T-2P (“P” designating Powered) is sold as a package with the SA-400 amplifier which is used to power the subwoofer portion of the speaker. The SA-400 amplifier can be used with the T-30LSE but is sold separately.
RBH T-30LSE Set-Up
Moving around nearly 200lbs of 5-foot tall speaker isn’t exactly child’s play. I suggest NOT inserting the spikes or any accessory feet until you know exactly where you want them placed. Speaker placement depends a lot on room dynamics and listening preferences. If you want a speaker to have pinpoint imaging you typically place the speakers closer together. If you prefer a larger soundstage with broader imaging across the whole listening area spreading the speakers further apart usually does the trick. Since my goal with home theater is to try to make every seat a good seat I chose the latter with a slight toe in. Though these speakers normally require little or no toe-in because the tweeter array is located on the inside edge of the baffle, I found in my room a slight toe-in did help increase midrange focus and overall improved imaging. I have found, in acoustically treated rooms such as mine, that you typically need a slightly higher degree of speaker toe-in than would normally be required in untreated rooms. Experimentation is always recommended in this regard.
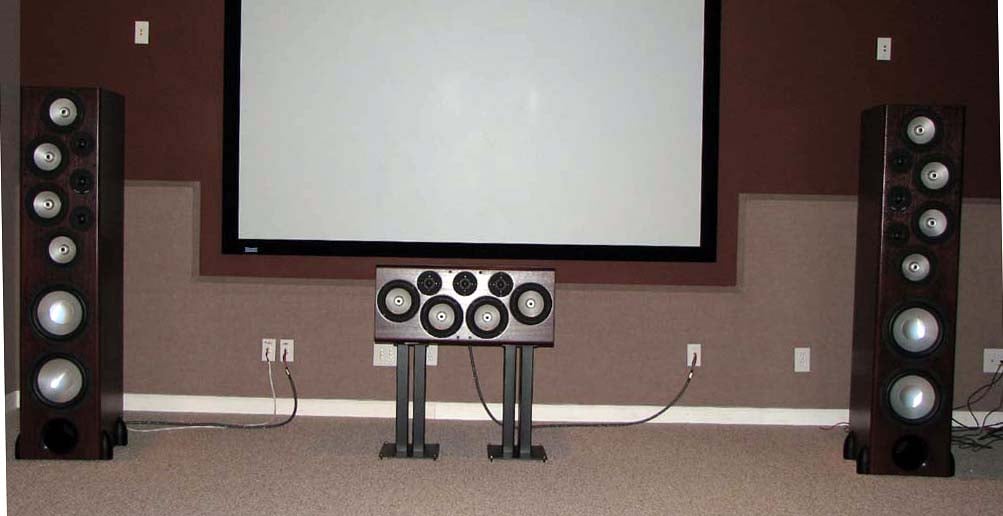
RBH T-30LSE System Pic
I personally don’t subscribe to the “Golden Triangle rule” that dictates the speakers should be placed equidistantly apart from the diagonal distance of each speaker to the listening area. I find this usually positions the speakers too far apart, requiring drastic toe in which can cause the speakers to sound overly bright or can greatly compromise the imaging. It’s always a good idea to check with the manufacturer for speaker setup recommendations as a starting point.
After consulting with Shane Rich, Technical Director of RBH Sound, I was informed that because of the broad dispersion capability of the T-30LSE system the speakers can be placed a little further apart than a typical speaker system. For instance, if you place the speakers 10 feet apart you want the primary listening position to be about 11 feet from the plane of the speakers (not the diagonal distance of each speaker to the listening area). Of course the room will somewhat dictate what the optimal distance between the speakers will be. A good balance between the speaker’s proximity to the side walls of the listening room and the distance to the listening position should be maintained if possible. The bottom line is this - if you spend some time setting these speakers up they can disappear into the soundstage much the same way a smaller speaker will.
When I placed the speakers too closely together the imaging became pin-point at the center of the first row, but was a bit lacking and just didn’t come together well in the back row. If I placed them too far apart the soundstage lacked focus in the front row and sounded too broad in the back row. Applying too much toe-in made the speakers too lively. I found the best positioning for each speaker to be 4feet from the back wall and about 1 ½-feet from the left side wall for the left speaker. The speakers are about 12-feet apart, and the first row of seating is 15-feet from the plane of the speakers with about ½ “ of toe-in for each speaker. I used a laser pointer to help me guide the degree of toe-in for great precision. I settled on the point where each speaker’s tweeter baffle shined a point just on the outer edge of its respected seat in the back row. This allowed for a well focused and immensely large soundstage for both rows of seating.
After you have achieved the proper speaker placement for optimized sound in your seating area it’s time to apply the floor spikes or outriggers to better couple them to the flooring and increase bass impact and detail. I used the supplied spikes from RBH, which do the job nicely. If you have hardwood flooring I’d suggest inserting a coin below each spike to avoid damaging the floor’s finish. Remember from basic physics that Pressure = Force / Area, thus each spike presents about 500 psi to the flooring, which will easily puncture and ruin any hardwood flooring.
I listened to this speaker in various configurations including:
- Full range towers single amped and bi-amped
- Top portion of towers run full range with bass sections powered and connected via LFE channel along with 2 Velodyne DD-15’s with bass equalized via Audyssey Pro MultEQ processor.
Most of my critical two-channel listening tests were conducted with the T-30LSE as a full range tower, which I suspect would be the typical installation. My multi channel listening tests were conducted via the bass portions of the T-30LSE system and 2 Velodyne subs connected in mono via the LFE channel and EQ’ed with Audyssey. I used various amplifiers to power these speakers including the internal amps of my Denon AVR-5805 receiver (which also served as the processor), the Thule PA-350B 5CH amplifier, the Panasonic SA-XR50 digital receiver and the Marantz PM-11S1 integrated amplifier. The Denon DVD-5910CI was used as the source component and all cables were furnished by Bluejeans Cable, Impact Acoustics and DVI Gear.
When choosing the other speakers of a multi channel system one must be careful to pick tonally matched products (particularly for the center channel) while also choosing speakers that can dynamically keep up with the main speakers. Luckily RBH offers a matching center channel (T-1 SE/R) which has the identical driver topology of the T-30LSE system without the bass drivers. Please note the center channel speaker is about 4-5dB more efficient than the T-30LSE’s, since the latter designs mid/tweeter array is purposely padded down to match the sensitivity of the bass drivers. This can easily be compensated during the calibration of your processor. For side channels, I chose the 66-SE/R dipole/bipole speakers. For the back channels, I selected SI-740/R in-wall speakers, but later wished I would have opted for the SI-760/R for greater dynamic range capabilities. Luckily my processor has extremely comprehensive bass management and allowed me to cross over my back channels at a higher frequency than the other speakers to take the strain of bass duties off of the single 6 ½” driver. I rounded the system off with the addition of two Velodyne DD-15 servo controlled subwoofers and the Audyssey MultEQ Pro processor to handle bass correction for all of the subwoofers. While the T-30LSE system was more than capable of filling my room with high SPL extended bass response, due to the asymmetrical layout of my theater room I found it necessary to add the two Velodyne subs for better room modal and nodal control throughout the entire seating area. I placed the Velodyne subs relatively close to the listening area, which helped to pressurize that area and provide uniform bass response for every seat. The Audyssey eliminated major room modes and significantly smoothed out broad room nodes across the whole seated area.
Two Channel Playback
Part of the reason it has taken me so long to publish this review was I found it most difficult to take the time to put down on paper what my ears were enjoying so much. I started it out with some of the highest quality source material I own to shine the best light possible on these speakers.
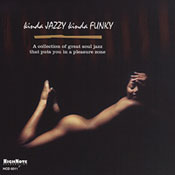
SACD: kinda JAZZY kinda FUNKY
 kinda
JAZZY kinda FUNKY from HighNote Records (available at www.jazzdepot.com) is a groovy compilation of jazz that you just
don’t get exposed to on the jazziac FM radio stations and rarely have the
opportunity to hear live (at least in my neck of the woods). As with many Jazz SACD’s, this one has very
little compression and is capable of making a system shine if it’s up for the
challenge. The jazz organ was reproduced with amazing clarity and fluidity on
track #7, “Peach Cobbler,” by Bill Heid.
The trumpet solos were so vibrant and real I felt like I was at the Old
Jazz Cellar, a club I used to visit in Ybor
City
back in my college days. All that was
missing during this listening session was a pint of my favorite brew! On the T-30LSE system brass instruments
were reproduced with a genuinely lifelike soundstage usually only heard in live
unamplifier performances. This is one
of the many reasons why I prefer a line array type speaker system to a
conventional 2 or 3-way vertically aligned driver topology. When the bassist hit the low notes it sent a
chill down my spine, especially when I sat in the back row which is on a raised
platform that is designed to resonate for increased tactile response.
kinda
JAZZY kinda FUNKY from HighNote Records (available at www.jazzdepot.com) is a groovy compilation of jazz that you just
don’t get exposed to on the jazziac FM radio stations and rarely have the
opportunity to hear live (at least in my neck of the woods). As with many Jazz SACD’s, this one has very
little compression and is capable of making a system shine if it’s up for the
challenge. The jazz organ was reproduced with amazing clarity and fluidity on
track #7, “Peach Cobbler,” by Bill Heid.
The trumpet solos were so vibrant and real I felt like I was at the Old
Jazz Cellar, a club I used to visit in Ybor
City
back in my college days. All that was
missing during this listening session was a pint of my favorite brew! On the T-30LSE system brass instruments
were reproduced with a genuinely lifelike soundstage usually only heard in live
unamplifier performances. This is one
of the many reasons why I prefer a line array type speaker system to a
conventional 2 or 3-way vertically aligned driver topology. When the bassist hit the low notes it sent a
chill down my spine, especially when I sat in the back row which is on a raised
platform that is designed to resonate for increased tactile response.
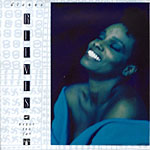
CD: Dianne Reeves Never Too Far
 For fun, I decided to run my RBH T30-LSE system entirely off the Thule PA350B
in 2CH bridged mode, thus bypassing the Earthquake amps that were powering the
subwoofer portions of my speakers. I
couldn’t think of a better torture test for two channel listening than using
the Dianne Reeves Never too Far CD.
For fun, I decided to run my RBH T30-LSE system entirely off the Thule PA350B
in 2CH bridged mode, thus bypassing the Earthquake amps that were powering the
subwoofer portions of my speakers. I
couldn’t think of a better torture test for two channel listening than using
the Dianne Reeves Never too Far CD.
Dianne Reeves’ Never Too Far Track#1 “Hello (Haven’t Seen You Before)” bass line is quick and sustained. It tests the transient response of speaker system. With the Thule PA350B running my main speakers full range the bass was incredibly tight and well pronounced despite the fact I shut off my additional two Velodyne subwoofers, which were strategically placed in the room to provide more uniform bass in the listening area. I was a little unsure at first if the PA350B would be up for running these speakers full range since the internal subwoofers in the system don’t have a crossover network and the speaker system dips down below 3 ohms at certain frequencies. The T-30LSE’s were designed to roll off based on the natural acoustical slopes of the drivers. As a result, they have stellar transient response but also represent a difficult load to wimpy amps since they are highly inductive. The PA350B had no qualms about accepting this challenge and effortlessly drove these speakers with ample and well-controlled bass and nuclear highs. I then switched over to the internal amps of my Denon AVR-5805 and had a very similar experience. I was really expecting these speakers to present a problem, but it was smooth sailing for the Denon amps. Connected to the T-30LSE system they happily pounded away and filled my nearly 6,000 ft^3 listening room with excellent fidelity. The only amp I had on hand that really produced sonically challenged results was the digital Panasonic SA-XR50 receiver. Because of its high noise floor and high output impedance much of the sonic virtue of these speakers was lost and the bass sounded sloppy. I don’t suggest pairing these speakers with such incompetently designed amplification.
In track #2, “Never too Far”, the chorus sounded like it emanated from the side channels. If I hadn’t confirmed my processor was set to 2CH I’d think I was listening in PLIIx Music Mode. The stereo separation was excellent and I was rewarded with a naturally LARGE soundstage. The soundstage seemed to extend well beyond the plane of the loudspeakers avoiding that “boxed” in effect I often find on lesser systems.
Track #3 “Come In’ literally shook the floor of my reference room. Plenty of power taxing bass was present, while at the same time excellent vocal clarity and non sibilant highs were consistently reproduced. In my opinion the bass sounded the tightest, though not necessarily the deepest, on these speakers when paired with the Marantz PM-11S1 integrated amplifier we had in the labs under review.
On track # 4 “How Long”, I couldn’t help but to really crank it, particularly during the percussion part and vocal chanting. The drums exploded on scene and the vocals filled the front of the room and extended several feet behind and to the sides of the speakers. It wasn’t until I flipped on my SPL meter that I realized I was listening at greater than 95dB C-wt sustained levels. I usually suffer listening fatigue during extended loud listening sessions, but the T-30LSE’s smooth and effortless playing made for a very palatable listening experience at any listening level.
CD: James Taylor That’s Why I’m Here
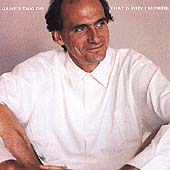 While I am not a HUGE James Taylor fan, he does have some of
the finest sounding recordings I have heard via the CD format. In fact, I used the title track “That’s Why I’m
Here” as a test to ensure I had my speakers properly placed. You will know when this is achieved by
hearing his voice emanate directly from a mid point between the two main
speakers, assuming your speakers image well.
Once the T-30LSE’s were properly setup the voice seemed to come directly
from the center channel. I enjoyed doing
a demo for people using this song and later telling them they were listening to
only the two main speakers. I had
several people actually walk up to the center channel to convince themselves it
was turned off.
While I am not a HUGE James Taylor fan, he does have some of
the finest sounding recordings I have heard via the CD format. In fact, I used the title track “That’s Why I’m
Here” as a test to ensure I had my speakers properly placed. You will know when this is achieved by
hearing his voice emanate directly from a mid point between the two main
speakers, assuming your speakers image well.
Once the T-30LSE’s were properly setup the voice seemed to come directly
from the center channel. I enjoyed doing
a demo for people using this song and later telling them they were listening to
only the two main speakers. I had
several people actually walk up to the center channel to convince themselves it
was turned off.
CD: Roger Powell Fossil Poets
 Roger Powell Fossil
Poets is a retro futuristic recording with progressive rock driven keyboard
influence that sounds like a cross between Joe Satriani and Depeche Mode. Tracks #2 and 3; “Fallout Shelter” and
“Delayed Reaction” respectively, really belt out the deep low-end bass typical
of keyboard recordings. If you really
want to impress people with your system’s bass response this is a “must have” recording. I loved the tight, well-focused bass the
T-30LSE’s were able to muster. The RBH
system had no problems with abuse of the volume control during these
songs. Instead of hearing loss of
composure or distortion from the subs, I was rewarded with tight, chest-pounding
bass that never sounded boomy or lost pitch.
It was a striking example of how good a properly tuned subwoofer system can
sound when the drivers are up to the excursion challenge and you apply enough
amplifier power. I had to keep
reminding myself I was hearing this type of bass from just a pair of 10”
drivers in each speaker enclosure. The
bass sections in these speakers could easily convince you that you are
listening to dual 12’s or 15’s. For the
record, a pair of 10-inch drivers has about the same surface area as a singe
14-inch driver.
Roger Powell Fossil
Poets is a retro futuristic recording with progressive rock driven keyboard
influence that sounds like a cross between Joe Satriani and Depeche Mode. Tracks #2 and 3; “Fallout Shelter” and
“Delayed Reaction” respectively, really belt out the deep low-end bass typical
of keyboard recordings. If you really
want to impress people with your system’s bass response this is a “must have” recording. I loved the tight, well-focused bass the
T-30LSE’s were able to muster. The RBH
system had no problems with abuse of the volume control during these
songs. Instead of hearing loss of
composure or distortion from the subs, I was rewarded with tight, chest-pounding
bass that never sounded boomy or lost pitch.
It was a striking example of how good a properly tuned subwoofer system can
sound when the drivers are up to the excursion challenge and you apply enough
amplifier power. I had to keep
reminding myself I was hearing this type of bass from just a pair of 10”
drivers in each speaker enclosure. The
bass sections in these speakers could easily convince you that you are
listening to dual 12’s or 15’s. For the
record, a pair of 10-inch drivers has about the same surface area as a singe
14-inch driver.
In all of the time I spent listening to these speakers in a two-channel environment they never ceased to amaze me! They are delicate and capable of extracting the subtle nuances of a recording, while at the same time being able to effortlessly produce large dynamic range free of strain and compression. To sweeten their sound I eventually applied Audyssey equalization. The Audyssey system had very little work to do. In fact, when Chris Kyriakakis from Audyssey paid me a visit during the initial setup phase of the Audioholics Showcase room, he was most impressed with how linear these speakers were and how little active room correction was needed above 100Hz.
Multi-channel Playback
It was obvious that RBH designed the T-30LSE system to be used as a two-channel solution for uncompromised high-fidelity performance. I was wondering just how well these speakers would integrate into a high performance multi-channel home theater environment. With my system fully calibrated to provide great sound in every seat I was ready to discover the sonic wonders they could reveal to me. With such a large selection of multi-channel music I felt like a kid in a candy store. I selected a couple of my favorites and a late surprise edition I picked up at Target – the Beatles Love DVD-A disc. I had no idea what I was in for with the Beatles disc, but let me just say if you weren’t a fan of the Beatles in the past you will be after hearing this superbly engineered disc. I also chose Jaco Pastorius’ Big Band multi-channel SACD because of its pristine fidelity and excellent musical content. Peter Gabriel’s Secret World Live DVD Video was auditioned because, well Peter Gabriel is a legend and, in my opinion, this is his best concert performance to date. Best of all, this concert is encoded in DTS and has excellent fidelity, though sub-par video performance.
DVD: Peter Gabriel Secret World Live
The RBH T-30LSE system gave me that better than being there experience...
I focused my Peter Gabriel listening session on two songs “In Your Eyes” and “Steam”. These are two songs with which I am intimately familiar, especially the latter since it’s my 6 year old daughter’s favorite. “In Your Eyes”, perhaps one of Peter’s most popular songs to date, was well done on this concert. With the aid of beauty Paula Cole’s excellent backing vocals and Manu Katché’s drumming, this song is taken to new heights. The sense of envelopment the RBH system brought to this song was surreal. I felt as if I was transported into the concert venue and no longer confined into my listening room. Having experienced this concert live, I can tell you that the RBH T-30LSE system gave me that “better than being there experience” that only a truly superb loudspeaker system in an acoustically controlled room could do.
SACD: Jaco Pastorus Big Band
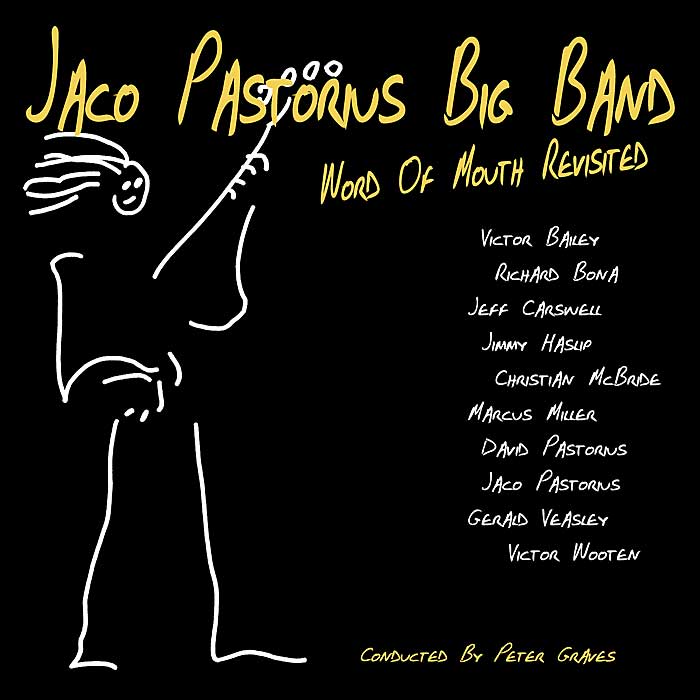 Track #3 “Teen
Town”
from the Jaco Pastorus Big Band SACD
sounded pristine. The brass sections
coming from the front of the room sounded live and “in your face.” I felt as if I was in a small concert jazz
venue. Jaco’s bass playing was clean and
well delineated. I could hear each
individual note played, In fact, it took
some doing to get my dual Velodyne subs to integrate with the RBH since the
latter had such a phenomenal transient response and a very natural decay
signature. I spent most of this listening
session using the RBH T-30LSE as a full range monitor to understand how the
recording should truly sound below 100Hz.
I had to exert great care to not muck this up with the addition of two
subs. My wife thought I was nuts as she
endured nearly three hours of constant bass sweeps while I tuned the system
response, but I reminded her this is what being an audioholic is all about! I never said I was practical, nor non-obsessive
when it comes to extracting the best audio performance from a system.
Track #3 “Teen
Town”
from the Jaco Pastorus Big Band SACD
sounded pristine. The brass sections
coming from the front of the room sounded live and “in your face.” I felt as if I was in a small concert jazz
venue. Jaco’s bass playing was clean and
well delineated. I could hear each
individual note played, In fact, it took
some doing to get my dual Velodyne subs to integrate with the RBH since the
latter had such a phenomenal transient response and a very natural decay
signature. I spent most of this listening
session using the RBH T-30LSE as a full range monitor to understand how the
recording should truly sound below 100Hz.
I had to exert great care to not muck this up with the addition of two
subs. My wife thought I was nuts as she
endured nearly three hours of constant bass sweeps while I tuned the system
response, but I reminded her this is what being an audioholic is all about! I never said I was practical, nor non-obsessive
when it comes to extracting the best audio performance from a system.
The tenor saxophones in “Barbary Coast” were naturally reproduced and the stereo separation was simply astounding. The drums had a great “pop” to them, free of the compression artifacts so typical in most recordings and painfully endured on most playback systems. The T-30LSE system reproduced all of this recording’s entangled dynamics with carefree aplomb. The only benefit of turning on my extra two subs was a more even bass response across all listening seats. The RBH’s proved to have all of the extension and SPL required to fill the room with unsurpassed dynamics.
Although “Continuum” is a slow paced song, it remains one of my favorites on this recording. The reverberation of Jaco’s bass in this song is so seductive that it just makes you want to chill out. It’s rare to hear baratone sax these days, and this recording is a shining example of how melodic one can sound. On the T-30LSE system I was again transported into the event, feeling as if I was dead center and about 10-feet from the sax player in a cozy jazz cellar. This type of magic differentiates a good recording from a bad one and is rarely reproduced with this level of realism on a playback system.
DVD-Audio: The Beatles Love
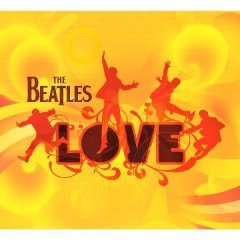 The Beatles Love
DVD-A has become a benchmark multi channel recording for us only moments after
we heard a couple of cuts from it. If
you don’t own this disc, hotlink this review and run out to your local music
retailer and buy it right now! I would
have never imagined the 40+ year old Beatles recordings could sound so
good. “Because” originally on Abbey
Road, was revitalized on
this recording. The true dynamics of
Lennon, McCartney and Harrison were revealed, reminding me there will never be
another band like the Beatles. “Within You Without You/Tomorrow
Never Knows” had a very psychedelic and floaty feel to it. I wasn’t expecting near 20Hz bass extension
in this recording, but it was there for the T-30LSE system to playback without
any contentions. I felt the floor joists
rumble on this track – as did my neighbor while he was out by his pool playing
Texas Holdem! In fact, the sound prompted
him to come over a take a closer listen.
I of course obliged as it was the least I could do for the guy who
helped me carry the T-30LSE’s into my showcase theater room. We listened to “Hear Comes the Sun” (one of Harrison’s best, in my opinion). The guitars were rich and lively and the bass
heavenly. As the song ended my neighbor
commented that the Beatles wouldn’t sound this good if they were physically
playing in my room. He basically came to
my conclusion that we have achieved that “better
than being there” experience.
The Beatles Love
DVD-A has become a benchmark multi channel recording for us only moments after
we heard a couple of cuts from it. If
you don’t own this disc, hotlink this review and run out to your local music
retailer and buy it right now! I would
have never imagined the 40+ year old Beatles recordings could sound so
good. “Because” originally on Abbey
Road, was revitalized on
this recording. The true dynamics of
Lennon, McCartney and Harrison were revealed, reminding me there will never be
another band like the Beatles. “Within You Without You/Tomorrow
Never Knows” had a very psychedelic and floaty feel to it. I wasn’t expecting near 20Hz bass extension
in this recording, but it was there for the T-30LSE system to playback without
any contentions. I felt the floor joists
rumble on this track – as did my neighbor while he was out by his pool playing
Texas Holdem! In fact, the sound prompted
him to come over a take a closer listen.
I of course obliged as it was the least I could do for the guy who
helped me carry the T-30LSE’s into my showcase theater room. We listened to “Hear Comes the Sun” (one of Harrison’s best, in my opinion). The guitars were rich and lively and the bass
heavenly. As the song ended my neighbor
commented that the Beatles wouldn’t sound this good if they were physically
playing in my room. He basically came to
my conclusion that we have achieved that “better
than being there” experience.
I am a firm believer of what Joe Cornwall, Business Development Manager at Impact Acoustics, once said to me about how your system dictates your listening preferences. When I engage an average sounding system, I typically use it mostly for movie or gaming playback. When I encounter a superb playback system, I focus most of my listening on two channel or multi channel high resolution audio. After nearly three months with this system, I estimated I spent nearly 80% of my listening time with two-channel or multi-channel music. Make no mistake, movie playback was very enjoyable, especially Xmen 3 with DTS ES, but I always found myself craving to hear the limitless dynamics these speakers could reproduce with the finest of recordings. Be forewarned, this system is very capable of quickly turning you into an audio elitist. You will find yourself picking apart recording quality of discs you once thought were reference material. For example, the Diana Krall Love Scenes DTS disc is a great sounding recording, but there is one particular track #3 “I don’t know enough about you” where the bass has a very fuzzy or distorted signature during sharp transients. I initially thought I blew a tweeter or perhaps had a rattle coming from my screen but later confirmed with my $500 Seinnheiser headphones that I was hearing induced clipping from the preamp – a careless result of over-saturation during the original recording process. This again affirmed to me that the RBH System was faithfully reproducing every subtle nuance and detail of the recordings.
Home Theater
DVD: Star Wars Episode III: Revenge of the Sith
 It was a difficult transition going from pristine multi-channel DVD-A / SACD
recordings to 5.1 Dolby Digital DVD’s.
When watching Star Wars Episode
III I could hear all of the compression artifacts in the recording. This was especially evident during the
massive explosions, which were more unpalatable to me than I previously
recalled. After listening to so much
uncompressed music on a system truly capable of delivering the dynamics, I was
spoiled. The tactile response during the
opening battle scene of Episode III was really amazing, despite the audio
nasties of Dolby Digital. The entire
flooring of my theater room shook as the capital ships pounded away at General
Grievous’s command ship.
It was a difficult transition going from pristine multi-channel DVD-A / SACD
recordings to 5.1 Dolby Digital DVD’s.
When watching Star Wars Episode
III I could hear all of the compression artifacts in the recording. This was especially evident during the
massive explosions, which were more unpalatable to me than I previously
recalled. After listening to so much
uncompressed music on a system truly capable of delivering the dynamics, I was
spoiled. The tactile response during the
opening battle scene of Episode III was really amazing, despite the audio
nasties of Dolby Digital. The entire
flooring of my theater room shook as the capital ships pounded away at General
Grievous’s command ship.
DVD: X-Men III The Last Stand
 X-Men III demonstrated much better
fidelity, no doubt because it was encoded in DTS ES. The scene where Magneto moves the Golden Gate Bridge towards Alcatraz was as stunning audibly as it was
visually. The RBH system displayed
excellent system synergy, making for a very realistic surround envelope across
the entire listening area.
X-Men III demonstrated much better
fidelity, no doubt because it was encoded in DTS ES. The scene where Magneto moves the Golden Gate Bridge towards Alcatraz was as stunning audibly as it was
visually. The RBH system displayed
excellent system synergy, making for a very realistic surround envelope across
the entire listening area.
Watching movies with well-engineered discs brought- a higher level of enjoyment than I’ve previously experienced in my reference system. The Achilles Heel of this system is its ability to reveal just how unpalatable highly-compressed audio sources really sound. The old saying garbage in equals garbage out is most applicable here.
RBH T-30LSE Recommendations
It can’t be all roses when it comes to any product, no matter how good it is. There are some negatives to this product. For one, the T-30LSE system is BIG and HEAVY. It is very difficult to move this system, especially up a flight of stairs. They require a lot of real estate in your room, which could be intimidating to your significant other. Speakers like this require a dedicated theater room or lots of “buttering up” to convince anyone they are a necessity. I have given guidelines in my Signature T-2P review on how to do this and I suggest you refer to that article if you are seriously considering these speakers.
Because of the multi-tweeter driver array, off axis lobing can be heard while moving from center-seated positions to standing in acoustically controlled rooms with relatively low ceilings (8ft or less). On the plus side, this can be said about any speaker system., The effects are more pronounced on this system mostly because of the incredible detail you can hear when seated at the proper height. You need to be sitting at least 10 feet away from these speakers to minimize lobing effects and to allow for proper acoustic summation of the drivers, thus requiring a large room for optimal performance. Care and patience must be extended to find optimal positioning to achieve the best possible sonic performance.
Editorial Note About Lobing
The classic argument against line arrays or speakers with multiple tweeter arrays suffering from lobing effects is something worth addressing in this review. You cannot get around lobing issues with these designs. You must work with them in a way that minimizes the effect as much as possible. Lobing occurs when two separate sources (i.e. a midrange and tweeter) are producing the same range of frequencies at different distances from the listener. The different arrival times of those same frequencies creates a filtering effect called lobing. Every multi-way (2 way and up) speaker design, unless it is acting as a point source, is going to have off axis lobing issues to one degree or another. Speaker designs which have multiple drivers reproducing the same range of frequencies (in this case multiple midrange or tweeter drivers) are certainly susceptible to lobing issues. The effects of lobing in the midrange and high frequencies are minimized in the T-30LSE due to the unique driver alignment of the speaker. The mid/woofer drivers are aligned in a curve so the top and bottom drivers are actually closer to the ear than they would be if the drivers where in a straight line. The tweeters are spaced apart from each other at a specific distance to minimize the cancellation effects of lobing at higher frequencies. That said, once the listener moves above or below the plane of the drivers, lobbing effects become more readily apparent. For critical listening, the listener’s ear should be within the plane of the mid/woofer and tweeter drivers. One of the benefits of this particular alignment is the off axis response is tailored to reduce image compromising reflections off near boundary surfaces.
In my huge room
I initially was able to induce mechanical noise out of the subs at extreme
output levels. At first listen, I thought I was bottoming the drivers but
later discovered the leads on the woofers were slapping against the cone.
I pushed the leads out on the problematic woofers and this virtually eliminated
this phenomenon - reducing it to a slight buzz when I stuck my head next to the
woofers while playing at insanely loud SPL levels (not recommended for health
reasons). RBH informed me this is something they normally do with the
bass drivers of every production unit before installing them into the
cabinet.
The bass portion of the T-30LSE system is so phenomenal, that I’d hope for RBH to one day offer stand alone subwoofer version of this design. Mechanical noise at high output levels, especially with long throw drivers, is quite common with products that don’t employ any self limiting within the mating amplifier or electronics. Perhaps if RBH Sound introduces such a product (ie. 1010-SE/R) based on this design, they can integrate an amplifier best suited for the drivers that will work within their mechanical design constraints along with offering active equalization for the low frequency optimization. Many manufacturers are doing this in their subwoofer products and I believe it would be a huge value with a small price premium for customers wanting the ultimate “tweakability” from the product. I suspect the ultimate setup of a T-30LSE system in a large room like mine would be the compliment of two additional subwoofers matching the performance of these speakers. The fact that I can’t say that about too many full range loudspeakers, speaks volumes about the bass quality of these.
My biggest issue with these speakers is that they are addictive. Owning a pair of the T-30LSE system means you will spend less time with loved ones or doing actual work if your theater room happens to be located in close proximity to your office. Almost every time I sat down to write up my experience with these speakers on my laptop, I found myself engaged in extended pleasure-listening sessions with a dead laptop battery thereafter. Be warned, these speakers are intoxicating.
Recommendations
In order to achieve the best performance of this ultimate loudspeaker system I suggest the following guidelines:
- Room size be a minimum of 10ft x 15ft
- Seated position be no closer than 10ft from plane of the speakers
- Use of a high quality 200wpc (min) amplifier that is stable down to 4 ohms
- Use of quality, snake oil free speaker cable no greater than 12AWG
- Moderately controlled acoustical environment (no glass walls or tiled floors)
Depending on the SPL level you need to attain in your room, powering these speakers full range demands an amplifier rated to deliver at least 200 Watts per channel into 4-Ohms. Of course, very high SPL’s in large rooms will require even more power and the T-30LSE can safely be used with amplifiers capable of delivering up to 1000 Watts per channel. For powering the mid/woofer and tweeter section of the speaker only, an amplifier capable of delivering 100-500 Watts per channel is recommended. I do stress quality over quantity in amplification (ensuring good SNR, low output impedance and low distortion).
The debate about biamping vs running these speakers full range depends on how you plan to use them. If the speaker system is going to be used primarily for stereo listening, you may want to start with a single channel of amplification per speaker and check out the performance. When the speaker is being used in a surround sound system, biamping is going to be the way to go. Biamping certainly can be advantageous no matter what the source material. A good quality AV receiver may be used to power the midrange and tweeter section of the speaker, while a separate full-range amplifier or dedicated subwoofer amplifier may be used to power the subwoofer drivers. By utilizing the bass management features of a processor or receiver the integration between the subwoofers and midrange drivers can be tailored to better suit your room acoustics. Also, when biamping, room correction equalization can be more easily implemented just like I achieved via Audyssey in conjunction with two additional subwoofers.
With the almost limitless dynamic range this speaker system offers it can be difficult to correctly match them for multi channel applications; of course if you have the real estate and the bank account you can just use five, or even seven of them! It doesn’t have to come to that to achieve excellent system synergy and performance. Any of the Signature series SE/R freestanding or SI/R in-wall products would be a good match for the T-30LSE’s. I definitely recommend the matching T-1 SE/R center channel or the 6100-SE/R (freestanding) or SI-6100/R (in-wall). For the side channels, the 66-SE/R’s work perfectly and although the 61-SE/R or SI-740/R’s (in-wall) will do the job for the back channels, I would suggest the 661-SE/R or SI-760/R (in-wall) instead due to their greater power handling, bass extension and efficiency.
RBH T-30LSE Measurements & Analysis
Measuring such a massive speaker system proved challenging. Rather than risk damaging these speakers and attempting to pull measurements outdoors, I did my best to do a combination of summed and scaled in-room nearfield and listening position measurements. An even greater challenge was determining the proper measurement distance where all of the drivers acoustically converge. This happened somewhere between two meters and the listening position. Unless otherwise stated, all measurements are of 1/12th octave resolution.
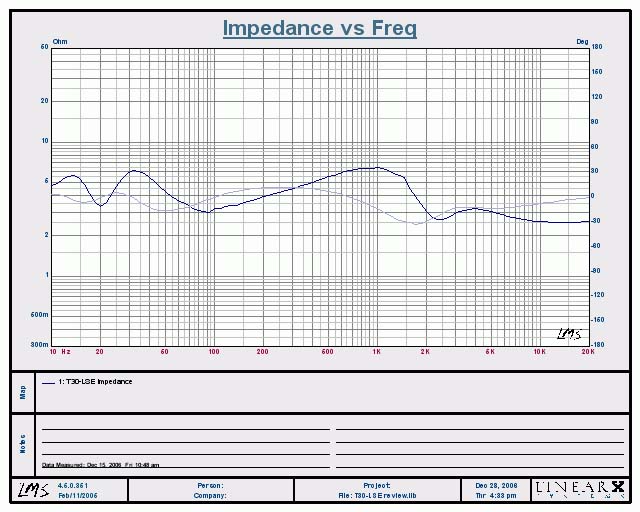
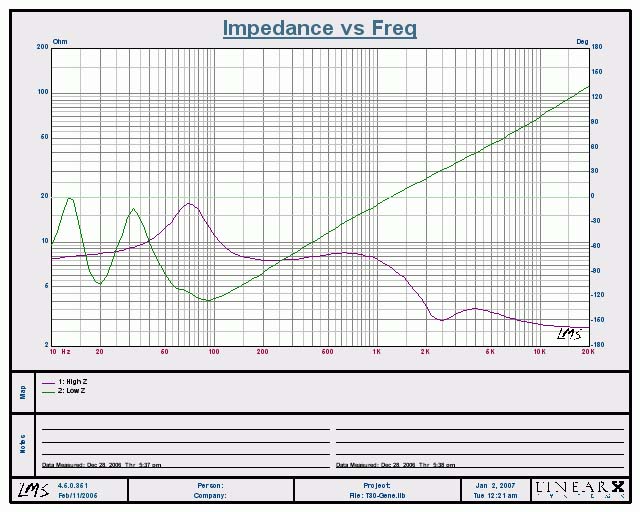
Figure 1. Impedance & Phase
The saddle point in the impedance graph lies just below 20Hz. While these speakers represent a relatively benign phase shift of +12 to -30 degrees across the entire audio band, the dip of 3 ohms centered around 90Hz and 2.5 ohms above 6kHz gives concern for driving them with amplifier of modest current output. I suggest using a beefy amp safely rated down to 4 ohms and definitely using an amplifier with a lowish output impedance to minimize frequency response variations. These speakers truly revealed the lackluster performance of the Panasonic SA-XR50 I keep on hand as a reference to poor amplifier performance. With the Panasonic powering these speakers, the natural reverb and ambience in vocals all but disappeared as the soundstage folded and the bass became sloppy and one notey sounding.
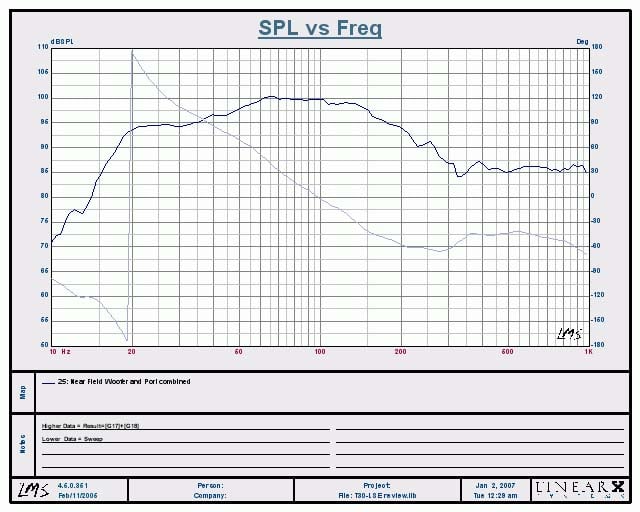
Figure 2. Nearfield Summed Bass Response
This plot represents the summed nearfield response of the woofers and the port which was scaled by a correction factor of 20*log10 (4/8) or -6dB to account for difference between the cone diameter and the port diameter. This measurement approximates an anechoic response. Note the -3dB point is around 18Hz. Production units are tuned to 20Hz with slightly more output in the 20-40Hz region. In most rooms, I think I’d prefer the lower tuning of my preproduction units since room modes usually cause additional reinforcement in this region. Slightly limiting the output here will allow for more placement flexibility and less EQ’ing necessary to flatten in room bass response.
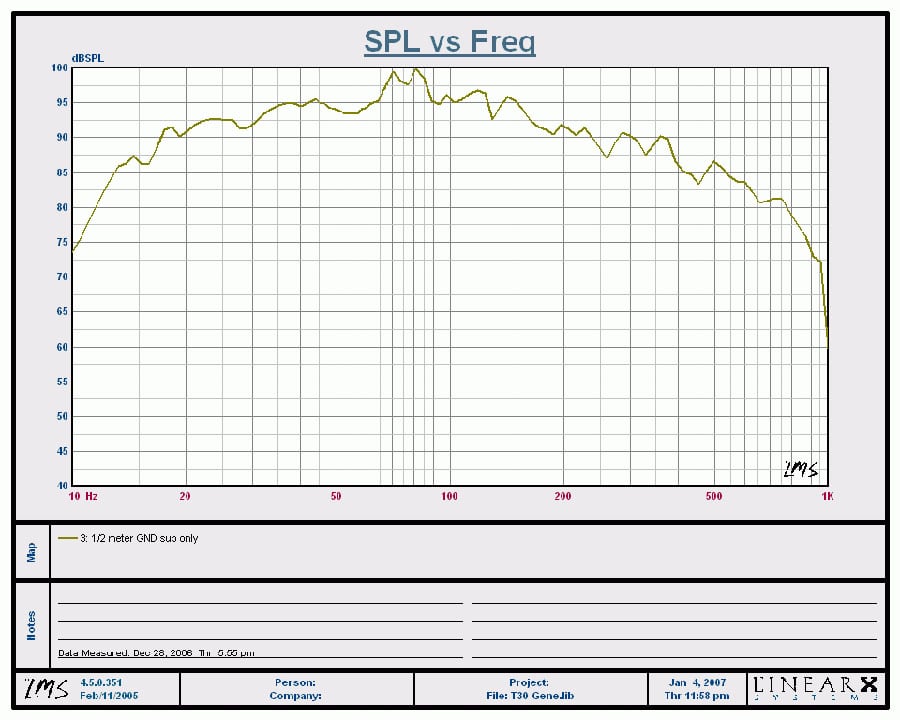
Figure 3. ½ meter In Room Ground Plane
I achieved a similar response curve in my ground plane in room measurement. Notice there is no HPF on the subs. RBH claims this allows for more optimal integration with the mid/tweeter section and better preserves time alignment and transient response. In a 2CH system this would work out just fine. However If you are setting this up for multi channel applications and plan on using additional subwoofers to achieve more uniform bass across the entire listening area, I suggest biamping these speakers and bass managing the subs at the proper system crossover point (80Hz or lower) to eliminate localization issues when running mono bass to all of your subwoofers located at different areas of the room.
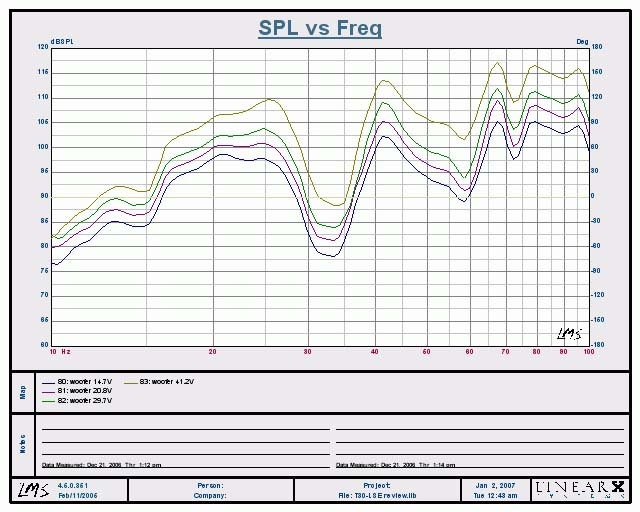
Figure 4. Subwoofer Power Compression Tests In Room Listening Position
The T-30LSE subwoofers can really handle the power and punch out some high SPL’s. We couldn’t measure any appreciable compression or power bandwidth loss to the limits of our amplifiers (running 400wpc) above 20Hz on this system!
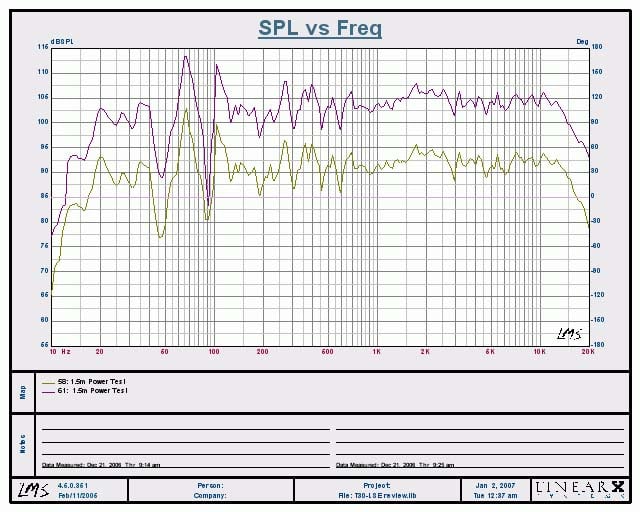
Figure 5. Full Range Power Compression Tests In Room Listening Position
The top half of the T-30LSE system remained equally composed and willing to pump out insanely loud SPL levels (at the 400 watt limit of our amplifier) with no hint of compression. Don’t try this test with a conventional 2 or 3 way system at these power levels.
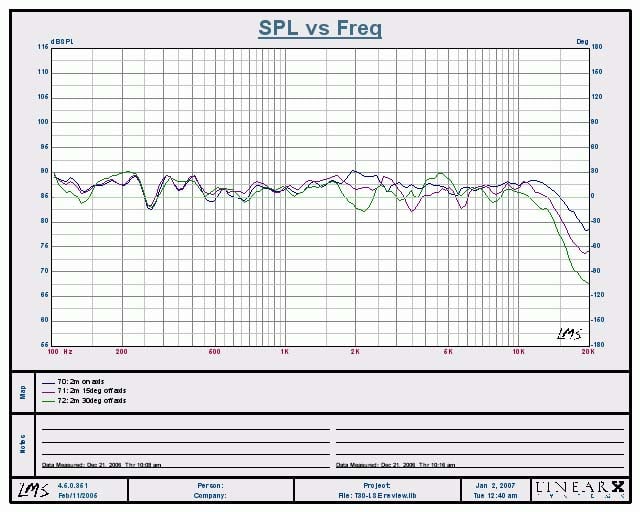
Figure 6. 2 meter On/Off Axis Frequency Response
The on/off axis response of these speakers remained very linear, exhibiting excellent dispersion characteristics. The smoothest response was found with just a slight toe in of about 7 degrees. The excessive high frequency roll off is a function of the drivers not fully summing at this distance and is not representative of what the listener will hear at a listening distance greater than a few meters (see Figure 7).
For speaker placement, I suggest starting with no toe in at all and experimenting to find the optimal response based on your room dynamics and listening preferences.
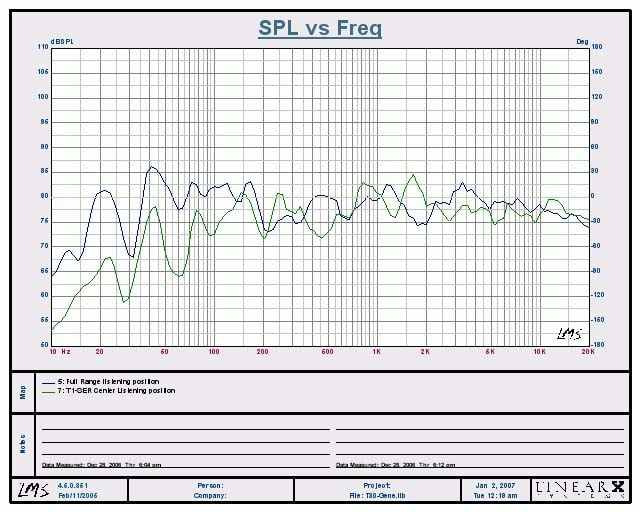
Figure 7. Frequency Response Comparison of T-30LSE & T-1 SE/R @ Listening Position
I found it interesting to note a very similar response curve at my listening position between the T-30LSE and the T-1 SE/R horizontally oriented as a center channel just below the screen. I did extensive listening from the far left and right seat and found this to be a superb center channel over an unusually wide listening area.
RBH T-30LSE Conclusion & Score Card
 The RBH
Sound T-30LSE system is a speaker system cut from a different cloth. It heeds the call of the wild, able to
satiate even the most discriminating audiophile’s appetite for sonic perfection. It was born to
reproduce music with unparalleled realism, free of dynamic range or bandwidth
limitations. The RBH Sound T-30LSE
system can go toe-to-toe sonically with some of the most expensive gear made
and comfortably hold its own. Though they
don’t have the name recognition of some of the “gourmet” brands, they more than
make up for that in the area that matters most – performance. At the end of the day you must ask yourself
this question: “Do you want to spend $15k/pair for the ultimate audiophile experience
on a speaker system some tube-loving audiophile hasn’t heard of, or spend
considerably more on a well recognized brand offering similar or less
performance?” In fact this is a question I pose to RBH Sound
as well. Aside from cosmetics, I believe
this speaker truly exemplifies the law of diminishing returns. Surely they can produce a speaker system with
a slight edge in performance, but its going to take a whole lot of cosmetic
enhancements to justify a higher price tag.
The RBH
Sound T-30LSE system is a speaker system cut from a different cloth. It heeds the call of the wild, able to
satiate even the most discriminating audiophile’s appetite for sonic perfection. It was born to
reproduce music with unparalleled realism, free of dynamic range or bandwidth
limitations. The RBH Sound T-30LSE
system can go toe-to-toe sonically with some of the most expensive gear made
and comfortably hold its own. Though they
don’t have the name recognition of some of the “gourmet” brands, they more than
make up for that in the area that matters most – performance. At the end of the day you must ask yourself
this question: “Do you want to spend $15k/pair for the ultimate audiophile experience
on a speaker system some tube-loving audiophile hasn’t heard of, or spend
considerably more on a well recognized brand offering similar or less
performance?” In fact this is a question I pose to RBH Sound
as well. Aside from cosmetics, I believe
this speaker truly exemplifies the law of diminishing returns. Surely they can produce a speaker system with
a slight edge in performance, but its going to take a whole lot of cosmetic
enhancements to justify a higher price tag.
The T-30LSE system is our current benchmark loudspeaker system. It delivers that “better than being there” experience that one rarely enjoys at live amplified concert events. Its exemplary ability to extract all of the detail in a recording while never sounding strained or fatiguing at the highest listening levels makes them without peer in this category. If you are after the ultimate expression in audio reproduction, you don’t need to look any further than Layton Utah – headquarters of RBH Sound. Keep in mind however that procrastination is NOT a good idea in this case, as RBH Sound is only producing 100 pairs (many of which have already been pre-sold) of these limited edition speakers. You better get your dose of overindulgence before they are going going … gone.
The Score Card
The scoring below is based on each piece of equipment doing the duty it is designed for. The numbers are weighed heavily with respect to the individual cost of each unit, thus giving a rating roughly equal to:
Performance × Price Factor/Value = Rating
Audioholics.com note: The ratings indicated below are based on subjective listening and objective testing of the product in question. The rating scale is based on performance/value ratio. If you notice better performing products in future reviews that have lower numbers in certain areas, be aware that the value factor is most likely the culprit. Other Audioholics reviewers may rate products solely based on performance, and each reviewer has his/her own system for ratings.
Audioholics Rating Scale
 — Excellent
- — Very Good
- — Good
- — Fair
- — Poor
| Metric | Rating |
|---|---|
| Build Quality | |
| Treble Extension | |
| Treble Smoothness | |
| Midrange Accuracy | |
| Bass Extension | |
| Bass Accuracy | |
| Imaging | |
| Soundstage | |
| Dynamic Range | |
| Fit and Finish | |
| Performance | |
| Value |
Gene manages this organization, establishes relations with manufacturers and keeps Audioholics a well oiled machine. His goal is to educate about home theater and develop more standards in the industry to eliminate consumer confusion clouded by industry snake oil.
View full profile