
The Audibility of Distortion At Bass Frequencies
Distorted Subwoofer
What is Distortion and How Do We Perceive it?
In the chain of modern audio equipment, the speakers will almost always be the weakest link in terms of accurate reproduction, and a major contribution to that weakness is the errant reproduction of bass. This article discusses some of the ways speakers and subwoofers distort accurate playback of low frequency content, and we will concern ourselves mainly at which point that it becomes audibly noticeable. We should emphasize that your speakers and subwoofers do distort bass sound, and this distortion is unavoidable and constant when in use, and it can be extensive at high amplitudes or very low frequencies. The amount of distortion produced by the low frequency driver would be considered atrocious in the signal chain up to the driver (excepting LP record playback), but the driver is nowhere near as linear of a device as the electronic signal processing. The nonlinearity of the driver may still be well below human perception, and since human perception is the end toward which all our audio equipment is merely a means, it is essential that we make this the aim of our discussion. This is just as well, since it would be hugely impractical to attempt to make a speaker or subwoofer playback bass with the accuracy of modern digital electronics signal processing.
When one considers the task of reproducing low frequencies from the perspective of physics, it is no wonder the most distortion is incurred in this band of the sound spectrum. Consider how much more air displacement in cubic inches is needed for a sealed 12” woofer to retain the same output level at 1 meter as frequency decreases. See Table 1:
Air Displacement vs Frequency and SPL
| 10 Hz | 20 Hz | 50 Hz | 100 Hz | 1000 Hz | |
| 80 dB | 34.06 | 8.52 | 1.36 | 0.34 | 0.0034 |
| 100 dB | 340.64 | 85.16 | 13.63 | 3.41 | 0.034 |
| 110 dB | 1077.20 | 269.30 | 43.09 | 10.77 | 0.11 |
Table 1. Air displacement in cubic inches needed for a sealed 12” woofer to produce SPL/ frequency at 1m.
From this you can see that the challenge of linear bass playback rises exponentially as the frequencies fall. While our 12” woofer only needs to move .000952 inches to reproduce 110 dB at 1,000 Hz (a much smaller distance than the thickness of the average human hair), it must move 9.52 inches to achieve the same loudness level at 10 Hz!
Needless to say, the precise displacement of such large volumes of air is a formidable task, and at extremely deep frequencies producing even modest levels of output can overtax an ordinary low frequency driver . The stress of the high excursion levels needed to displace that much air manifests itself as various forms of distortion. At these limits of the transducer’s performance, stresses occur in a number of different system points, and these points contribute their individual distortions to the overall system distortion. We will briefly describe a few of these system points, but those unfamiliar with driver design and individual driver components may first want to read the beginning section of this loudspeaker driver design article to acquaint themselves with the basics before continuing. It should be said here that for this article we will focus on the more gradual and commonly heard forms of distortion which plague low frequency drivers rather than the sudden and glaring disruptions such as ‘bottoming out’ noises or ‘chuffing’ from port turbulence.
Some Causes of Distortion
Fig. 1. Driver in motion (GIF image courtesy of Kyle Dell’aquilas)
One of the chief sources of distortion, if not the dominant source of distortion in a bass driver, is variation in the magnetic field due to the travel of the voice coil with respect to the permanent magnet. Ideally, the force of the magnetic field between the voice coil and permanent magnet would remain the same at all times during excursion, but as the voice coil moves away from the center of its rest position, the force of the magnetic field exerted on the voice coil changes. At small excursions, the change of this magnetic force is slight, but at high excursions a larger section of the voice coil leaves the central magnetic field of the permanent magnet (called ‘the gap’), and, as a consequence, the magnetic force between the voice coil and permanent magnet is substantially weakened. Since the magnetic field has a weaker grip over the voice coil, control over the entire moving assembly has diminished. The loss of cone control manifests itself in distortion.
Another major contributor of distortion is the driver’s suspension, which consists of the spider and surround. The spider has a tough job; it has to keep the voice coil and former tightly centered in the gap yet allow the voice coil and former consistent, predictable travel perpendicular to their axis. The compliance of the spider becomes a big deal here; if the spider is too stiff, it makes the moving assembly (voice coil, former, and cone) too tough to move, but if it is too loose, it will not be able to keep the voice coil properly centered in the gap. The spider and surround must have a specific amount of compliance for the linear travel of the moving assembly, however both do exhibit nonlinear restoring forces. At small amplitudes the resulting distortions are inaudible, but they increase with sound level. At the extremes of excursion, the spider gains a severely inordinate amount of tension, and linear travel of the moving assembly is greatly diminished. At that point the cone cannot track the signal, and distortion sets in.
A third major cause of distortion is due to the inductance generated by the motion of the voice coil. To put it very simply, the motion of the charged voice coil within the magnetic field of the gap induces a counter voltage with its own corresponding magnetic field, and this counter magnetic field interferes with the initially desired electrodynamic relationship between the voice coil and permanent magnet. This phenomenon is a consequence of Lenz’s Law. There are ways of lessening adverse inductance effects, such as shorting rings, but it cannot be eradicated entirely.
One more cause of distortion is the effects of heat on the driver. A steady flow of electricity through the thin wire of the voice coil will inevitably cause it to heat up, and this heat raises the electrical resistance of the voice coil, which thereby reduces the current. Heat also causes a reduction in the magnetic force of the permanent magnet. Together these lead to a loss in sensitivity, a warping of frequency response, and a lowering of output capability. These effects are collectively known as thermal compression (or perhaps more commonly known as ‘power compression’), which can be seen in Figure 2.
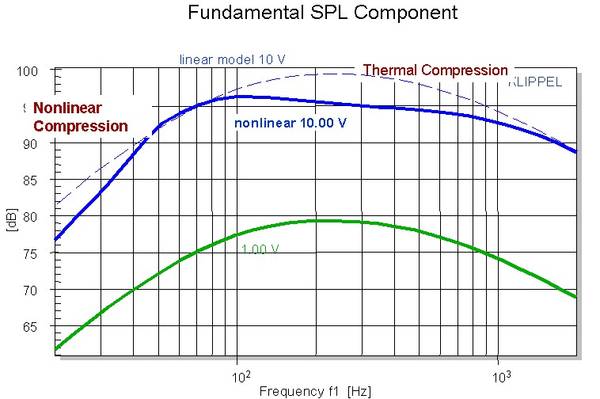
Fig. 2. Thermal compression chart - courtesy of Klippel GmbH
Something to keep in mind is that the above discussed loudspeaker driver failings occur in every conventional driver. In well-engineered drivers, they only become a problem at the upper limits of their performance. However, for a poorly engineered driver, these can become problematic even at modest levels, so these issues may not only be relegated to loud output levels.
Types of Distortion: Linear vs. Nonlinear
We have discussed a few of the causes of distortion, but before we proceed to talk about the levels of audibility of distortion, we need to cover distortion types. Distortion can be divided into two groups: linear and nonlinear.
Linear distortion in speakers is considered to be mainly changes in amplitude and phase with respect to frequency response. Examples of those are effects are similar to what happens when using a filter or equalizer. In linear distortion, individual frequency bands may have altered amplitudes and thus a distorted balance of loudness in output, but the level of distortion remains proportionate to itself in that it does not depend on the input signal level; in a sense, linear distortion is ‘blind’ to the content it is distorting.
Nonlinear distortion, on the other hand, is dependent on the level and frequency of the input signal and can often create many output frequencies based on a single input frequency. Nonlinear distortion is much more difficult to predict and assess, because you have to know what the input signal is like in order to understand its relation to the output, whereas in linear distortion, the distorting mechanism will treat every incoming signal the same way.
The Audibility of Linear Distortion in Low Frequencies
Linear distortion makes itself known by changes in amplitude and phase. Since the audibility of phase distortion was previously covered quite well in this phase distortion article, we will simply encourage you to read that to address that topic. The audibility of amplitude changes was covered in this article on human amplitude sensitivity (which we recommend you read if you don’t yet have a good understanding of that subject), however, what wasn’t emphasized in that article, but what is important to our discussion, is the extra sensitivity to changes in loudness in low frequencies. To explain, let’s direct our attention to the behavior of frequencies below 150 Hz on the equal loudness chart on Figure 3. For those unfamiliar with the equal loudness curve, here is an explanation, but to briefly explain, it is a graph of the perceived loudness of sound at frequencies for an absolute loudness level. For those familiar with the Fletcher-Munson Curves, it is an updated version of that research.
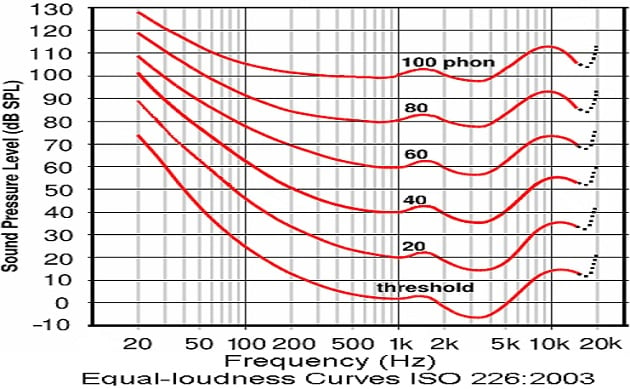
Fig. 3. Equal Loudness Contour -used by permission of sengpielaudio.com
Notice how in the bass region, the perceptual constant loudness lines are more tightly bunched up above the minimum audible threshold. This is significant to us, because what it means is that we hear changes of loudness in bass more easily than in any other frequencies. When we consider that, with normal hearing, we can discern about a 1 dB difference over a broad range of frequencies and loudness levels, it gives us a perspective on how particularly acute our sensitivity to bass loudness is above the minimum audible threshold. Studies have shown it takes a 10 dB increase in SPL for a perceived doubling of loudness in mid and high frequencies but only a 6 dB increase for a perceived doubling of loudness at bass frequencies. Keeping that in mind, consider the how a drop of 5 dB below 30 Hz can change the character of a movie scene, or how a 5 dB spike around 60 Hz can alter the reproduction of a full orchestra.
The most grievous cause of linear distortion in bass is undoubtedly the effects of room acoustics where 20 dB peaks and dips are not uncommon. Since that subject has been addressed by Audioholics in past articles such as this room acoustics article, we won’t repeat what has already been said and instead encourage you to read it if you don’t already know how enormously destructive room acoustics can be on the linear reproduction of bass.
Another serious contributor of linear distortion in amplitude is the previously discussed thermal compression, where drops in output can be much less than half the original loudness. One might guess that it takes a while for heat buildup to take its toll on the output capability of a driver, but one highly-regarded pro-audio bass driver was demonstrated to lose 4 dB of output capacity in 2 seconds under a heavy load. At large signal amplitudes (i.e. head-banging levels of loudness), the effects of thermal compression can be formidable. We should mention that thermal effects can produce another potential distortion from thermal behavior from the driver: if too much current is continuously supplied, the voice coil can burn off its insulation and potentially start a fire; however, the sound of your speaker burning is almost certainly a nonlinear distortion.
One more linear distortion in bass we will discuss is called group delay. Group delay is the measurement of how much time it takes for individual frequency bands of an input signal to be produced by the speaker. It can indicate that some frequency components are developing slower than others or are taking longer to decay. Its effects are temporal but can sometimes be seen in a frequency response measurement as peaks from stored energy or ringing. The audibility of group delay depends on the length of the time lag between different frequencies and can be measured in either cycles or milliseconds. The absolute playback level has also been found to be a factor in the audibility of group delay. The minimum audible thresholds of group delay for low frequencies has not been studied as extensively as higher frequencies where it was found humans begin to perceive group delay at around 1.5 to 2 milliseconds at 1 kHz and above. However, bass frequency cycles last substantially longer than 2 milliseconds: a 100 Hz cycle has a duration of 10 milliseconds, a 50 Hz cycle has a duration of 20 milliseconds, and a 20 Hz cycle has a duration of 50 milliseconds, to name a few examples. It can be seen from these cycle lengths that group delay has more potential to be heard from sharp transient sounds such as kick drums or bass guitar plucks, where the attacks and releases of the sound envelope are sudden. It may be worth mentioning at this point that human perception may have a sort of built-in group delay, as it was found that the hearing system requires a much lower time interval to assess the spectral content of a mid-frequency tone as opposed to a low frequency sound. Although the audibility of group delay in bass frequencies hasn’t been found to be the subject of extensive research, an informal guideline in the audio business is that group delay under 1.5 cycles in bass frequencies isn’t likely to be audible, and in very deep frequency playback at around 30 Hz and under, human hearing will tolerate even higher levels of group delay before noticing it. According to the respected audio researcher Peter Mitchell, group delay in excess of 20 milliseconds can alter the subjective character of bass in more commonly heard bass frequencies, so for 50 Hz and above group delay should be kept to less than a single cycle for total inaudibility.
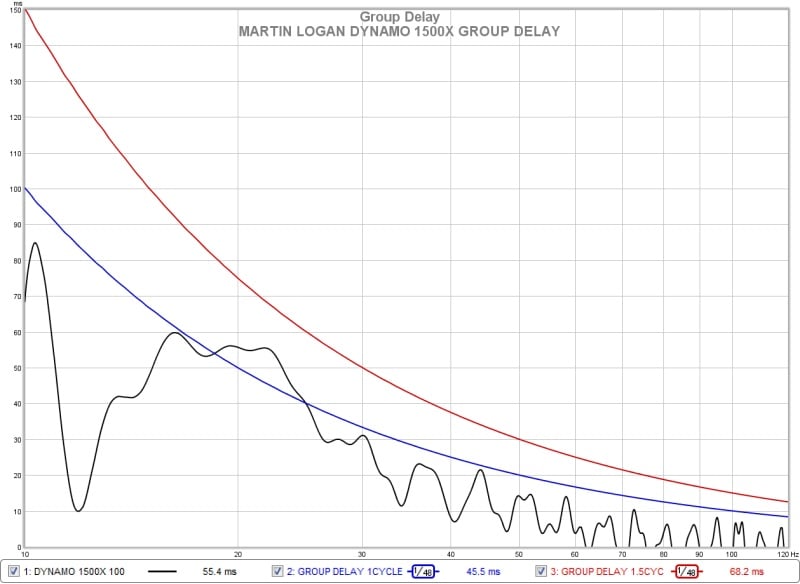
Fig. 4. Group delay graph - output above red line may be audible. Measurement taken by Josh Ricci.
Nonlinear Distortion and Perception at Low Frequencies
As was explained on the previous page, nonlinear distortion is dependent on the level and frequency of the input frequency. To put it another way, some aspect of the signal has to ‘activate’ a mechanism of distortion. A somewhat blunt example of this is a signal processing hard limiter; the signal may be reproduced with accuracy until a passage with sufficiently large amplitude triggers the limiter, which then lowers the output level (thereby distorting it) until the input signal level no longer surpasses the amplitude threshold of the hard limiter’s activation point. This is a lot like what happens when a speaker driver bottoms out. When the moving assembly of the driver hits the limit of its excursion, whether it’s from the voice coil hitting the backplate or the suspension being stretched to its limit, the driver can no longer reproduce amplitudes above a certain point, but below that point it may be able to play back the signal with reasonable fidelity. The maximum mechanical excursion of the driver is the limiter, and this limiter isn't activated until the input signal has surpassed a specific level of amplitude over frequency. It is a distortion that is dependent on an aspect of the input signal and doesn’t occur until then. Those are rather blatant examples of nonlinear distortion, and we will focus our discussion on the types of nonlinear distortion which happen in more typical conditions, namely harmonic distortion and intermodulation distortion. Let’s begin with harmonic distortion, because it is the simpler of the two.
Harmonic Distortion
Every sound has a fundamental frequency (usually just called the fundamental), which is the lowest frequency component of that sound. A harmonic is a frequency component in the sound that is an integer multiple of the fundamental. So, if the fundamental is 100 Hz, the harmonics would be multiples of whole numbers above that: 200 Hz, 300 Hz, 400 Hz, and so on. Harmonics are ordered by the multiple of which they follow the fundamental, so, for example, the 200 Hz harmonic of a 100 Hz fundamental is the second harmonic, the 300 Hz harmonic would be the third harmonic, the 400 Hz harmonic would be the fourth harmonic, and so on. Most sounds we hear have harmonic components, and it is an immensely important principle in sound reproduction, not to mention music, physics, and engineering.
So how does the principle of harmonics tie into distortion? Well, what if your speaker produced harmonic components that were not in the original signal? This addition of extra harmonics is called harmonic distortion, and every speaker does it to some degree. Our concern about harmonic distortion for this article is at what point does it become audible in bass frequencies. This is not a simple matter, because harmonic distortion can be heard in a number of different ways. This is due to the fact that it adds entirely new frequency content to the output, unlike the distortions discussed up to this point that really only changed the loudness of existing frequencies. Energy must be conserved, however, and the amplitude of the fundamental is reduced, with the missing energy transformed into harmonics.
Let’s take a look at a simple example of harmonic distortion in action. Figure 1 is a graph of the input signal, which is a very simple sound, namely a 50 Hz tone. Keep in mind that we are not measuring the nonlinearity itself and that we are only measuring how it responds to a single frequency.
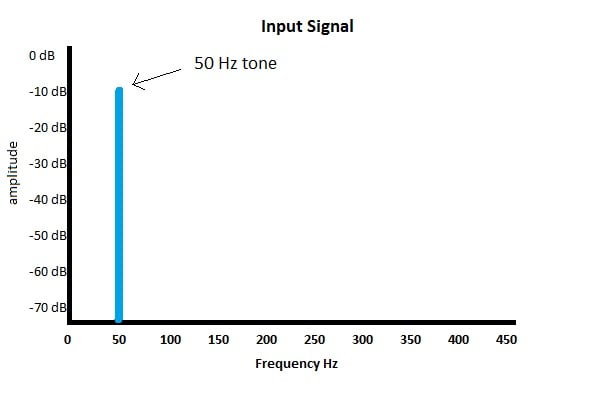
Fig. 5. Frequency graph of the input signal.
Now let’s run our input through a typical speaker, and see what happens in Figure 6:
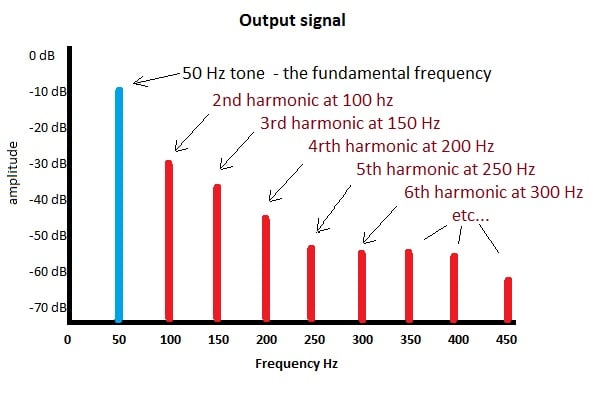
Fig. 6. Frequency graph of output demonstrating harmonic distortion.
A whole new set of sounds has been added to the signal: harmonics. They can be generated in many different ways and are generally a byproduct of nonlinear cone travel. Recall our earlier discussion of the mechanisms of distortion: the variation in magnetic field due to excursion, the change in the compliance of the suspension due to excursion, and the change of magnetic field due to inductance. These are typically the major sources of harmonic distortion in bass output, but any nonlinearity will create harmonics.
Before we specify the levels at which harmonic distortion becomes audible in bass, we must first go over two important concepts for this subject, which are the threshold of audibility of low frequencies and auditory masking.
Audibility of Low Frequencies
Refer back to Figure 3, the equal loudness contour chart, and note how rapidly low frequencies become inaudible to human hearing as they decrease. For an example, note that 20 Hz starts to become audible at just below 75 dB, and compare how perceptually loud 60 Hz is at 75 dB, which is approximately 40 dB. Even though they share the same absolute sound pressure level of 75 dB, there is an approximately 40 dB perceived loudness difference between them (a 40 dB increase is 100 times greater sound pressure level). In other words, the equal loudness contour is telling us that, for the same sound pressure level, bass frequencies become a lot louder to human hearing for even small increases in frequency below 150 Hz or so. At this point, it should be noted that the equal loudness contours were created using pure tones in an anechoic chamber using 1 kHz as a reference frequency. They do not work for broadband sounds as well except in a very broad manner.
Now let us consider our greater sensitivity to changes in sound pressure levels in low frequencies when viewing Figure 6, the graph of harmonic distortion products. It would suggest that the harmonic products would be perceived as being much louder than they actually are with respect to the fundamental, since the fundamental is in a relatively low frequency and thus lower perceived loudness level compared to the harmonics when taking the equal loudness curves into account. This deficiency in human hearing would render us unusually sensitive to harmonic distortion, were it not for another trait in human hearing called ‘auditory masking’, which almost acts as a counterweight to the first deficiency.
Auditory Masking
Anyone with normal hearing will be familiar with the idea of masking, which is where a loud sound can make a softer sound inaudible. Try holding a conversation in a bar on karaoke night for an experience of the masking effects of loud noise. However, most people don’t realize just how extensive auditory masking is. Masking happens at every loudness level, although at louder levels, the bandwidth of the masker widens, and a great deal more is concealed. In auditory masking, the ‘masker’ is the loudest sound of the bands of frequencies it is concealing, and the ‘maskee’ is the sound that cannot be heard under the masker. In human hearing, the masker creates a frequency band around itself wherein softer sounds are hidden, but the masker’s influence diminishes as the frequencies grow further away from the fundamental. This means that a loud sound at one frequency will be able to better disguise sounds that are closer to it in frequency than sounds which are much further away in frequency. Another important aspect of masking is that at increasingly louder levels and also at lower frequencies, the masking band spreads upward over higher frequencies much more than lower frequencies, so higher frequencies are masked much more than lower frequencies, although frequencies lower than masker can be masked as well. Let’s take a look at what that means for harmonic distortion in Figure 7:
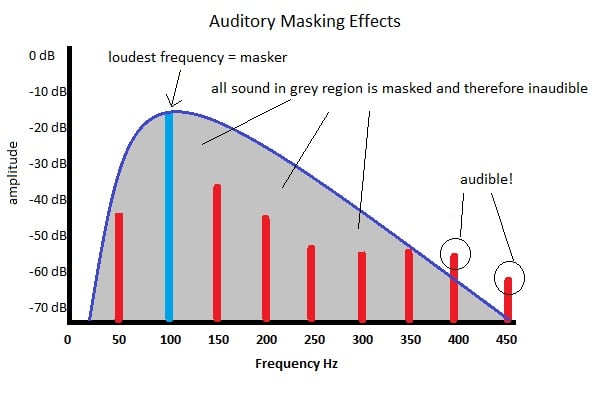
Fig. 7. Effects of masking on harmonics
As we can see from our crude illustration, most of the harmonic distortion has been masked, however, a couple of the high order harmonics were far enough away in frequency and loud enough to be heard. So in order to determine the audibility of harmonic distortion, we have to know how much masking is done by different tones at different loudness levels. Many researchers have investigated masking, but the most extensive study in this area with respect to low frequencies was conducted by Louis Fielder and Eric Benjamin. They determined masking thresholds for a number of frequencies and loudness levels, such as Figure 8, where a 50 Hz tone was replayed at 80 dB, 100 dB, and 110 dB. To explain Fig. 8., from Fielder and Benjamin’s research, a 50 Hz tone with a sound pressure level specified by the dashed lines will mask any sound with a loudness level and frequency below those lines.
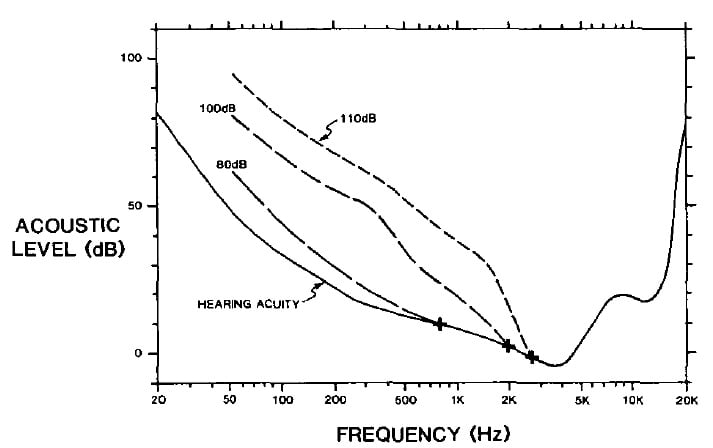
Fig. 8. Masking thresholds of a 50 Hz tone. 0 dB = 20 μPa. Reprinted by permission of AES.
It’s worth mentioning at this point that auditory masking happens not just during the sound itself, but also before it and after it, in a phenomenon known as backward masking and forward masking. The masking sound can actually hide sounds from our perception that occur as much as 25 ms before the masking sound itself, and this is known as backward masking. Forward masking is the masking of sounds after the masker itself has ended. Forward masking covers up other sounds for a longer duration than backward masking, and low frequencies forward mask more than high frequencies.
Total Harmonic Distortion (THD): Is It a Good Indicator of Sound Quality?
Harmonic distortion is often stated as a measurement called Total Harmonic Distortion, or THD, which is a percentage of the overall signal composed of harmonic distortion. THD is not a good indicator of how audible harmonic distortion will be unless it is of an extremely high or extremely low value. This is because there could be relatively high amounts of harmonic distortion in lower orders which could compose a substantial percentage of the output but not enough to surpass masking thresholds and so is inaudible, or there could be only be small amounts of higher order harmonic distortion which lay beyond the range of the masking, and while it may only compose a small percentage of the output, it could easily be audible. In order to determine the audibility of harmonic distortion, we need to see the component harmonics, not just the overall percentage of harmonic distortion. If we can see that the harmonics are either loud enough or of a high enough order that they will lay outside of the masked region for the fundamental, we then know that harmonic distortion will be audible. Let’s take a look at some of the specific examples of this which were observed by Fielder and Benjamin in their study in Table 2, which represents the maximum allowable distortion limits for the 2nd through 5th component harmonics before they became audible:
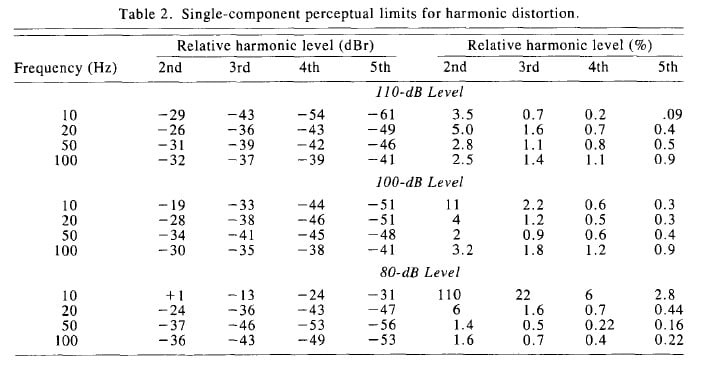
Table 2. Reprinted by permission of the AES.
One obvious and expected trend to see is that lower harmonics are masked much more than higher harmonics, and this, of course, is because they are much closer to the fundamental. Moreover, as was discussed, higher sound pressure levels broaden the masking levels with respect to lower loudness levels, so more harmonics are masked as a percentage at loud levels. However, there is a curious feature of this data set that is worth noting.
One oddity is that at the louder tones of 100 dB and 110 dB, the lower frequencies are better at masking high order harmonics than the higher frequency tones, but not the lower frequency harmonics. For example, at 110 dB, a 20 Hz tone will mask a 2nd harmonic up to 5% of the total output and a 100 Hz tone will mask a 2nd harmonic for up to 2.5%, but for the same loudness level, a 20 Hz tone will only mask a 5th harmonic up to 0.4% while the 100 Hz tone masks the 5th harmonic up to 0.9%. This is counterintuitive to what one would expect from viewing a equal loudness chart, as the steeper slope of human sensitivity at deep frequencies would seem to indicate that further harmonics would be especially audible. This effect is due to the fact that the measured harmonic bands of the lower frequencies are much narrower than the higher frequencies; the 5th harmonic of 10 Hz and 20 Hz is to 50 Hz and 100 Hz respectively, while for 50 Hz and 100 Hz it goes to 250 Hz and 500 Hz. However the masking band of frequencies below 300 Hz remains constant due to a characteristic in our hearing known as critical bands.
Very simply put, critical bands are the bandwidth around a frequency that become activated by that frequency in the human auditory system, and this neural activation causes the perception and sensing of frequencies near the center frequency to interfere with each other. It is a major factor in auditory masking, and the way critical bands act throughout the frequency spectrum of audible sounds changes, so critical bands affect bass frequencies differently than higher frequencies. Below around 200 Hz to 300 Hz, critical bandwidth is roughly a 100 Hz wide band around the center frequency. This means that higher order harmonics of extremely deep frequencies have a better chance of being masked than mid and upper bass frequencies, as their major harmonics are contained within a much closer band to the fundamental.
A More Sensible Metric of Distortion
We have established that THD is a poor measurement to gauge the audibility of harmonic distortion, but now we have a newer and more sophisticated metric that attempts to rate the severity of distortion in bass. CEA-2010 measures the harmonic distortion components of a series of low frequency tone bursts and takes into account the greater audibility of higher order harmonics by weighing them more heavily. CEA-2010 specifies that testing must take place in a controlled environment that has a low ambient noise level, no interfering acoustics, and a limited range of temperature and relative humidity. The tones are played at progressively higher levels until the device will not get any louder or the output distortion of the device crosses a predetermined percentage threshold with respect to the input signal. The highest output level of the tone before crossing the passing distortion threshold is recorded, or, if it didn’t cross the distortion threshold, simply the highest output level is recorded.
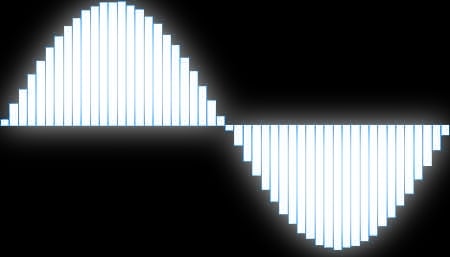
Let’s walk through an example of an iteration of one of the CEA-2010 tone tests to get a closer look at how and why their distortion thresholds were chosen. CEA uses shaped burst tones, and their standard test frequencies are 20 Hz, 25 Hz, 31.5 Hz, 40 Hz, 50 Hz, and 63 Hz. However, the distortion threshold is the same for all of them and therefore can be used to test frequencies above and below those six frequencies. The shape of the input signal can be seen in this 20 Hz burst tone in figure 9; the sound output wave will ideally be an exact match of that electric wave. That is impossible, of course, and our priority should be acceptable distortion, not perfection, hence the use of passing distortion thresholds and not zero distortion.
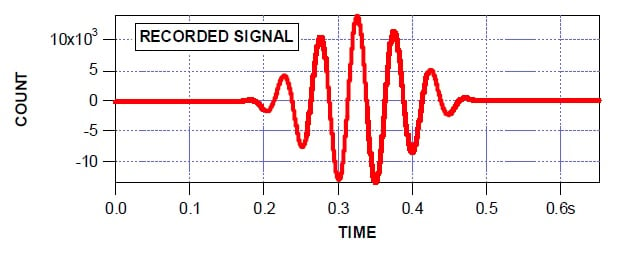
Fig. 9. 20 Hz CEA-2010 shaped burst tone. Used with permission of Don Keele and Harman International from a CEA-2010 presentation given by Keele in Oct. 2008
The distortion thresholds for CEA-2010 are pictured in Figure 10. The horizontal axis is arranged by harmonic orders, and the test signal is the first harmonic, the fundamental. The stepped lines in the chart indicate the distortion thresholds; in order to achieve a passing CEA-2010 measurement, the output must not generate any harmonics greater than those thresholds. You can see that higher order harmonics have a much lowering passing threshold compared to lower order harmonics, and, as was explained earlier via the equal loudness contour, this is because it is much easier for us to hear higher frequency sounds than deep bass sound, and so sound from those higher harmonic distortions can be audibly objectionable in much smaller amounts.
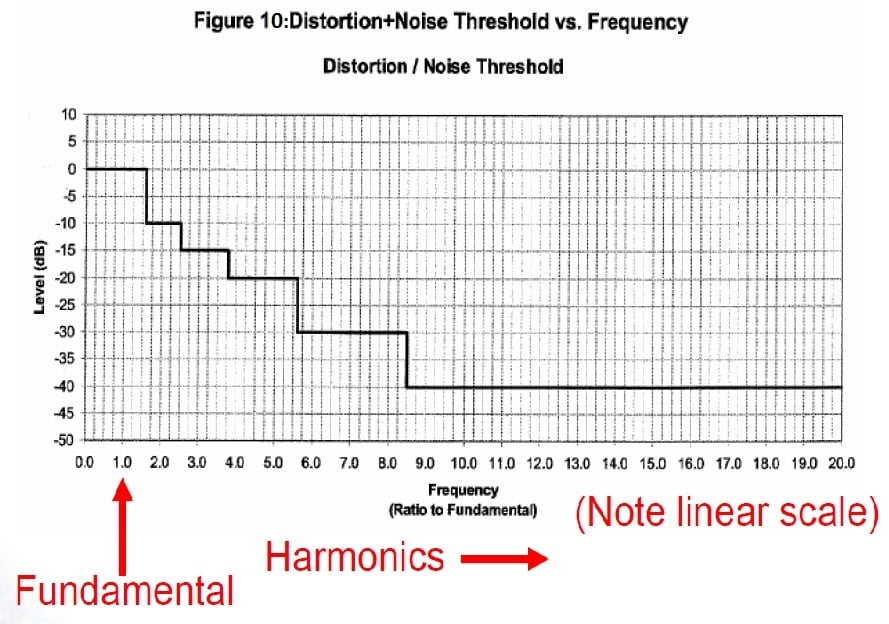
Fig. 10. CEA-2010 distortion threshold for harmonics. Used with permission of Don Keele and Harman International from a CEA-2010 presentation given by Keele in Oct. 2008
Let’s see how our perfect 20 Hz input signal from Figure 9 would look like against these thresholds in Figure 11:
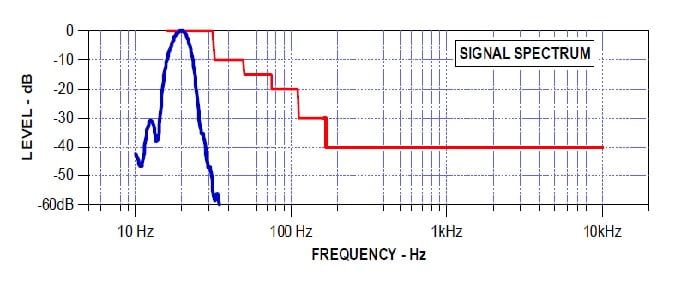
Fig. 11: 20 Hz input signal vs. CEA thresholds. Used with permission of Don Keele and Harman International from a CEA-2010 presentation given by Keele in Oct. 2008
Unsurprisingly, a perfect signal begets a perfect passing measurement. No harmonic distortion is present in the input signal, of course, and we only show this to demonstrate what a perfect measurement is supposed to look like.
Now let’s see what a real world subwoofer measurement at 20 Hz looks like: the output signal in Figure 12 and its spectra in Figure 13.
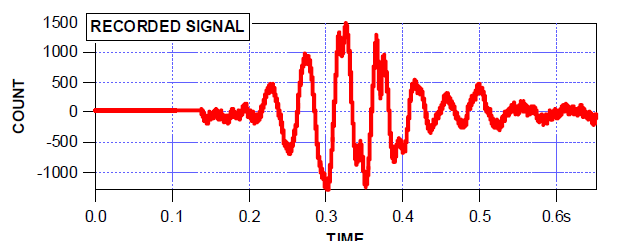
Fig. 12. recorded 20 hz output CEA-2010 measurement. Used with permission of Don Keele and Harman International from a CEA-2010 presentation given by Keele in Oct. 2008
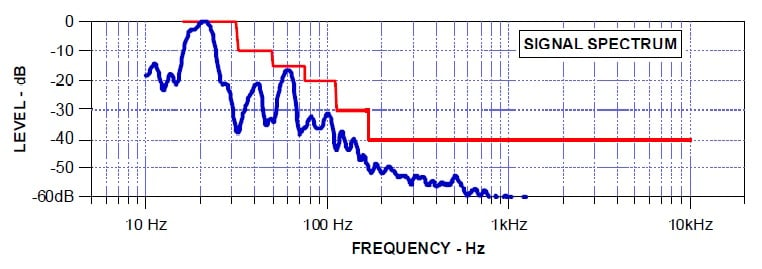
Fig. 13: spectrum output of 20 Hz CEA-2010 tone. Used with permission of Don Keele and Harman International from a CEA-2010 presentation given by Keele in Oct. 2008.
The changes from the input to the output are very clear. The recorded signal in Figure 12 looks like Figure 9 has been put through the wringer, and, in a sense, it has. It is a recording of the subwoofer run near the edge of its performance, and the mechanical stress is taking a toll on the fidelity of playback. However, if we look at Figure 13, we see that it managed a passing measurement- but just barely, as the third order harmonic distortion was very close to the distortion threshold. The subwoofer recorded this measurement at 103.1 dB.
According to CEA-2010, the output recorded in Figures 12 and 13 is an acceptable level of distortion for a 20 Hz signal. However, when we compare what we see in Figure 13 against the maximum allowable harmonic distortion levels in Table 2 for 20 Hz around the same output level, we see that what is reflected in the CEA-2010 thresholds is well over the limits as established by Fielder and Benjamin’s research. From their findings, a 3rd harmonic that is -15 dB from a 103.1 dB fundamental would be very audible, and they found that for 100 dB and 110 dB, a 3rd harmonic would be heard at -38 dB and -36 dB respectively. CEA-2010 would seem to permit 100 times the amount of distortion than what was found to be audible.
CEA Distortion Thresholds
So why does CEA-2010 permit such high levels of distortion to give a subwoofer a passing grade? There are several reasons. We have to remember that Fielding and Benjamin’s work was done in carefully controlled laboratory conditions. Typical listening conditions will have a lot more background noise and could raise the level of distortion audibility. Another reason is that the test tones used by Fielding and Benjamin and CEA-2010 testing are nothing like normal recorded content people listen to. Normal music and speech is vastly more complex than a single tone at a single amplitude level. Distortion is much more heavily masked in regular content than in pure tones, and the more spectrally complex the content, the more difficult it is to detect distortion. If you have a sound composed of thousands of different frequencies instead of just one, attempting to discern what amount of which frequency is distortion becomes much more difficult.
One element of the human auditory system that lowers the perception of distortion in normal audio content is the fact that human hearing needs time to resolve the frequency spectra of sound. Experiments have shown that it takes 10 to 20 milliseconds to form an opinion on the spectral content of a mid frequency tone and 40 to 60 milliseconds for a low frequency tone. This affects our sensitivity to harmonic distortion, as the shorter the duration of time a sound lasts, the more difficult it is to distinguish what we are hearing. As an example, one study found that it took a 10% level of distortion for listeners to perceive distortion in a 4 millisecond tone. However, when that tone was lengthened to 20 milliseconds, the perceptible level of distortion was lowered to 0.3%. Considering the transient nature of most of the content we typically listen to, this phenomenon is bound to mask far more distortion than what we would hear in more atypical steady state sounds.
One more factor that can make it more difficult to detect distortion is personal familiarity and understanding of the intended reproduction. For example, most people know what a middle C note of a piano is supposed to sound like, but how many people know what a fist fight between two robots from another world is supposed to sound like? Furthermore, the timbre of musical instruments are heavily defined by the harmonic resonances of the instrument’s fundamental, and these resonances typically occur at even order harmonics, which is considered musical since an even order harmonic is always the same note in an upper octave. These even-ordered harmonic resonances of musical instruments can make the detection of even ordered harmonic distortions very difficult, since they are ‘tuned’ to the instrument’s fundamental. On the other hand, this fact makes odd-order harmonic distortion a bit easier to hear since the frequency of that distortion doesn’t cleanly relate to the fundamental, at least in the scale of conventional musical notation. In other words, it’s easier to detect ‘off’ components in a sound we are familiar with. If we have no reference by which to judge the sound, we have no way to know if what we are hearing is apart of the input signal or a distortion in the output. To tie this into the previous discussion, one test showed that even trained listeners were not able to identify as much as 30% distortion peaks from material which had a dense spectra with a high amount of transients and synthesized sounds.
Why Use Test Tones for Distortion Audibility Tests?
 So if test tones are so removed from
ordinary listening content, why use them to test the audibility of distortion?
One reason is they are simply the worst case scenario for audible distortion as
far as content goes, and if your transducer can perform well in
worst-case-scenario conditions then they are much more likely to handle more
complex “audibly forgiving” content that much better, so one can think of such
testing as “sound quality insurance.” There is media content approaching the
simplicity of simple sine waves, although there isn’t much of it. The speaker
or subwoofer that can accurately reproduce that content demonstrates a higher
performance ability than those that cannot.
So if test tones are so removed from
ordinary listening content, why use them to test the audibility of distortion?
One reason is they are simply the worst case scenario for audible distortion as
far as content goes, and if your transducer can perform well in
worst-case-scenario conditions then they are much more likely to handle more
complex “audibly forgiving” content that much better, so one can think of such
testing as “sound quality insurance.” There is media content approaching the
simplicity of simple sine waves, although there isn’t much of it. The speaker
or subwoofer that can accurately reproduce that content demonstrates a higher
performance ability than those that cannot.
Another reason single frequency tones are used for sound quality testing is because they are an easy and well-established way to test speakers. The testing procedure is very simple, easily duplicated and the results are easy and clear to read. One problem with testing with ‘real world’ content, such as movies or speech, is that determining the test content would be extremely difficult, as there are all kinds of criteria by which to determine what should be used as the test signal. Also, one would need a computer with sophisticated software to analyze the results, unlike the clarity of the resulting spectra that a single tone produces.
There are metrics that have been formed to assess distortion which have demonstrated a better correlation of human perception to audible distortion such as the GedLee Metric and the Rnonlin Metric. These methods try to reconcile the modern understanding of psychoacoustics with objective measurements to produce measurements which indicate the severity and audibility of distortion to human perception. However, they are somewhat complicated and have not achieved popular use in the audio industry. It should be noted that any metric that can measure the perceptibility of distortion must necessarily be complicated, as it is measuring the interactions of several immensely complex systems: the physics of sound, the physiological structure of the ear and auditory system, and the psychological processing of the brain.
Intermodulation Distortion: Can it Predict Good Bass Performance in Subwoofers?
One other major nonlinear distortion we will discuss is called intermodulation distortion. Like harmonic distortion, it will be present in all speakers, but at what point does it become audible in bass frequencies?
Before we try to answer that question, let’s define it. As we have seen with harmonic distortion, a single tone can interact with the transducer to produce multiple tones in the output. Intermodulation distortion is when multiple input tones interact with each other in the transducer to produce many more tones in the output. The additional tones generated by intermodulation distortion are not harmonically related to the fundamentals. Instead the distortions are frequencies that are the sum and differences of the fundamentals and the multiples of those sums and differences. This is illustrated in Figures 14a and 14b:
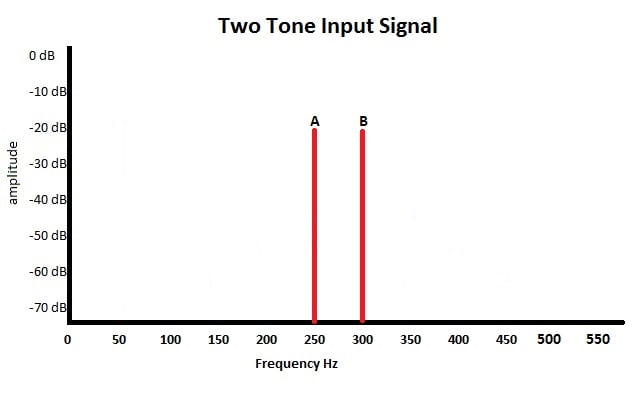
Figure 14a: Two tone input signal
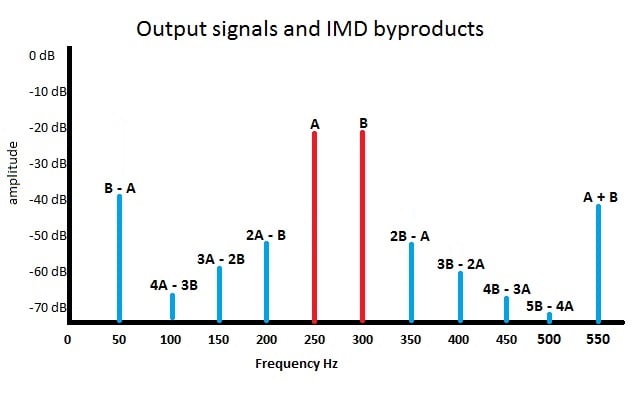
Fig. 14b. Intermodulation products and their frequency values relative to the fundamentals
Like harmonic distortion, intermodulation distortion is measured as a percentage, but as with the THD percentage, the percentage of intermodulation distortion may not be very meaningful with respect to audibility. Usually the amount of intermodulation distortion is proportional to the amount of harmonic distortion, with their relative values depending on the ratio of the amplitudes of the test signals. The tones used to test intermodulation distortion will also generate harmonic distortion, and it is possible for a speaker to exhibit low harmonic distortion but still generate high levels of intermodulation distortion. The amount of intermodulation distortion generated depends on the density of the input spectra. As the input signal becomes more complex the intermodulation distortion becomes greater, and this can be seen of a speaker measurement in Figure 15, where hundreds if not thousands of spectral distortion components are generated from a handful of input frequencies in a multi-tone burst. As with harmonic distortion, those intermodulation products closest in frequency to the fundamental are the most likely to be masked. Unlike harmonic distortion, intermodulation distortion products can be spread further out over the frequency spectrum and therefore may not be masked as well, so intermodulation distortion is potentially more audible than harmonic distortion.
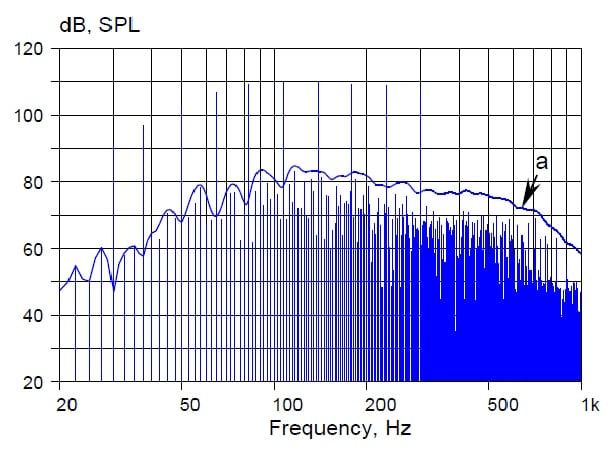
Fig. 15. Spectrum of multi-tone burst and nonlinear distortion byproducts (a). Reprinted by permission of the AES.
While some studies have shown that human perception is extremely sensitive to intermodulation distortion for much of the spectrum of human hearing, the audibility of intermodulation distortion in low frequencies was thought to be equal or less than that of harmonic distortion by Fielder and Benjamin in their research. Their reasoning was that the intermodulation difference products would be masked by the effects of the critical band in the lowest 100 Hz bandwidth of hearing, which, as we described before, would be dominated by the fundamental in that range. As for the sum intermodulation products, they would be no more audible than the harmonic distortion products by virtue of necessarily being less in amplitude, since the energy of intermodulation distortion is spread out more rather than concentrated in certain frequencies. For these reasons, they did not attempt to run tests on the audibility of intermodulation distortion in low frequencies. Subwoofer reviewer and tester Ilkka Rissanen, who is perhaps the only subwoofer tester to have released IMD measurements of tested subwoofers (seen on this page), commented that subwoofers with low THD levels also had low intermodulation distortion levels. Regarding audibility, he said there were clear audible differences between the best and worst performers from the subwoofers that he tested.
A Quixotic Quest
If you read this article in the hope of being able to identify exactly when your subwoofer or bass driver is beginning to markedly alter the sound through distortion, you will undoubtedly be disappointed. The only hard numbers that exist for levels at which humans could just begin to detect distortion were reprinted in table 2, and those were only for sine wave tones in a laboratory condition from listening subjects who had healthy hearing. Chances are, your listening environment isn’t quite as controlled, and your choice of listening content is a bit more complex, and, if you are a bit older, your hearing might not be as acute. In other words, those numbers are not the performance targets you should sweat over if you want pristine bass sound quality. Your sense of hearing is likely to tolerate far more distortion before you would ever notice than those numbers would indicate. In order to find ‘just detectable levels’ of distortion in normal listening content such as music would require one to be intimately familiar with the recording or be able to switch between a non-distorting version of that recording faster than aural memory can fade, which may be as brief as three to four seconds.
However, this isn’t to say the problem of understanding the thresholds of identifiable distortion in these low frequencies is so intractable that it isn’t worth attempting to solve. Distortion does occur, and it does change the sound from what was originally intended by the artist. By identifying the point at which distortion becomes audible, effort can be more sensibly invested in reducing it there, instead of wasted in reducing it where it is already beyond the limit of human perceptibility.
References
Ahonen, Jukka, et al. "Perception and physical behavior of loudspeaker nonlinearities at bass frequencies in closed vs. reflex enclosures." Audio Engineering Society Convention 124. Audio Engineering Society, 2008.
Czerwinski E., Voishvillo A., Alexandrov S., and Terekhov A.: Multitone Testing of Sound Systems - Some Results and Conclusions, Part 1: History and Theory, J. Audio Eng. Soc., vol. 49, No. 11, pp. 10111027, (2001, November).
Fielder, Louis D., and Eric M. Benjamin. "Subwoofer performance for accurate reproduction of music." Journal of the Audio Engineering Society 36.6 (1988): 443-456.
Geddes, Earl R., and Lidia W. Lee. Audio Transducers. GedLee, 2002.
Geddes, Earl R., and Lidia W. Lee. "Audibility of linear distortion with variations in sound pressure level and group delay." Audio Engineering Society Convention 121. Audio Engineering Society, 2006.
Gunnarsson, Viktor. Assessment of nonlinearities in loudspeakers: volume dependent equalization. Chalmers University of Technology.
Harwood, H. D. "Loudspeaker Distortion with Low-Frequency Signals." Journal of the Audio Engineering Society 20.9 (1972): 718-728.
J. Moir, "Just Detectable Distortion", Wireless World, vol. 87, no. 1541, Feb. 1981.
Klippel, Wolfgang. "Speaker auralization-Subjective evaluation of nonlinear distortion." PREPRINTS-AUDIO ENGINEERING SOCIETY (2001).
Klippel, Wolfgang. "Nonlinear large-signal behavior of electrodynamic loudspeakers at low frequencies." Journal of the Audio Engineering Society 40.6 (1992): 483-496.
Klippel, Wolfgang. "Loudspeaker Nonlinearities–Causes, Parameters, Symptoms." Audio Engineering Society Convention 119. Audio Engineering Society, 2005.
Klippel, Wolfgang, and Robert Werner. "Loudspeaker Distortion–Measurement and Perception."
Mitchell, Peter W. "The Measure of Bass Quality" Stereo Review, December 1995, pg 144.
de Santis, M. E., and Simon Henin. "Perception & thresholds of nonlinear distortion using complex signals." Section of Acoustics, Institute of Electronic Systems, Aalborg University (2007).
Schmitt, R. Audibility of nonlinear loudspeaker distortion. Journal of the Audio Engineering
Society, 43(11):402, May 1995.
Temme, Steve, et al. "The Correlation between Distortion Audibility and Listener Preference in Headphones." Audio Engineering Society Convention 137. Audio Engineering Society, 2014.
Voishvillo, Alex. "Measurements and Perception of Nonlinear Distortion—Comparing Numbers and Sound Quality." Audio Engineering Society Convention 123. Audio Engineering Society, 2007.
Voishvillo, Alex. "Assessment of Nonlinearity in Transducers and Sound Systems–from THD to Perceptual Models." Audio Engineering Society Convention 121. Audio Engineering Society, 2006.
Voishvillo, Alexander, et al. "Graphing, interpretation, and comparison of results of loudspeaker nonlinear distortion measurements." Journal of the Audio Engineering Society 52.4 (2004): 332-357.
Voishvillo, Alexander, et al “Measurement of Loudspeaker Large Signal Performance - Comparison of Short-Term Testing Signals” Audio Engineering Society (2002).
James Larson is Audioholics' primary loudspeaker and subwoofer reviewer on account of his deep knowledge of loudspeaker functioning and performance and also his overall enthusiasm toward moving the state of audio science forward.
View full profile