
Understanding Loudspeaker Review Measurements Part I
Understanding Loudspeaker Review Measurements
Over the last couple of years, Audioholics’ speaker reviews have contained measurement graphs that have prompted questions from many readers about the meaning and importance of the information displayed in them. Some readers have found the information in them confusing, and that is our fault for not recognizing how cryptic these sort of representations are for an average reader. It can be easy to take these sorts of data visualizations for granted when one spends so much time dealing with the minutiae of loudspeaker behavior, and that can sometimes lead us to assume too much knowledge on behalf of the reader, especially novices to the audio hobby. We do have some articles that explain the information displayed in some of our graphs (see the links at the end of this article), but we have decided that something simpler is needed to help out those who aren’t already knee-deep in this hobby, as prior articles dealing with this were rather technical. Since loudspeaker measurements are an inherently technical matter, it can be a bit challenging to state these concepts in much simpler terms, but we will try nonetheless.
Frequency Response
Let’s
start our expla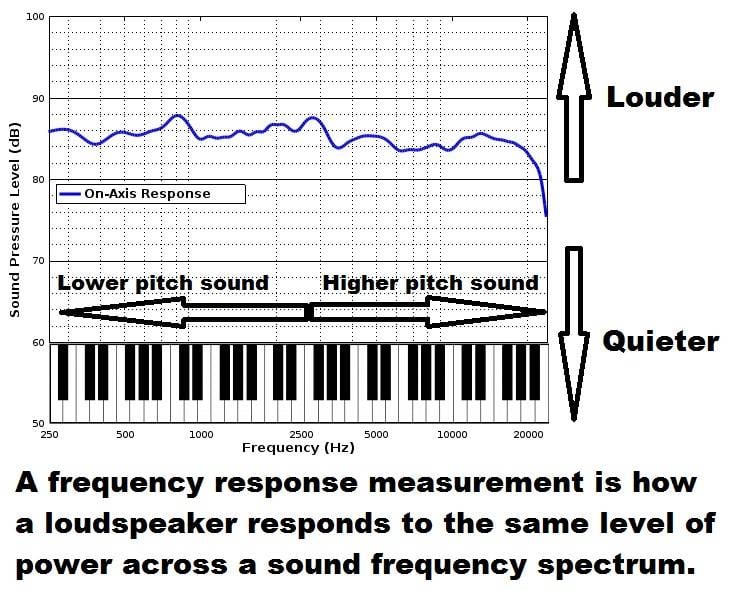 nations of loudspeaker measurement graphs with the most basic
graph of a speaker’s behavior: the frequency response. Sometimes this is
referred to as the amplitude response as well.
Frequency response is a measure of how a speaker responds throughout the
sound frequency spectrum for the same amount of amplification. The x-axis of a frequency
response graph represents frequency, or what we hear as pitch, and the Y-axis
of the graph represents amplitude, or what we hear as loudness. An analogy
would be how loud the keys on a piano sound when struck with the same force.
Similar to how the pitch moves upward from left to right on a piano keyboard, a
frequency response graph normally starts with low-frequency sound on the left
side of the graph and raises in pitch to higher frequencies as it moves to the
right. Ideally, a piano would play all of these notes at the same loudness when
the keys are struck with the same force. Likewise, a perfectly behaving
loudspeaker would have a totally even response throughout its frequency
spectrum when given the same amount of amplification for all frequencies. We
would call that perfect response ‘flat’ since, on a frequency response graph,
it would appear as a flat line across all frequencies. A loudspeaker with a
perfect frequency response is impossible to achieve in reality, but many
speaker manufacturers try to get as close as they are reasonably able.
nations of loudspeaker measurement graphs with the most basic
graph of a speaker’s behavior: the frequency response. Sometimes this is
referred to as the amplitude response as well.
Frequency response is a measure of how a speaker responds throughout the
sound frequency spectrum for the same amount of amplification. The x-axis of a frequency
response graph represents frequency, or what we hear as pitch, and the Y-axis
of the graph represents amplitude, or what we hear as loudness. An analogy
would be how loud the keys on a piano sound when struck with the same force.
Similar to how the pitch moves upward from left to right on a piano keyboard, a
frequency response graph normally starts with low-frequency sound on the left
side of the graph and raises in pitch to higher frequencies as it moves to the
right. Ideally, a piano would play all of these notes at the same loudness when
the keys are struck with the same force. Likewise, a perfectly behaving
loudspeaker would have a totally even response throughout its frequency
spectrum when given the same amount of amplification for all frequencies. We
would call that perfect response ‘flat’ since, on a frequency response graph,
it would appear as a flat line across all frequencies. A loudspeaker with a
perfect frequency response is impossible to achieve in reality, but many
speaker manufacturers try to get as close as they are reasonably able.
On-Axis Frequency Response

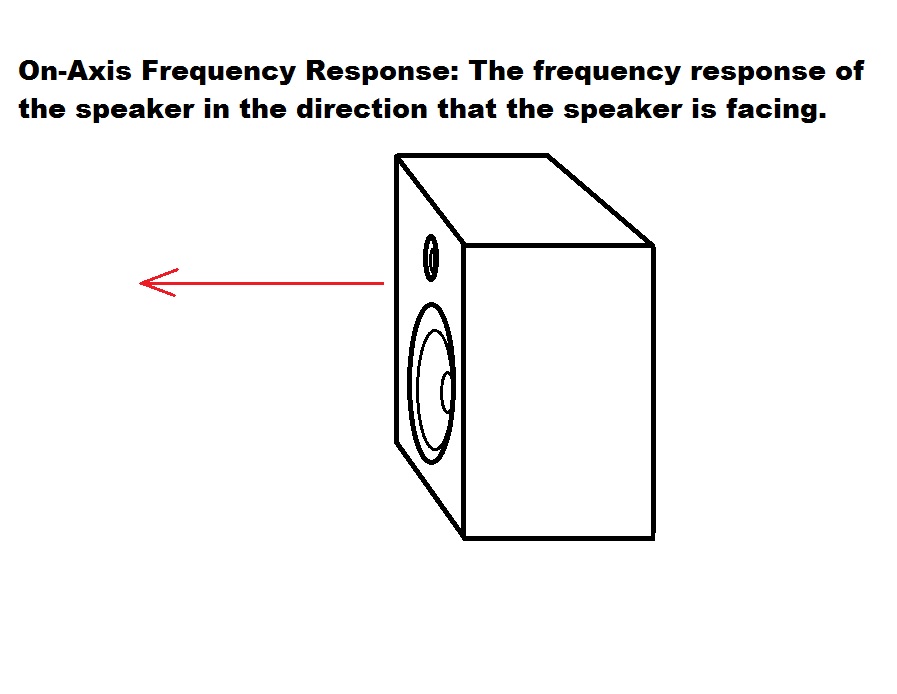
An on-axis frequency response (sometimes called the direct axis frequency response, but hereafter I will call it the on-axis frequency response) is the frequency response of the sound that is directly in front of the speaker, so it is the speaker’s response in the direction in which it is pointing at, i.e, the speaker’s ‘aim.’ It has to be considered the primary measurement of a speaker’s behavior. If the speaker is aimed directly at the listener, it would arguably be the most important single response measurement, since, of all the sound that the speaker is radiating would be what would arrive at the listener first. The first arrival of sound is a major determinant of the loudspeaker’s character for the listener. However, it is not always the case that the speaker will be pointed directly at the listener; listeners frequently end up listening to the speaker at a different angle. Every other angle of a loudspeaker’s frequency response is called an off-axis frequency response.
As was mentioned before, the most ideal measurement of an on-axis frequency response is one that is totally flat, but again, that isn’t a real-world, so the shape to look for is as flat of a response curve as possible- at least if you are interested in accuracy. A theoretical speaker that had a totally flat on-axis frequency response would indicate that it is able to reproduce the source content with perfect accuracy, at least for the position directly ahead of it. The further that the frequency response curve deviates from a flat shape, the less accurate the speaker is.
Off-Axis Frequency Responses
If the loudspeaker is not aimed directly at you as a listener, you are listening to it at an off-axis angle which usually has a different frequency response shape than the on-axis frequency response. For the sake of accuracy, off-axis responses should hold a flat shape too, naturally, but, as with the on-axis frequency response, that is an impossibility, so speaker designers normally try to have a smooth response that has a tight correlation to the on-axis frequency response. There are two major reasons for this. First, many times listeners will not be listening to the speaker at an angle that is directly in front of it, so the speaker should try to sound good at other reasonable angles. Second, most of what we hear in-room is reflected sound from the loudspeaker and not just the sound coming directly from the speaker to the listener’s ear. Therefore, even if the direct on-axis sound was perfectly accurate, the speaker can still sound bad if sound emitted at other angles have a very poor frequency response. Let’s now look at some graphs that involve both on-axis and off-axis responses...
Listening Window
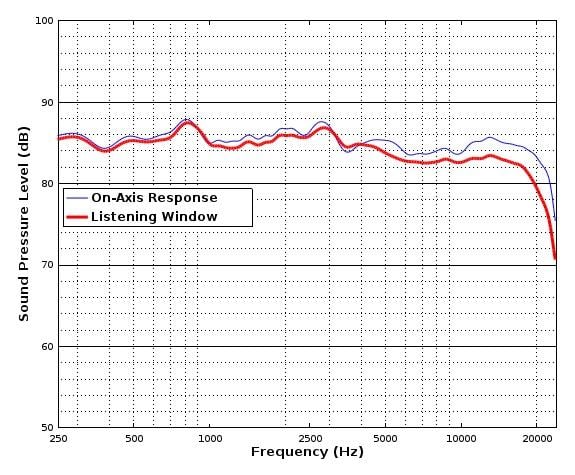
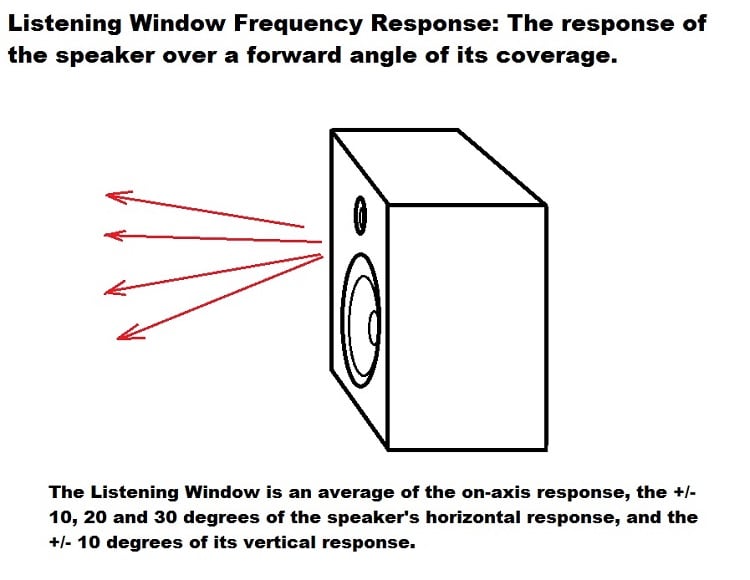
Generally, the most important off-axis angles that a speaker should hold a good response are those angles that are close to the on-axis angle, and the most important of these near on-axis angles are those that are on a horizontal plane to the on-axis angle. These angles are the most important because most people don’t listen to their speakers at far off angles, and they tend to listen to their speakers at significantly different lateral angles but not significantly different vertical angles. For example, a listening area might be comprised of a wide sofa or sectional, so it will be a broad area horizontally, but rarely do people listen to their speakers at a substantially higher or lower angle, so potential listening positions tend to occupy a narrow vertical region.
A single measure of the responses that occur at and near the on-axis response is called the ‘listening window.’ The listening window curve is an average of horizontal responses at +/- 10, 20, and 30 degrees on the horizontal axis, and +/- 10 degrees on the vertical axis. It encompasses most of the area in which listeners would ever typically listen. The significance of the listening window response is that it will resemble the response that arrives at the listener's ears first, since most people will be listening within this angle with respect to the speaker. In other words, so long as the listener is in a reasonable area of the speaker’s forward coverage, which is a 60-degree angle in front of the speaker, the response of the first arrival of sound from the speaker should resemble the listening window curve. As we have previously stated, the first arrival of sound is a major determinant of the loudspeaker’s character for the listener.
Early Reflections
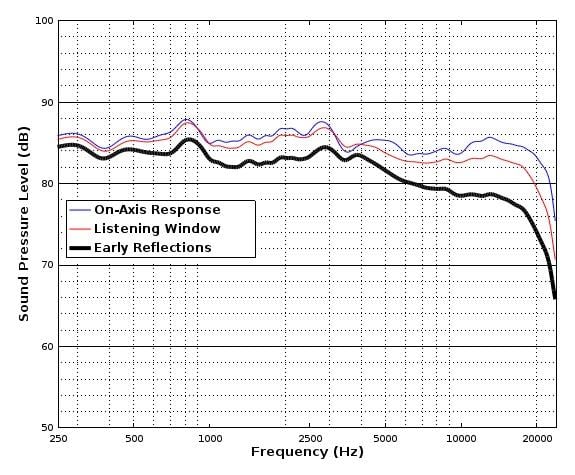
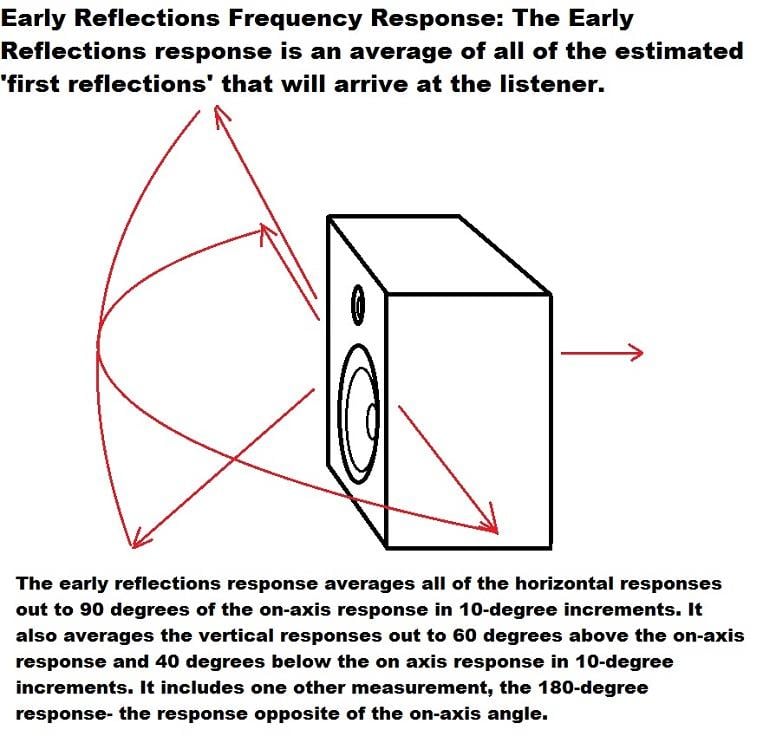
We mentioned before that much of what we hear from a typical home audio sound system is not direct sound from the speakers themselves but reflected sound from surfaces in the room such as walls, tables, floors, and pretty much any solid object. The strongest of these reflections are early reflections, which have only had a single ‘bounce’ off of a room surface before hitting the area of the predicted listening position. These early reflections are important because, if their cumulative response is very uneven compared to the direct sound response of the speaker, they can harm the overall sound quality of the system. Early reflections are a dominating factor in the in-room frequency response in lower and midrange frequencies. They make a big difference in determining the tonal balance of a loudspeaker in a typical home audio setup.
These early reflections have a measurement that exhibits their overall behavior: the ‘early reflections’ response. Most of the sound that comprises the early reflections predominately comes from the front half of the speaker, so the early reflections curve is average of much of the vertical and all of the horizontal axial responses from the front hemisphere of the speaker. The early reflections curve is almost always a bit lower in amplitude than the listening window response curve or on-axis frequency response curve, because the early reflections response incorporates responses from far off-axis angles, where normal loudspeakers are not projecting nearly as much acoustic energy as the area right in front of it. This will usually cause a downward tilt in the response as the frequency goes up. In this metric, a highly accurate loudspeaker should have a steady line as a curve that resembles its on-axis response. Such a curve would mean that the sound produced at most angles around the speaker has a good correlation to the on-axis and listening window responses. If there are very large dips or peaks in the early reflections response, that can make for a tonally unbalanced sound.
Sound Power
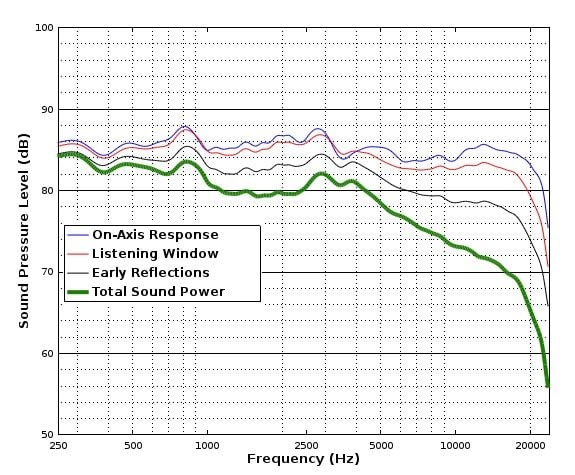
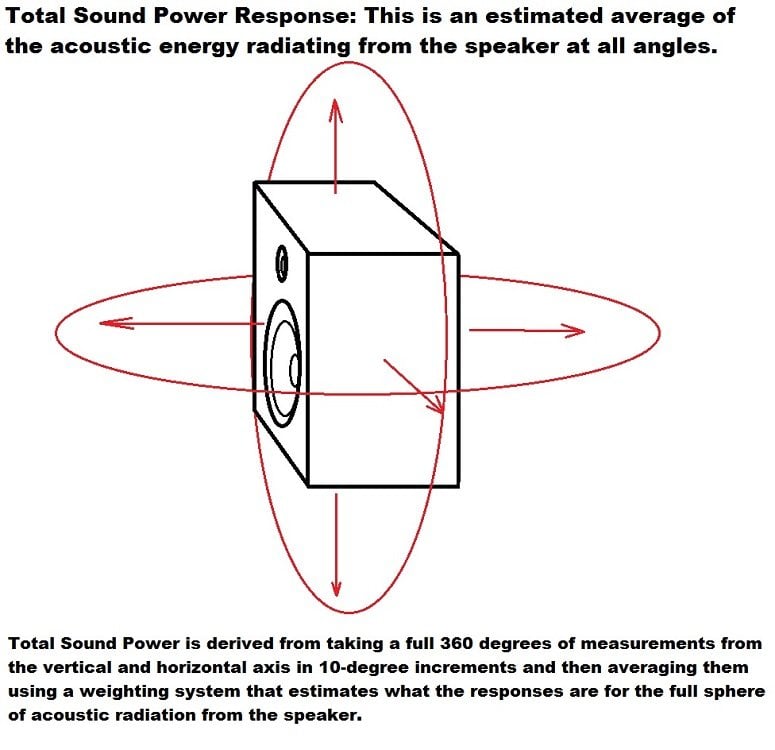
The sound that the speaker produces at all angles is summarized by the ‘sound power’ curve. The sound power response is a frequency response of all of the acoustic energy radiating from the speaker from every direction. In itself, it isn’t a great guide of sound quality, because much of the information that it incorporates isn’t very important, such as off-axis angles well behind the speaker that do not normally have much output and thus does not affect the listener very much. If this curve is extremely bumpy, that can indicate a problem, but readers are advised not to read too much into this response. For regular home audio users, it would only be useful as a predictor of an in-room response in mid-bass and upper-bass frequency bands. It is more useful as a piece of data from which we can derive the directivity indexes that are discussed below.
Sound Power Directivity Index
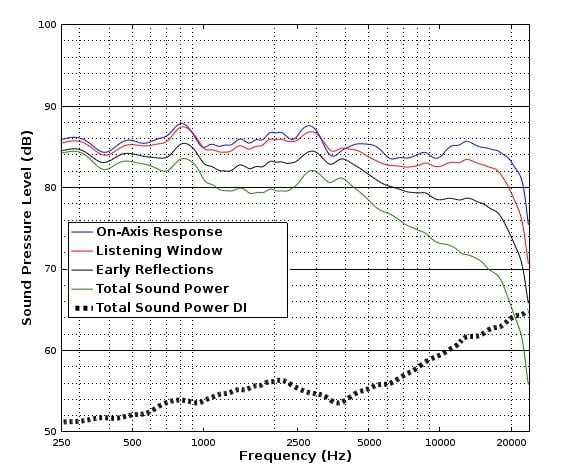
The sound power directivity index does not represent a conventional frequency response that simply shows the loudspeaker’s amplitude over frequency. Instead, it represents how much acoustic energy the speaker projects in a forward direction versus energy radiated in all directions. In other words, the sound power directivity index (normally just called the ‘DI’ or ‘directivity index’ which is how we will refer to it hereafter) is a measure of how directional the speaker’s sound emission is. A highly directional speaker is one where the sound emission is contained in a narrow beam. It projects sound outward in a very narrow angle, so anyone who is not near the on-axis angle for the speaker will not be exposed to much direct sound from the speaker. A highly non-directional speaker will project sound evenly over at a very wide angle. To give some hypothetical examples, a totally directional speaker would emit all of its acoustic energy in a single direction like a laser beam, whereas a totally non-directional speaker would emit sound equally in all directions like a spherical light bulb (that would be the ideal of a true omnipolar speaker).
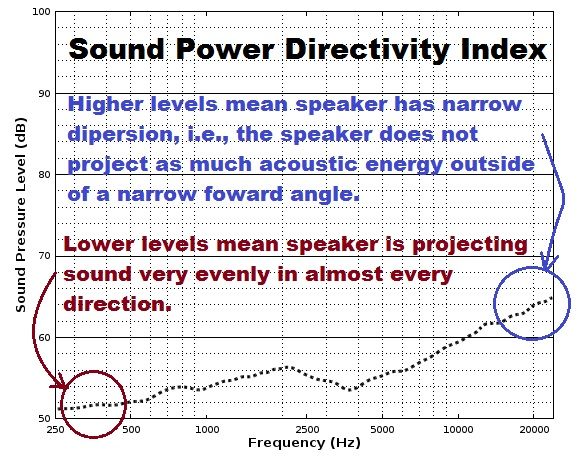
The directivity index is established by subtracting the sound power response from the listening window response, and the resulting curve shows us how much forward bias the speaker has, or a ratio of its forward-directed energy versus its omnidirectional energy per frequency. In this metric, a totally non-directional speaker would have a value of zero dB for the entirety of its frequency response, since there would be no difference in the energy projected from any particular direction. In other words, the amplitude measured in the listening window response is no different from that in the sound power response; those two responses would have identical curves, so they would cancel out. A highly directional speaker that radiates all of its energy in a forward direction, on the other hand, would have a directivity index that would be very elevated and would be nearly identical in amplitude and shape to the listening window curve. Therefore, when a directivity index has higher amplitude levels at some frequency band, it is more directional in that frequency band and projects more of its sound in a single direction as opposed to a wide direction angle.
So what does a directivity index curve mean in terms of sound quality? One desirable trait for the directivity index is that it should be free of wild swings in amplitude. A very rocky directivity index would indicate that different frequency bands have greatly differing angles of dispersion, or, to put it another way, some ranges of sound would have much greater off-axis energy than others. As we said before, since much of what we hear in-room is reflections from off-axis acoustic energy, an erratic directivity index would make for an uneven sound character. Beyond having a semi-flattish directivity index, the desired level of directivity gets into more situational applications. A lower level of directivity can be an advantage, for example, in instances where the listening area is very broad so that the speaker needs to provide a wide angle of coverage so everyone hears a full sound. In other circumstances, an elevated directivity index can be an advantage, where a narrow dispersion pattern is useful, such as instances where a greater control of the sound path is needed. An example of where high directivity can be an advantage is in rooms that are large and acoustically lively.
As for the qualitative differences between a highly directional speaker and a more non-directional speaker, research done by Canada’s National Research Council (aka. NRC) hints that most people seem to prefer the sound of wide dispersion loudspeakers because the sidewall reflections add a sense of spaciousness and a wider soundstage.1 There was some evidence to suggest that wide dispersion loudspeakers do sacrifice some precision in stereo imaging in order to achieve their greater sense of ambiance, though conclusive research is not in at this time. Ultimately, this would appear to be a matter of personal preference; those who want a greater sense of spaciousness should look for speakers with a low directivity index, and those who want more precise imaging should look for a high directivity index. It should be noted at this point that room acoustics and speaker placement will have a major role to play in these qualities as well. In my own experience, I have found that both wide dispersion speakers and narrow dispersion speakers can have excellent imaging as well as a sense of spaciousness and ambiance.
Early Reflections Directivity Index
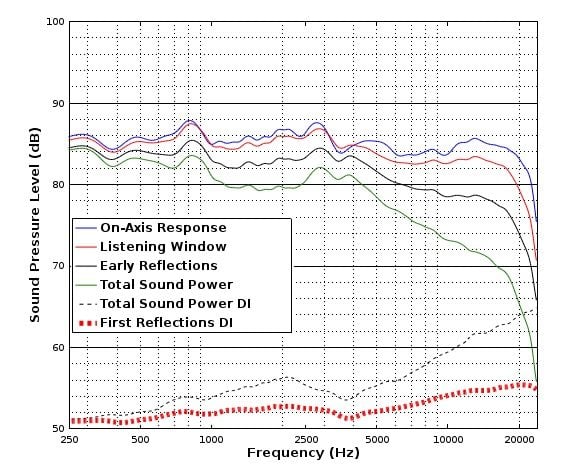
For conventional loudspeakers, what might be more important and meaningful than the sound power directivity index is the ‘early reflections directivity index’ (or early reflections DI). The early reflection directivity index is a curve that shows how directional the speaker’s acoustic energy is among angles that will produce first reflections. It is a ratio of energy from the early reflections measurement that is directional. It is calculated by subtracting the early reflections response from the listening window response. A shortcoming of the sound power directivity index is it factors in a significant amount of data that is relatively unimportant in standard loudspeakers, namely the acoustic energy emitted from the rear hemisphere of the speaker. However, most speakers are forward-firing designs, which means they project most of their sound in a single, forward direction (these are often mislabeled as ‘monopole’ speakers, but a monopole is more precisely a point source radiating equally in all directions, which is not how forward-firing speakers behave).
As with the sound power directivity index, a desired characteristic to look for in the early reflections directivity index is a smooth curve that does not have any large irregularities or isn’t very ‘lumpy’ and uneven. Similar to the sound power directivity index, an elevated early reflections directivity index indicates a very directional, narrow dispersion speaker and a low early reflections directivity index indicates a wide dispersion speaker.
The ANSI/CTA-2034-A Standard, Also Known As ‘Spin-O-Rama’
 The
six measurements discussed above are displayed together as a group that is
known as the ‘Spin-O-Rama’ measurement set, which was developed by Harman
International. It is called Spin-O-Rama because it involves rotating the
speaker 360-degrees on both its vertical and horizontal axes to gain the
necessary data to develop the measurement set. A frequency response measurement
is taken every 10-degrees on the complete vertical and horizontal axes, and the
Spin-O-Rama curves are calculated from all of those measurements. The science
used to establish this measurement set as a guide to loudspeaker performance
has been held in such high esteem that the American National Standards
Institute(aka. ANSI) and the Consumer Technology Association (aka. CTA) have incorporated it into
their standard for measuring home audio loudspeakers. This standard is known as
ANSI/CTA-2034-A.
The
six measurements discussed above are displayed together as a group that is
known as the ‘Spin-O-Rama’ measurement set, which was developed by Harman
International. It is called Spin-O-Rama because it involves rotating the
speaker 360-degrees on both its vertical and horizontal axes to gain the
necessary data to develop the measurement set. A frequency response measurement
is taken every 10-degrees on the complete vertical and horizontal axes, and the
Spin-O-Rama curves are calculated from all of those measurements. The science
used to establish this measurement set as a guide to loudspeaker performance
has been held in such high esteem that the American National Standards
Institute(aka. ANSI) and the Consumer Technology Association (aka. CTA) have incorporated it into
their standard for measuring home audio loudspeakers. This standard is known as
ANSI/CTA-2034-A.
There is a lot more in interpreting these measurements than what has been written here, but hopefully, this article has given you a good start in understanding what this set of response curves mean. If you want to learn more, Audioholics has this article: Objective Loudspeaker Measurements to Predict Subjective Preferences, which touches on these measurements as well. Some other good resources for learning more about the Spin-O-Rama curves are these white papers from Harman International: Audio Science in the Service of Art and Loudspeakers and Rooms for Multichannel Audio Reproduction, Part 2. The very best source for understanding the meaning of these measurements is the book Sound Reproduction: Psychoacoustics of Loudspeakers and Rooms, by Dr. Floyd Toole. Sound Reproduction is a great resource for anyone just getting into audio as a hobby as well as those who have been an audio enthusiast for many decades.
For those who take the time to understand the meaning of the Spin-O-Rama measurement set, the knowledge will go a very long way in identifying the traits of a well-engineered loudspeaker. This knowledge can be very useful for anyone getting into this hobby, because there are so many good speaker designs that sadly aren’t available to many people to demo locally, so these measurements can indicate the type of sound character that a speaker has without having to hear it in person. These measurements also serve as a good guide for those who simply want an accurate loudspeaker instead of one with ‘personality.’ Audioholics publishes these measurements in our reviews of bookshelf speakers, and, as far as we know, we are the ONLY third-party publication to do so. Hopefully, other publications will follow our lead, so audio consumers can have a greater understanding of loudspeaker performance and pick the right speaker for the job.
Learn about Waterfall and Polar Plots in: Understanding Loudspeaker Review Measurements Part II
1Toole, Floyd E. "Loudspeaker measurements and their relationship to listener preferences: Part 2." Journal of the Audio Engineering Society 34.5 (1986): 323-348. PDF
Toole, Floyd E. “Sound Reproduction: The Acoustics and Psychoacoustics of Loudspeakers and Rooms”, Third Edition, Focal Press, 2017.
- Audio Measurements: The Useful vs. the Bogus in Consumer Audio
- Loudspeaker Measurements Standard: Our Procedure for Objectively Analyzing Speaker Performance
- Sound Reproduction: Psychoacoustics of Loudspeakers and Rooms
- Understanding Loudspeaker Review Measurements Part II
- Understanding Subwoofer Review Distortion Measurements Part III
James Larson is Audioholics' primary loudspeaker and subwoofer reviewer on account of his deep knowledge of loudspeaker functioning and performance and also his overall enthusiasm toward moving the state of audio science forward.
View full profile