
Audiologic Schumakubins Loudspeaker Review
- Product Name: Audiologic Schumakubins Loudspeaker Review
- Manufacturer: The Audiologic
- Performance Rating:

- Value Rating:

- Review Date: May 07, 2008 17:39
- MSRP: $ 30 to $670
- 32Hz (vented) or 50Hz (sealed) - 20KHz
- Anechoic sensitivity 84dB/2.83V
- 6 Ohm load nominal
- Crossover 1500Hz
- Max 50Hz SPL, 103dB Excursion limited
- Max 100Hz SPL, 112dB Power limited
Pros
- Excellent imaging and sound stage
- Narrow front baffle
- Good value as a kit
Cons
- Completed cabinets not really complete
Introduction
As a Do-it-yourself speaker builder I have found myself wondering many times as I perused the internet’s vast sea of home speaker builder’s selections as to what some of the DIY speaker kits would sound like. I finally had the opportunity to do exactly that with The Audiologic Schumakubins. The Schumakubins are not just another DIY speaker from a home speaker builder. They are available in various kit options. First, let me give a little background about the designer and how these speakers ended up in my Reference System for review. The designer, Pete Schumacher, is someone I met many years ago as a work acquaintance. Pete and I used to discuss speaker building among other topics and we quickly became friends. In fact he is the person that sparked my interest in the Dynaudio drivers that have ended up as my main speakers which I like so much. Gene still likes to poke fun at me for my fondness of my own design. Well Pete and I only worked together for a few years before we departed the company which we were working and he moved out of state. I thought about Pete over the years because of our discussions and the hospitality that he and his family offered back then, wondering what he had been up to. About 15 years later, I was looking through the Parts Express speaker forum where I saw Pete’s name and I knew there could only be one Pete Schumacher interested in speaker building. I contacted him and we quickly became reacquainted and we have been in contact with one another for a couple of years now. One of the strange things in our absence was that we independently had designed and built very similar speakers. We have discussed many projects over the last couple of years and in that course Pete was contacted by The Audiologic company to design a kit for them. The speakers were basically born from a request on the PE forum from Rudy Jakubin. As I understand it Rudy had a lot of the Dayton woofers and he posted a request on the PE forum asking if anyone had a design for these woofers. Well Pete spends most of his life on these forums and since he had been working a lot with the crossover design software he offered to design the speaker with a SEAS tweeter but then decided to go with a Dayton tweeter. Jordan Roy from The Audiologic saw these posts and asked if Pete would like to make his designs available to the public via a kit. Hence, the Schumakubins were born.
Description and Inspection
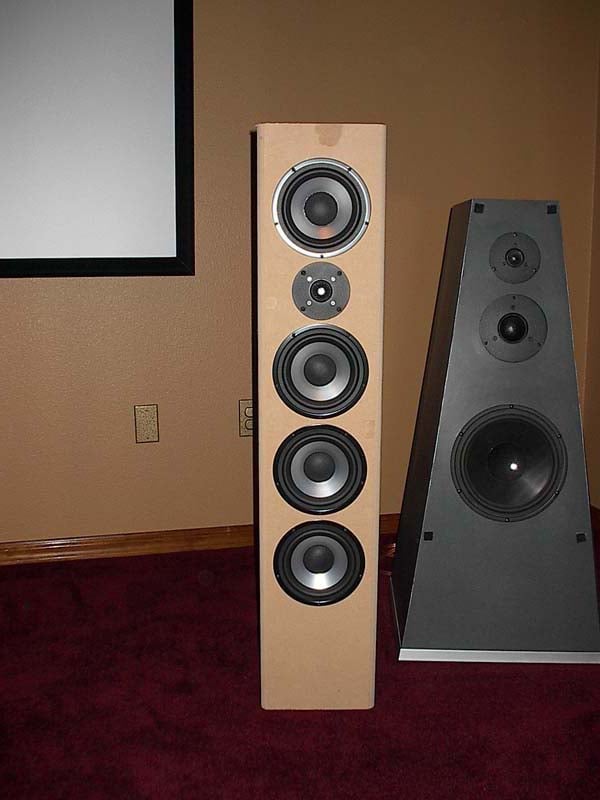
 The Schumakubins
are a floor standing speaker with a WTWWW (woofer-tweeter-woofer-woofer-woofer)
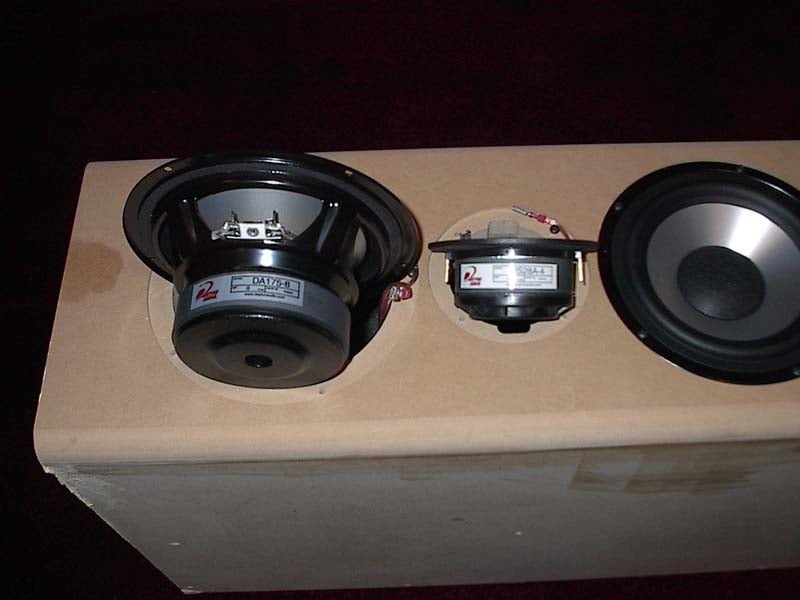
configuration. The four 7 inch woofers and the 1” dome tweeter are aluminum
from Dayton
which is a Parts Express only brand.
They are all fairly low cost drivers and in the past I personally would
not have considered them but once I saw the distortion plots for these drivers
I was very impressed. The tweeter is from the Dayton Reference Series but the
woofer is not. In fact the woofer is only made from a stamped frame meaning it
is not as rigid as more expensive cast aluminum frame drivers. This system is a
2.5 way design where the lower two woofers are the .5 way. They are cut off at
a lower frequency than the upper two and are used to compensate for baffle step
loss (when the wave front goes from half space to full space). This
techno-babble translates to a smoother overall bass response. The crossovers
were designed using free software that was written in an Excel spreadsheet. I
have personally started experimenting with this software and it seems fairly
robust. To use it you need a pretty good understanding of each crossover
section. Pete has used it for
several of his own designs and other DIYers via the forums. I have comparisons
with the modeled plots and the actual measurements which you can see at the end
of this article.
The Schumakubins
are a floor standing speaker with a WTWWW (woofer-tweeter-woofer-woofer-woofer)
configuration. The four 7 inch woofers and the 1” dome tweeter are aluminum
from Dayton
which is a Parts Express only brand.
They are all fairly low cost drivers and in the past I personally would
not have considered them but once I saw the distortion plots for these drivers
I was very impressed. The tweeter is from the Dayton Reference Series but the
woofer is not. In fact the woofer is only made from a stamped frame meaning it
is not as rigid as more expensive cast aluminum frame drivers. This system is a
2.5 way design where the lower two woofers are the .5 way. They are cut off at
a lower frequency than the upper two and are used to compensate for baffle step
loss (when the wave front goes from half space to full space). This
techno-babble translates to a smoother overall bass response. The crossovers
were designed using free software that was written in an Excel spreadsheet. I
have personally started experimenting with this software and it seems fairly
robust. To use it you need a pretty good understanding of each crossover
section. Pete has used it for
several of his own designs and other DIYers via the forums. I have comparisons
with the modeled plots and the actual measurements which you can see at the end
of this article.
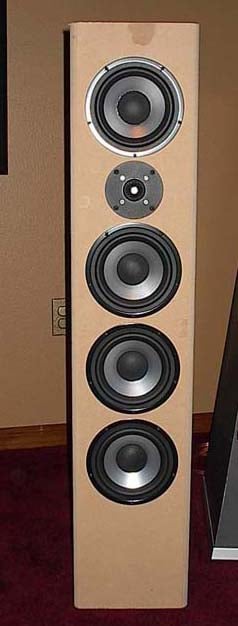 The design is
very versatile. If they are built completely from scratch the drivers can be
configured a few different ways. The
cabinets can be ported or sealed depending on the desired bass response. The
pair that Pete sent to me was
sealed. I also told Pete not to put an aesthetic finish on them because
I was more interested in their performance and the finish is completely up to
the builder (no kit options as of this writing offers any aesthetic finish). It
does make sense to mention their
profile though. They are narrow and tall and there is no flexibility for the
builder on the baffle width because it is part of the crossover design. To
change the width would change the sound.
Any speaker builder knows that the hardest part of building a speaker is
cutting a perfect hole with a recess. One of the coolest options for purchasing
this kit is that just the front baffle in the kit can be purchased with precut
holes. The builder is only left to build a rectangular box, put it together and
then put a finish on it. The front
baffle if purchased is 1 inch thick and the recesses and holes are perfect
The design is
very versatile. If they are built completely from scratch the drivers can be
configured a few different ways. The
cabinets can be ported or sealed depending on the desired bass response. The
pair that Pete sent to me was
sealed. I also told Pete not to put an aesthetic finish on them because
I was more interested in their performance and the finish is completely up to
the builder (no kit options as of this writing offers any aesthetic finish). It
does make sense to mention their
profile though. They are narrow and tall and there is no flexibility for the
builder on the baffle width because it is part of the crossover design. To
change the width would change the sound.
Any speaker builder knows that the hardest part of building a speaker is
cutting a perfect hole with a recess. One of the coolest options for purchasing
this kit is that just the front baffle in the kit can be purchased with precut
holes. The builder is only left to build a rectangular box, put it together and
then put a finish on it. The front
baffle if purchased is 1 inch thick and the recesses and holes are perfect
 because they are cut on a CNC machine. When I installed the drivers they fit in
their respective holes with ease. If you are new to speaker building do not
under estimate the value in purchasing the precut front baffle. I have built
many speakers with recessed holes and I usually spend a full day just cutting
holes. By the way, the recess is a must in any decent quality speaker because without
it there will be ripple diffraction. You
only have one chance of getting the recess right and you need a plunge router
and a good circle jig to do it. Once the
main hole is cut after the recess I don’t know of any way to fix the recess if
it is wrong; if you do please let me know.
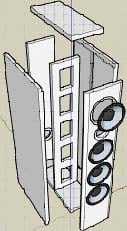
Two sizes of the baffle are available, one for a sealed box and one for
a ported box. If all pieces for the full kit are purchased it is important to
know that they are also cut from the CNC machine and that the joints are rabbeted. This means that all the pieces fit together
well to make assembly easy. I was not
concerned about the aesthetics but I did take a good look at the cabinet’s
construction. Pete
built this pair himself but he built it just like the complete cabinet that is
available as an option. It had sufficient bracing and it included fiberglass
plus some foam on the walls which eliminated internal reflections.
because they are cut on a CNC machine. When I installed the drivers they fit in
their respective holes with ease. If you are new to speaker building do not
under estimate the value in purchasing the precut front baffle. I have built
many speakers with recessed holes and I usually spend a full day just cutting
holes. By the way, the recess is a must in any decent quality speaker because without
it there will be ripple diffraction. You
only have one chance of getting the recess right and you need a plunge router
and a good circle jig to do it. Once the
main hole is cut after the recess I don’t know of any way to fix the recess if
it is wrong; if you do please let me know.
Two sizes of the baffle are available, one for a sealed box and one for
a ported box. If all pieces for the full kit are purchased it is important to
know that they are also cut from the CNC machine and that the joints are rabbeted. This means that all the pieces fit together
well to make assembly easy. I was not
concerned about the aesthetics but I did take a good look at the cabinet’s
construction. Pete
built this pair himself but he built it just like the complete cabinet that is
available as an option. It had sufficient bracing and it included fiberglass
plus some foam on the walls which eliminated internal reflections.
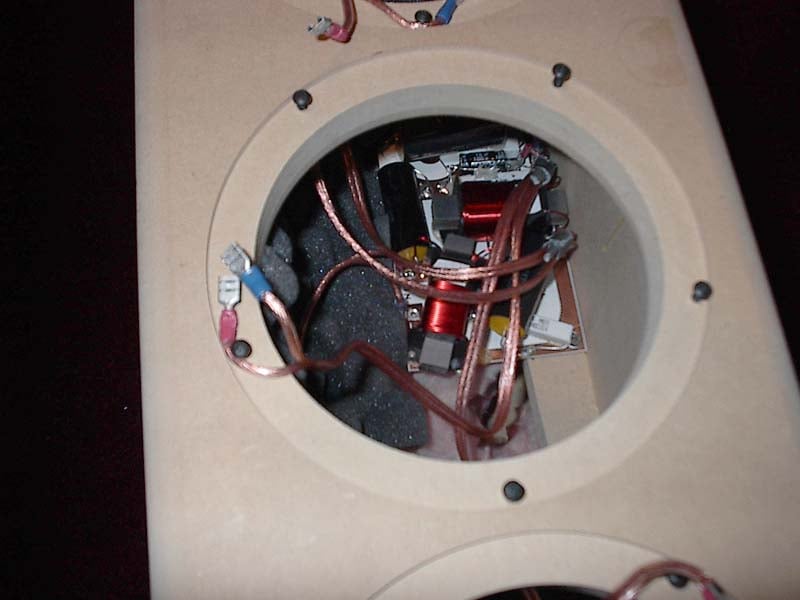 The
crossovers were not much to look at because Pete threw them together for the
review. He had not yet arranged who would be building them for the kit. Of
course the design of the crossover is a different story. As was mentioned before they were designed
around the front baffle shape and size and these particular crossovers were
designed for this baffle/driver layout.
So although different driver layouts can be done, a slightly different
crossover design would be needed which I’m sure Pete would make available. I was a bit surprised to see iron core
inductors in these crossovers; higher end speakers use air core inductors with
heavier gage wire to keep the dc resistance low. The iron core inductors have a
hysteresis which gives a non-linearity and might explain some of the missing
detail I talk about later. If the
crossover is built instead of bought then the inductors can surely be upgraded.
The
crossovers were not much to look at because Pete threw them together for the
review. He had not yet arranged who would be building them for the kit. Of
course the design of the crossover is a different story. As was mentioned before they were designed
around the front baffle shape and size and these particular crossovers were
designed for this baffle/driver layout.
So although different driver layouts can be done, a slightly different
crossover design would be needed which I’m sure Pete would make available. I was a bit surprised to see iron core
inductors in these crossovers; higher end speakers use air core inductors with
heavier gage wire to keep the dc resistance low. The iron core inductors have a
hysteresis which gives a non-linearity and might explain some of the missing
detail I talk about later. If the
crossover is built instead of bought then the inductors can surely be upgraded.
Configuration and Setup
 I had my processor set up as “small” for these speakers but it
also allows me to listen to them in direct mode which plays “two channel”
stereo with no crossovers. I
mostly listened to them in direct mode which also doesn’t play the subwoofers. I
always try different speaker positions to find the best setup which usually
involves placing them somewhere around my own speakers. I never know what the off axis response is
like for a speaker at this point so whether they are set up to reflect or
absorb early reflections is found by listening.
In this case they sounded best with reflecting the sound and it was
consistent with the measurements which were made later and are given below. The shape of the off axis curves should be the
same as the on axis 0° response curve. If the off axis curves vary greatly then the
speaker’s reflections should be absorbed or diffused for the best sound.
I had my processor set up as “small” for these speakers but it
also allows me to listen to them in direct mode which plays “two channel”
stereo with no crossovers. I
mostly listened to them in direct mode which also doesn’t play the subwoofers. I
always try different speaker positions to find the best setup which usually
involves placing them somewhere around my own speakers. I never know what the off axis response is
like for a speaker at this point so whether they are set up to reflect or
absorb early reflections is found by listening.
In this case they sounded best with reflecting the sound and it was
consistent with the measurements which were made later and are given below. The shape of the off axis curves should be the
same as the on axis 0° response curve. If the off axis curves vary greatly then the
speaker’s reflections should be absorbed or diffused for the best sound.
They didn’t have any kind of feet or spikes but obviously the kit builder has complete freedom in this choice. I placed them on some plywood to try to decouple them from the carpet. Keep in mind that this setup could have some big impacts on the bass and mid-bass response.
I tried placing them on the outside of my speakers which put them closer to the absorption panels but they were too far apart. Most speakers I set up end up on the inside of my own speakers and how far forward or back will either let me absorb the side reflections or not. The Schumakubin’s sounded best here on the inside and more forward than my speakers.
Schumakubins Listening Tests
First I played these speakers for a few hours to break them in. These were brand new drivers out the box and as a speaker builder I knew the suspension system (surrounds and spiders) were probably a little stiff and needed some loosening. I didn’t really listen to them closely at this time; in fact I left the room for most of this break in period. Don’t mistake the initial break in of a new driver with some “snake oil” about warming up the electrons every time you play them. After they were broken in I jumped right into my involvement music, Yes, The Ladder.
CD: Yes - The Ladder Involvement is probably the most important aspect of music
listening. What is the point of
listening to music if the listener can’t get involved? Yes The Ladder is an excellent CD for these
qualities. It
is hard to stop listening to this CD. I can force myself to stop listening
after the first five tracks but I want to keep going. The pace and rhythm along with the energy of
these songs gets the listener completely involved in the music. Jon Anderson’s voice should stand out very
forward in front of the speakers but not too close which is a good test of the
system midrange. The Schumakibins had
very nice tonal balance and Jon Anderson’s voice was nicely forward but not too
forward. Another great quality of this
CD is Steve Howe’s guitar performance; there is a good mix of electric and
acoustic riffs. The upper midrange, referring to the guitar, could have been a
little smoother and there seemed to be a slight lack of detail. But the lower
mids were very smooth and natural sounding. Although Rick Wakeman is not the
keyboardist on this CD Igor Khoroshev does a great job of creating and carrying
the energy that Yes fans are accustomed to. If the system can’t keep up with
the pace and rhythm, the music sounds sluggish and dull which is rare in today’s
audio market. A poor reproduction of the midrange though will also sound dull
leaving the listener uninterested. As I turned up the volume I started feeling
the involvement and the Schumakubins did not disappoint me with any kind of
compression. They opened up nicely.
After several conversations with Pete he kept convincing me not to
expect too much from the low end but from what I heard in these cuts I was
surprised to hear some nice solid low end.
Involvement is probably the most important aspect of music
listening. What is the point of
listening to music if the listener can’t get involved? Yes The Ladder is an excellent CD for these
qualities. It
is hard to stop listening to this CD. I can force myself to stop listening
after the first five tracks but I want to keep going. The pace and rhythm along with the energy of
these songs gets the listener completely involved in the music. Jon Anderson’s voice should stand out very
forward in front of the speakers but not too close which is a good test of the
system midrange. The Schumakibins had
very nice tonal balance and Jon Anderson’s voice was nicely forward but not too
forward. Another great quality of this
CD is Steve Howe’s guitar performance; there is a good mix of electric and
acoustic riffs. The upper midrange, referring to the guitar, could have been a
little smoother and there seemed to be a slight lack of detail. But the lower
mids were very smooth and natural sounding. Although Rick Wakeman is not the
keyboardist on this CD Igor Khoroshev does a great job of creating and carrying
the energy that Yes fans are accustomed to. If the system can’t keep up with
the pace and rhythm, the music sounds sluggish and dull which is rare in today’s
audio market. A poor reproduction of the midrange though will also sound dull
leaving the listener uninterested. As I turned up the volume I started feeling
the involvement and the Schumakubins did not disappoint me with any kind of
compression. They opened up nicely.
After several conversations with Pete he kept convincing me not to
expect too much from the low end but from what I heard in these cuts I was
surprised to hear some nice solid low end.
I noticed that the Schumakubins were not meant to play at low volumes. These speakers sounded okay at low volumes but they really didn’t open up until some good hearty wattage was put through them.
 CD: Lord of Rings, Return of the
King, Into the West
CD: Lord of Rings, Return of the
King, Into the West
Annie Lennox’s voice in this song is completely amazing and I’m not the only one who thinks so seeing she won an Academy Award for it. This song has such strong vocals it strains the limits of the midrange. It should be turned up and when she belts out those notes there should never be any edge to her voice. This song, for me, has that "grab ya" feeling that makes me want to keep listening to it again and again. Unfortunately I didn’t completely get that “grab ya” feeling while listening to this track on the Schumakubins.
CD: Enya - Shepherd Moons, Marble Halls
Next up in my audition was Enya’s Shepherd Moons CD. With all of the layers of  Enya’s voice
in this track it creates a light wispy airiness that should make the speakers
become completely transparent. Also, the detail of the main vocals should stand
out. The sibilance should be heard clearly with every S, but not to be confused
with an over abundance of sibilance or hissing sound. Every breath is apparent
in this recording. The music and vocals
blend together to create a unique sound. Most of Enya’s songs have the same
qualities but this one tends to stand out. The openness of the Schumakubins was
good but the transparency wasn’t as good as I had hoped. Although the detail
sounded better on this CD I think that the speakers would have sounded more
transparent if the detail was improved further. Enya’s voice was nice and high
and the sibilance was very good but there was not enough separation between the
voice layers and the music to create the airy essence. I would have preferred a
more airy and wispy sound but that’s one of the qualities that I personally
like and not everyone has the same likes as me.
Enya’s voice
in this track it creates a light wispy airiness that should make the speakers
become completely transparent. Also, the detail of the main vocals should stand
out. The sibilance should be heard clearly with every S, but not to be confused
with an over abundance of sibilance or hissing sound. Every breath is apparent
in this recording. The music and vocals
blend together to create a unique sound. Most of Enya’s songs have the same
qualities but this one tends to stand out. The openness of the Schumakubins was
good but the transparency wasn’t as good as I had hoped. Although the detail
sounded better on this CD I think that the speakers would have sounded more
transparent if the detail was improved further. Enya’s voice was nice and high
and the sibilance was very good but there was not enough separation between the
voice layers and the music to create the airy essence. I would have preferred a
more airy and wispy sound but that’s one of the qualities that I personally
like and not everyone has the same likes as me.
CD: Flim & the BB’s - Big Notes,
Heart Throb, Funhouse
 Detail and dynamics go hand in hand. When the playing
levels of the recording are soft the same details should be heard as when the
playing levels are loud. The Heart Throb
track does a good job of dynamics and detail.
Every instrument should sound natural from it’s softest notes to it’s
loudest notes. Paying close attention to
the different saxophones used here I should hear every note at every playing
level along with all of the detail in the percussion. The same goes for the
keyboards. The detail in this track for
the Schumakubins was not merged at all, in fact, they sounded quite detailed
and very crisp. I really started to
notice that the lowest octave (20-40 Hz) was not present but it still did a nice
job of playing its capable bass. Again, as I turned up the volume the speakers
started opening up and the sound filled my room very well. The Funhouse track
is one of my favorite test songs; it is completely synthesized on some kind of
IBM. There is so much detail programmed
into this song everything should sound crystal clear from its deep bass up to
its high crisp bell sounds. One other
thing that I like about this track is what I call pseudo imaging. All of the instruments have their position on
the stage but of course there are no instruments. Over years of listening to
this track I know where those sound positions should be. Again, the details were good on this track;
even at moderate volumes. The highs were smooth and not piercing; there was no
harshness. The dynamics sounded slightly subdued.
Detail and dynamics go hand in hand. When the playing
levels of the recording are soft the same details should be heard as when the
playing levels are loud. The Heart Throb
track does a good job of dynamics and detail.
Every instrument should sound natural from it’s softest notes to it’s
loudest notes. Paying close attention to
the different saxophones used here I should hear every note at every playing
level along with all of the detail in the percussion. The same goes for the
keyboards. The detail in this track for
the Schumakubins was not merged at all, in fact, they sounded quite detailed
and very crisp. I really started to
notice that the lowest octave (20-40 Hz) was not present but it still did a nice
job of playing its capable bass. Again, as I turned up the volume the speakers
started opening up and the sound filled my room very well. The Funhouse track
is one of my favorite test songs; it is completely synthesized on some kind of
IBM. There is so much detail programmed
into this song everything should sound crystal clear from its deep bass up to
its high crisp bell sounds. One other
thing that I like about this track is what I call pseudo imaging. All of the instruments have their position on
the stage but of course there are no instruments. Over years of listening to
this track I know where those sound positions should be. Again, the details were good on this track;
even at moderate volumes. The highs were smooth and not piercing; there was no
harshness. The dynamics sounded slightly subdued.
CD: Terence Blanchard - Malcolm Makes Hajj
 “Malcolm Makes Haaj” is all instrumental
and it exemplifies the sound stage and imaging.
It starts with a sax solo just to the right of the center and then goes
into a drum solo to the back of the stage.
After the drum solo finishes the trumpet player starts his solo playing
to the front left of the stage and finally the track finishes with a piano solo
just behind the trumpet player. Good reproduction
places these elements properly from side to side and front to back. The Schumakubins did a very good job of image
placement with all the instruments being heard from where they should although there could have been a bit more depth to the
stage. There was no edginess or
harshness to the sax or the trumpet but I would have liked a little more
realism to their sound. The piano solo
had good pace and overall the stage was nice and high as opposed to hearing
sound from the floor which I’ve heard on many other speakers.
“Malcolm Makes Haaj” is all instrumental
and it exemplifies the sound stage and imaging.
It starts with a sax solo just to the right of the center and then goes
into a drum solo to the back of the stage.
After the drum solo finishes the trumpet player starts his solo playing
to the front left of the stage and finally the track finishes with a piano solo
just behind the trumpet player. Good reproduction
places these elements properly from side to side and front to back. The Schumakubins did a very good job of image
placement with all the instruments being heard from where they should although there could have been a bit more depth to the
stage. There was no edginess or
harshness to the sax or the trumpet but I would have liked a little more
realism to their sound. The piano solo
had good pace and overall the stage was nice and high as opposed to hearing
sound from the floor which I’ve heard on many other speakers.
CD: Patrick O’Hearn - Trust
 Audiophiles
always give me a funny look when I talk about new age because it is mostly
electronically produced. It can’t really
be used for sound stage or instrument timbre but it can be used for other listening
tests such as bass. New Age music can
reach some really low frequencies and this disc is one of them. The title track is a very repetitive song
with excellent bass extension and some fine details. Good reproduction will have a good balance
between the bass and the upper frequency detail. A boomy system will definitely
show up here but there was nothing boomy about the Schumakubins. They sounded
very well balanced throughout the track.
Audiophiles
always give me a funny look when I talk about new age because it is mostly
electronically produced. It can’t really
be used for sound stage or instrument timbre but it can be used for other listening
tests such as bass. New Age music can
reach some really low frequencies and this disc is one of them. The title track is a very repetitive song
with excellent bass extension and some fine details. Good reproduction will have a good balance
between the bass and the upper frequency detail. A boomy system will definitely
show up here but there was nothing boomy about the Schumakubins. They sounded
very well balanced throughout the track.
The
importance of music in the mid-frequency range is extremely high because most
of the music we listen to is in the midrange. Most of the vocals are in the
midrange with male vocals being in the lower midrange and female vocals being
in the upper midrange.
CD: Suzanne Vega - Solitude Standing, Tom’s Diner
This song is sung a cappella and it has a good sense of realism. It has quiet pauses that enable the listener to hear how the room reacts along with noise in the system. When listening it should sound like she is standing right between the speakers. I also like to use Vega’s voice for some of the lower midrange which makes it ideal reference material. Everything sounded right playing through the Schumakubins. Her voice stood out, the balance was good and the quiet parts had no unusual lingering of sound.
CD: Steely Dan - Two Against Nature, Gaslighting Abbie, Janie Runaway
 This disk has a vast range of music qualities. It has
the mids of Fagan’s voice which should not be laid back in the slightest. The
detail and timbre of the instruments should be well balanced with the vocals;
there should be no blurring of the sound. The rhythm and pace of Gaslighting Abbie is the kind of song
that really gets your foot tapping. Janie runaway has very authoritative bass
guitar with a great jazz feel. I usually
like to listen to this disk last because it sums up everything about the music to
conclude my listening session. These
tracks sounded exceptionally good through the Schumakubins. The bass guitar was greatly balanced with the
lead guitar and Donald Fagan’s voice fit right into the mix. The sax sounded extremely smooth which is
what I expected at this point of my music auditioning.
This disk has a vast range of music qualities. It has
the mids of Fagan’s voice which should not be laid back in the slightest. The
detail and timbre of the instruments should be well balanced with the vocals;
there should be no blurring of the sound. The rhythm and pace of Gaslighting Abbie is the kind of song
that really gets your foot tapping. Janie runaway has very authoritative bass
guitar with a great jazz feel. I usually
like to listen to this disk last because it sums up everything about the music to
conclude my listening session. These
tracks sounded exceptionally good through the Schumakubins. The bass guitar was greatly balanced with the
lead guitar and Donald Fagan’s voice fit right into the mix. The sax sounded extremely smooth which is
what I expected at this point of my music auditioning.
I have a few SACDs and my favorite for auditioning is Tchaikovsky’s “Overture of 1812.” The resolution of this music is beyond anything else I own. The digitally recorded cannons will go beyond the testing of virtually any subwoofer if indeed it could survive. The multi-channel recording is superb, only the recording hall’s ambiance is put into the side channels but I focused on the high resolution stereo cut to isolate the Schumakubins. It was hard to go from the multichannel to the two-channel and be completely fair. The speakers, again, were tonally balanced but seemed to lack the realism of the instruments. But as I was writing this article I put on a standard classical baroque CD and on one track there were horns that sounded very real through the Schumakubins. I also tried something a little new; I put on an SACD of Matt Bianco, Matt’s Mood – La Luna, featuring Basia. I am not intimately familiar with this song but I am familiar with Basia’s voice. Her voice was forward and strong and the Schumakubins did a great job of portraying it. The bass was very solid throughout the song and the sax solo sounded like it was right there in the room. Next I put on Nora Jones “Come Away With Me” SACD and again, she sounded like she was right there singing live.
Schumakubins Measurements
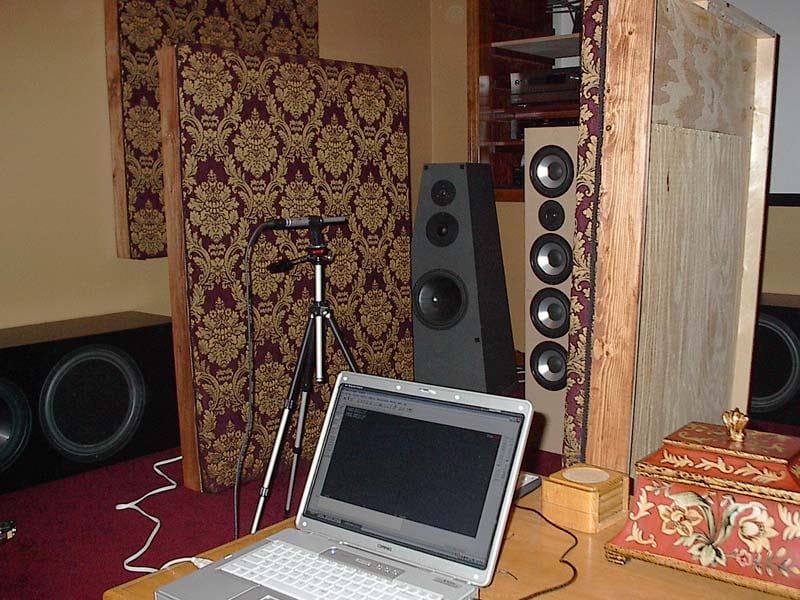 After gathering proper equipment over time to build my test system
and using a semi-broken microphone for a year (it finally died after the
measurements became more and more inconsistent) I was finally able to make some
good speaker measurements using TrueRTA on my laptop. I took my sound panels down and placed them
near the speaker under test to eliminate any reflections from the mid
frequencies and up. The bass response still interacts with the room for the measurements.
My pyramid speaker was actually behind the testing area.
After gathering proper equipment over time to build my test system
and using a semi-broken microphone for a year (it finally died after the
measurements became more and more inconsistent) I was finally able to make some
good speaker measurements using TrueRTA on my laptop. I took my sound panels down and placed them
near the speaker under test to eliminate any reflections from the mid
frequencies and up. The bass response still interacts with the room for the measurements.
My pyramid speaker was actually behind the testing area.
This first plot was taken using the Quick Sweep in TrueRTA with 1 watt at 1 meter. Keep in mind that the room’s effects are present below 300Hz. Smoothing was applied to all the plots to aid in visualization.
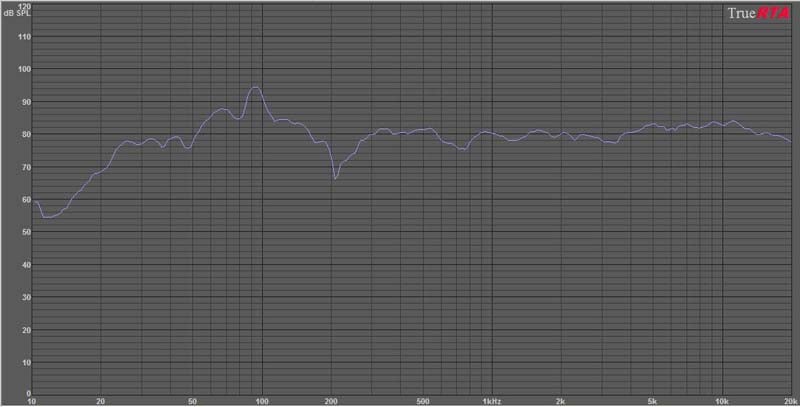
In-room Frequency Response (1 meter)
In the next plot the near field measurement was added (orange curve) to eliminate the room’s effects. The green curve is the same as the sweep above. You should look at the near field measurement (orange curve) up to 300 Hz and then follow the green curve from 300 Hz and up which gives a fairly accurate response of the Schumakubins.
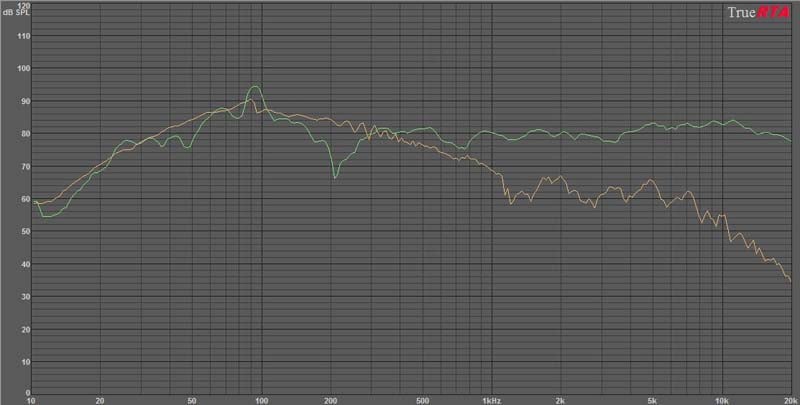
Nearfield Frequency Response
The best I could do to truncate and merge these curves to give a better picture was to airbrush the curves out in Paint. It is a bit crude but I think it helps in seeing the plot better. You can now see the shallow roll off as a result of the sealed box design. As mentioned before a ported version could be substituted.
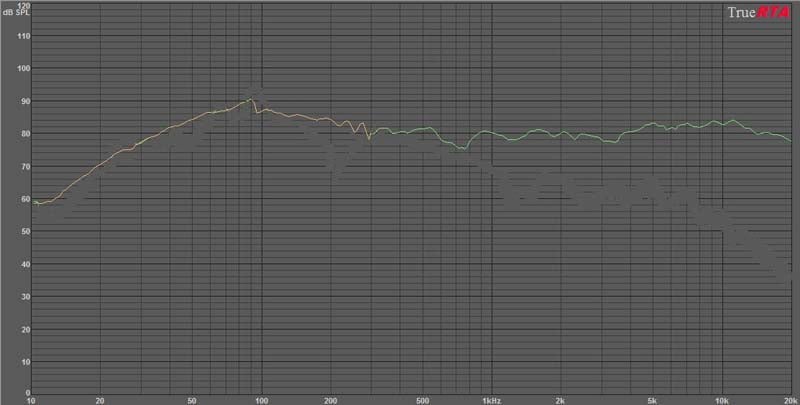
Combined Nearfield Frequency Response
Here are the plots generated from the crossover design program for comparison.
Here is an impedance plot of the drivers from the crossover program.
One measurement that has some importance that you don’t see too often is the off axis response. To repeat what was mentioned earlier for convenience. The off axis measurement tells whether the side reflections of the speaker should be absorbed or if a reflective surface is okay. If the off axis response has the same shape as the on axis response then it is okay to have the first incident sound waves reflected otherwise they should be absorbed or diffused. I did these measurements at 15º, 30º, 45º and 60º off axis. As you can see each curve has the same basic shape as the high frequencies fall off.
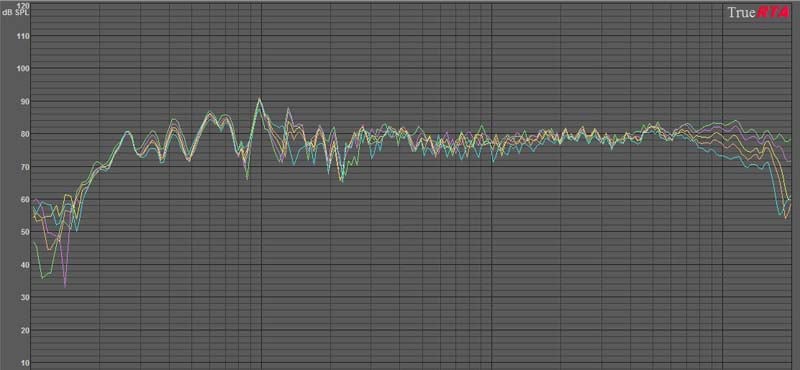
15-60 Deg On / Off Axis Frequency Response
Schumakubins Conclusion
The Schumakubins are $30 (plans only) to $670 (completed cabinet)
kit speakers. They are not $10,000 or $5000 speakers and it’s not fair to try
to compare them to speakers of this caliber.
I don’t personally think there is great value in the completed version
because they still need to have a finish put on them. Whether it is vinyl or veneer there is still
work to be done after spending $670. With that said, as a kit they indeed
perform very well for the value. I
personally prefer speakers that are more open and transparent but where the
Schumakubins shine is their smooth midrange and tight bass. Also remember that I only reviewed one
configuration of the kit. The other configurations may have some qualities that
these didn’t and it comes down to your own preference. An email to Pete
explaining your own preference would certainly get an honest response and
recommendation. If you are interested in
building speakers but a little reluctant the Schumakubins are a great
opportunity. I recommend buying the kit
with the precut front baffle. You will
be on your way to getting the best sound for the least amount of money and
work. Kit speakers are a great and fun way to get some really good sound
enjoyment and the Schumakubins are a great way to start.
For more information, visit:
http://www.theaudiologic.com/
MSRP: $30- $670
The Score Card
The scoring below is based on each piece of equipment doing the duty it is designed for. The numbers are weighed heavily with respect to the individual cost of each unit, thus giving a rating roughly equal to:
Performance × Price Factor/Value = Rating
Audioholics.com note: The ratings indicated below are based on subjective listening and objective testing of the product in question. The rating scale is based on performance/value ratio. If you notice better performing products in future reviews that have lower numbers in certain areas, be aware that the value factor is most likely the culprit. Other Audioholics reviewers may rate products solely based on performance, and each reviewer has his/her own system for ratings.
Audioholics Rating Scale
 — Excellent
- — Very Good
- — Good
- — Fair
- — Poor
| Metric | Rating |
|---|---|
| Build Quality | |
| Treble Extension | |
| Treble Smoothness | |
| Midrange Accuracy | |
| Bass Extension | |
| Bass Accuracy | |
| Imaging | |
| Soundstage | |
| Dynamic Range | |
| Performance | |
| Value |
Ken Stein is a contributing writer and reviewer for Audioholics and he really REALLY likes his speakers (which he should, since he spent countless hours hand-crafting them himself.) Ken is an engineer with FedEx and applies his diligent attention to detail to his speaker and electronics reviews here at Audioholics.
View full profile