
Human Hearing - Distortion Audibility Part 3
Distortion. Present in every electro-mechanical-acoustical transducer ever built, yet infrequently does one find information (let alone useful information) that describe the type and degree of distortion presented by the transducer. Head out on the Internet and corral a good sized collection of loudspeaker driver spec sheets and you'll find that not many will offer much guidance where it comes to sizing up candidates for your next loudspeaker system design. That is, if you include distortion figures amongst the criteria used in rendering your component purchase decisions. What to do?
There is available today inexpensive (and in some cases free) software that give you the opportunity to explore the various forms of sonic bad behavior your pet driver or loudspeaker is capable of. Combined with a PC sporting a reasonably good quality sound card, an inexpensive, calibrated microphone, such as those available through Old Colony, and you are all set to explore your driver or loudspeaker system from what may be for you a different and interesting perspective.
Source
Distortion is the audible, unwanted by-product of the electro-mechanical-acoustical transduction process. Broadly speaking, all forms of distortion can be classified into either one of two categories: linear or non-linear.
In a standard driver, distortion arises as a consequence of suspension compliance (Cms(x)), force factor (Bl(x)), and inductance (Le(x) nonlinearities. (Though there are other contributors, these three are considered the dominant driver system nonlinearities). As can be seen from the graphs, these driver parameters do not remain constant, but instead depend on state variables such as displacement (x) and voice coil temperature (Tvc), which in turn depend on frequency (Hz) and drive voltage.
Under some circumstances distortion can also arise from the nonlinearity of the air enclosed within a loudspeaker cabinet. Even the human hearing mechanism can inject distortion into the perceived acoustical signals!


When we look at non-linear distortion we are focusing on the ability of the driver to produce harmonics and/or intermodulation products in amplitude/frequency combinations that were not present in the signal originally fed to the driver. Harmonic and intermodulation (IM) distortion are well known examples of non-linear distortion. It's useful to keep in mind that even-order distortion products are caused by asymmetrical driver system nonlinearities and conversely, odd-order distortion products are caused by symmetrical driver system nonlinearities.
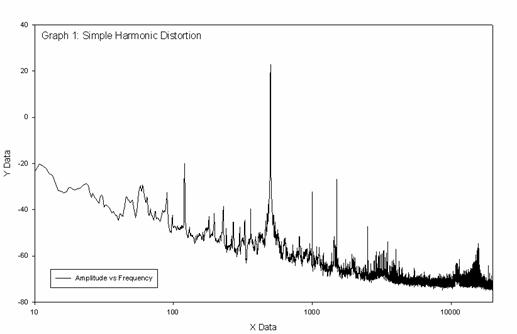
Using a single test tone of ~800 Hz, we see in Graph 1 the fundamental test tone plus harmonics
that were not present in the original signal.
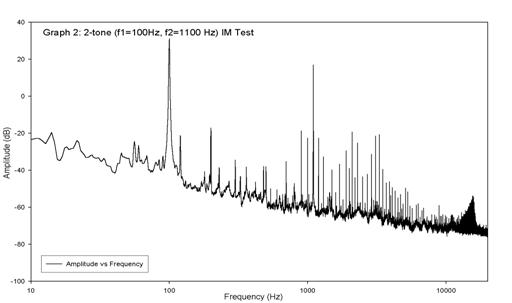
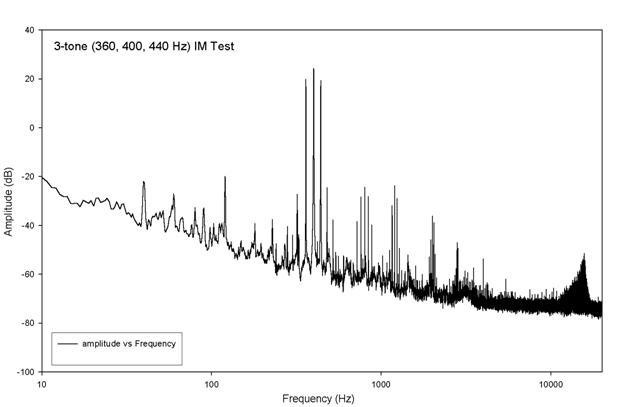
In Graph 2, we see the fundamentals (at 100 & 1100 Hz), plus harmonics, along with the expected intermodulation products. Non-linear distortion tends to be quite level-dependent. As such, non-linear distortion levels - for a given input signal level - can be reduced by employing multiple drivers (such as found Wilson Audio's Alexandria or Puppy or the RBH Signature T-2 System ) though you'll then have to take into design consideration lobing, extra cost, etc.
Simply listening while running an harmonic or IM distortion test like that which produced the data encapsulated in Graph 3 and you'll also have before you a great opportunity to learn how to recognize the presence of nonlinear distortion, which manifests itself long before it becomes blatant or otherwise obvious, in this case, adding a harsh "edge" or gritty "sheen" to the driver's acoustic output.
Vary the drive voltage feeding the driver or system under test upward and you may find it surprising to see how rapidly the amplitude of the harmonics and intermodulation products moves upward. Indeed, the amplitude of the non-linear distortion products increases more quickly than the increases in the drive voltage. In this case, experimentation can provide a great deal of insight where it comes subjectively assessing the presence and overall influence of non-linear distortion.
Graph 3
When we investigate linear distortion, it's useful to think of the driver as a system, having resonances and capable of storing energy, which is released over a time, ex post facto. The generation of new tones is not a feature of linear distortion.
Using an appropriate test signal, such as a 4-cycle tone burst, it's easy to identify the energy-storage characteristics of the device under test, whether it be a driver or entire loudspeaker system. The 4-cycle tone burst is well suited for such tests, appropriately windowed (I tend to use Blackman windowing for test/test signals such as presented here) optimized for fast rise & decay, while still providing for good frequency resolution. Amplitude & time tests using this signal have shown good correlation with subjective assessments. Heightened amounts of linear distortion have been associated with lessened transparency.
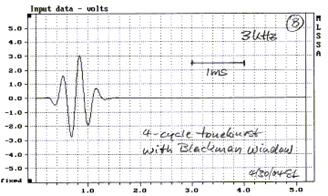
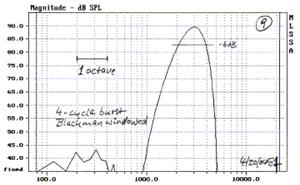
Tone burst test signal (volts) Acoustic output (dB SPL)
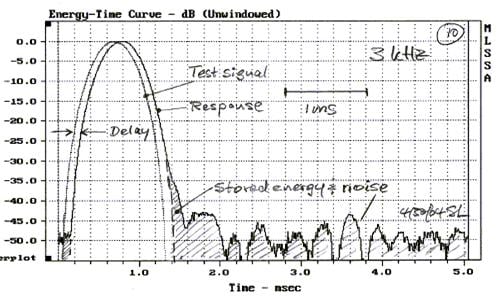
Comparison of electrical test signal and driver acoustic output energy time curves (ETC)
Perception and subjective evaluation
How large an influence does distortion, linear or non-linear, have on the perceived acoustical qualities or character of an individual driver or complete loudspeaker system's acoustic output? Are there perception thresholds? What role does threshold masking play? Do certain types of program material reveal the presence of distortion more easily than others? How does the ear's ability to introduce distortion into the perceived acoustic signal effect our ability to hear?
One of the main purposes of subjective assessment using live listeners is to provide the raw data which, when run through the sieve of statistical analysis, produces the reproducible, qualitative intelligence by which definitive judgments can be subsequently made. The results of such listening tests, when combined with the results of actual distortion measurement test provide for yet another useful perspective from which to judge the quality of a driver or loudspeaker system.
In looking over just such research resources for this article in human hearing it became clear that psychoacoustics is a science that is definitely a "work in progress". Oftentimes published reports or original research presentations raised more questions than they answered. Clearly, there exists room for more research.
Presented below, encapsulated in table form, is an outline-format collection of original research efforts and reports devoted to answering the questions posed in the first paragraph of this section. It is by no means complete. Rather, it represents a useful cross-sectional sample of what's currently out there.
|
Item |
Study/Report Author & Date |
Subject |
Results/Conclusion |
Misc. Notes |
|||
|
1 |
James Moir/1981 |
Just detectible distortion (JDD) levels |
JDD "level can be no lower than 1%" |
Assumed non-linear distortion was the primary type of distortion involved. JDD levels dropped as listeners learned to recognize distortion. |
|||
|
2 |
D.E.L Shorter/1950 |
Sound quality of systems with known quantities of harmonic distortion |
Just perceivable distortion values of 0.8% to 1.3% |
Multiplying harmonic amplitudes by n^2/4 (n = harmonic order) before rms summing produced better correlation between objective measurement and subjective assessment. |
|||
|
3 |
P.A Fryer/1979 |
Listening tests for intermodulation distortion |
2% - 4% distortion detectable in piano music, 5% in other types of test signals |
Distorted test material using 1st order IM distortion products |
|||
|
4 |
Von Braunm ü hl & Weber/1937 |
Distortion sensitivity at selected frequency bands |
1% - 2% at frequencies > ~ 500 Hz |
Noted that at lower frequencies JDD levels could go much higher |
|||
|
5 |
Harry F Olson/1940 |
Just detectible distortion (JDD) levels |
JDD level of .7% using 40 Hz to 14 kHz bandwidth test system |
Restricting system to 4 kHz doubled the JDD level |
|||
|
6 |
M. E. Bryan & H. D. Parbrook/1960 |
Just detectible amplitude of 2nd - 8th harmonic in the presence of a 360 Hz fundamental (f1) |
|
2nd |
3rd |
4th |
Chart at left shows just discernible amplitude in dB for the 2nd, 3rd, and 4th harmonics below (f1) levels shown in left column |
|
52.5 |
44 |
52 |
52 |
||||
|
60 |
52 |
57 |
61 |
||||
|
70 |
47 |
62 |
67 |
||||
|
76 |
- |
54 |
59 |
||||
Frontiers
One of the more interesting items I came across in researching this article was that of researchers examining means by which the correlation between objective measurement and subjective assessment could be improved. The discrepancies are well known and have been discussed in the literature for years. Just witness the online flame wars that erupt between the objectivist ("If I can't measure it, it doesn't exist") camp and the subjectivists ("Measurable or not - I know what I hear")!
Standing as complementary to the works of such well-known researchers as Rayleigh, Hilliard, Olson, Toole, et. al., there exists efforts to develop predictive means by which listener preferences can be modeled. One, presented by Daniel Cheever (cited below), demonstrates a set of measurement protocols that appear to effectively narrow the gap between perception and measurement. In a similar vein, Dr Earl Geddes has proposed the use of a nonlinear system identification model based on the Volterra series that provides for a test metric which evidently provides for a high degree of correlation between listener preference and the presence of varying levels of non-linear distortion. I applaud efforts such as these. The better understood the listener's hearing processes and preferences, the better focused audio product engineering can become. And in the end we all gain.
Resources
1. Colloms, Martin: " High Performance Loudspeakers ", John Wiley & Sons, New York , © 1978
2. Farina, Angelo: " Simultaneous Measurement of Impulse Response and Distortion
with a Swept Sine Technique " Audio Engineering Society Preprint,
5093 - D4, February 2000
3. Temme, Steve F.: " How to Graph Distortion Measurements ", Audio Engineering
Society Preprint, 3602 - L1-5, March 1993
4. Temme, Steve F.: " Audio Distortion Measurements ", Bruel & Kjaer Application
Note, Bruel & Kjaer May 1992
5. Klippel, W.: " Measurement of Weighted Harmonic Distortion HI-2 ", Application Note,
Klippel GmbH, April 2002
6. Klippel, W.: " Speaker Auralization Subjective Evaluation of Nonlinear Distortion ",
Klippel GmbH, 110 Audio Engineering Society Convention
7. Bohn, Dennis: " Audio Specifications ", RaneNote 145, Rane Corporation,
January 2003
8. Cheever, Daniel H .: " A New Methodology For Audio Frequency Power
Amplifier Testing Based On Psychoacoustic Data That Better
Correlates With Sound Quality ", University of New Hampshire ,
1989
9. J. D. Bunton,: R. H. Small, " Cumulative Spectra, Tone Bursts, and Apodization ",
Journal of the Audio Engineering Society, Vol. 30, No. 6, pp. 386-395,
June 1982
10. O. Dossing,: " Uncertainty in Time-Frequency Domain Representations ",
Sound and Vibration, Vol. 32, No. 1, January 1998, pp. 14-24
11. Linkwitz, Siegfried: " Shaped Tone-Burst Testing ", Journal of the Audio Engineering
Society, Vol. 28, No. 4, April 1980
12. Linkwitz, Siegfried: " Narrow Band Impulse Testing of Acoustical Systems ", 60th Audio
Engineering Society Convention, Los Angeles 1978, Preprint 1342.
13. Moir, James: " Just Detectable Distortion ", Wireless World, vol. 87, no.1541,
February 1981
14. Harwood , H. D., " Loudspeaker Distortion Associated With Low-Frequency Signals ", Journal
of the Audio Engineering Society , Vol. 20, No. 9, Nov 1972, pp 718-728.
15. Cabot, Richard C., et al., " Nonlinear Audio Distortion ", Ch. 13-3, Standard Handbook of Audio and
Radio Engineering, McGraw-Hill, 2002
16. Klippel, W.: " Assessing Loudspeakers in the Large Signal Domain ", ALMA presentation,
January 2001 , Klippel GmbH
17. Klippel, W.: " Diagnosis and Remedy of Nonlinearities in Electrodynamical Transducers ",
AES Preprint #5161, 109th Convention of the Audio Engineering Society,
Los Angeles Sept. 22-25, 2000
18. Bryan , M. E., Parbrook, H.D.: " Just Audible Thresholds For Harmonic Distortion ",
Acoustica, Vol. 10, 1960, pp 87 - 91
19. Cabot, Richard C.: " Audible Effects Vs Objective Measurements In The Electrical Signal Path ",
Audio Engineering Society, 8th International Conference, Washington , DC ,
1990 May 3-6
20. Wigan, E. R.: " New Distortion Criterion ", Electronic Technology, Vol. 38, #4 & #5, pp128-137,
163 - 174 1961
21. Cheever, Daniel H.: " A New Methodology For Audio Frequency Power Amplifier Testing
Based on Psychoacoustic Data That Better Correlates With Sound
Quality ", MSEE Thesis, University of New Hampshire , December 2001
22. Czerwinski, E. et. al.: " Multitone Testing of Sound System Components - Some Results
and Conclusions", Part 1: History and Theory , Journal of the Audio
Engineering Society , Vol. 49, No. 11, Nov 2001, pp 1011-1048.
23. Czerwinski, E. et. al.: " Multitone Testing of Sound System Components - Some Results
and Conclusions, Part 2: Modeling and Application ", Journal of the Audio
Engineering Society , Vol. 49, No. 12, Dec. 2001, pp 1181-1192.
24. Toole, Floyd E.: " Subjective Measurements of Loudspeaker Sound Quality and Listener
Performance" , J ournal of the Audio Engineering Society , Vol. 33, No. 1/2,
Jan/Feb, 1985, pp 2 - 32
Web Resources
1. http://www.linkwitzlab.com/