
Loudspeaker Break In: Fact or Fiction?
Causes, Effects and a Few Useful Observations
Driver "break in", "burn in" or "run in" is a topic that's been debated in various forums for years. Though not generally discussed with the vigor or conviction typically devoted to topics such as the sound of cables, it nevertheless continues to ignite occasional flame wars, fueled by the contributions of both uninformed and enlightened alike.
In this article we'll look at a typical electrodynamic driver's operation as seen largely from the mechanical side, with a view to assessing the validity of various claims frequently made regarding driver break in. We'll also see why it's in a manufacturer's best interest to ensure their products are broken in long before leaving the factory warehouse and how that bears on subsequent attempts at burning a driver in. I'll conclude with a few anecdotes drawn from my own experiences.
The Driver
Sift through the reams of text devoted to driver break in that have been published in both consumer-oriented print media and various online forums over the years and you'll find all sorts of claims attributed to the effects of driver break in. Research of the last 8-years worth of online discussions devoted to this topic, found in a handful of online forums, nevertheless uncovered a few interesting trends:
- The majority of claims related to improved bass performance following break in.
- No single instance of performance deterioration, by a correctly functioning driver, owing to break in, was found.
- Among those attributing improved system performance to driver break in, there appeared to be specific time periods over which improvements occurred, after which no further improvements were noted.
As the majority of opinions expressed by those indicating that burn in made a difference were focused on the LF & MF portion of audible spectrum it seems appropriate to focus this investigation on those drivers designed for use in those segments of the audible.
 When a newly-minted driver rolls off the assembly line it will typically not measure or otherwise perform as one of its well-broken in siblings does. In large part these differences arise owing to the fact that said driver's spider (often crafted of a varnish-impregnated linen) is not as compliant as it will become once it's broken in properly. Depending on number of mechanical factors relating to its design, construction and materials composition, a net post-burn in compliance increase on the order of 5% - 10% would not be unusual.
Owing to this initial change in compliance, we can also expect to see, post-burn in, a reduction in fs, given:
 (Hz)
(Hz)
Where:
 driver free-air resonance frequency (Hz)
 mechanical mass of driver diaphragm assembly including airload (gm)
 mechanical compliance of diver suspension (
  )
)
a reduction in Qts, given:
and
Where:
 magnetic flux density in air gap (T)
 length of wire in air gap (m)
 mechanical mass of driver diaphragm assembly including airload (gm)
 mechanical compliance of diver suspension (μM/N)
 driver resonance frequency (Hz)
 total Q of driver at resonance fs including all system resistances
 Q of driver at fs considering driver nonelectrical resistances only
 Q of driver at fs considering electrical resistance, Revc, only
 Acoustic mass of driver diaphragm assembly including voice coil and air load
 DC resistance of driver voice coil (Ω)
 equivalent piston area of diaphragm (
  )
)
and of course, an increase in Vas, given:
 (L)
(L)
Where:
 volume of air having same acoustic compliance as driver suspension (L)
 density of air (1.18 kg/m^3)
 velocity of sound in air (345 m/s)
 mechanical compliance of diver suspension (
  )
)
 equivalent piston area of diaphragm (
  )
)
Required break in time for the common spider-diaphragm-surround is typically on the order of 10s of seconds and is a one-off proposition, not requiring repetition. Once broken in, the driver should measure/perform as do its siblings, within usual unit-to-unit parameter tolerances.
Probably the most common approach used by manufacturers who purposely take the time to break in raw drivers is to apply a sine wave signal, at a frequency equivalent to the unit's free air resonance, delivered at amplitude sufficient to thoroughly stretch out the spider, without damaging the unit, of course
An alternate approach referred to in the literature is the use of broad band noise. However, this approach is inefficient when compared to the sine- wave-at-free-air-resonance approach.
Break in, however, isn't necessarily a discrete step, purpose built in to the driver or loudspeaker system manufacture process. Does that mean loudspeaker systems produced by a manufacturer that doesn't break in the drivers require breaking in by the consumer? No, not necessarily.
Quite often, spider break in occurs when the driver is tested, before and/or after placement in the cabinet for which it's intended. Driver testing by signal stimulus at some point (or points) in the manufacturing process - if done at levels sufficient to break in the spider - generally makes further break in unnecessary. Hence, a finished system will not - in so far as its drivers are concerned - require further break in by a consumer once taken home from the dealer.
Systems
 But let's suppose for the sake of discussion you've purchased a 3-way system sporting a collection of never been broken in drivers. Given the initial, one off, changes in driver suspension compliance that would occur the first time said suspension was thoroughly stretched, how much a difference in system performance, pre/post burn in, could be expected?
Table 1 & 2 lists some driver specs derived from measurements of 10" woofer and a 4.5" midrange driver. The post - break in specs are derived from a 5% increase in suspension mechanical compliance. The focus here is on those specs that changed following the initial break in.
10" Woofer
|
Pre - Break In |
Post - Break In |
||
|
Vas (L) |
124.84 |
Vas (L) |
131.0856 |
|
Cms (μM/N) |
721.80 |
Cms (μM/N) |
757.8900 |
|
fs (Hz) |
27.78 |
fs (Hz) |
27.110 |
|
Qms |
5.547 |
Qms |
5.414 |
|
Qes |
0.414 |
Qes |
0.404 |
|
Qts |
0.385 |
Qts |
0.376 |
Table 1
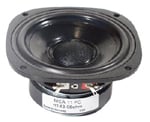
4.5" Mid Range
|
Pre Break In |
Post Break In |
||
|
Vas (L) |
1.5627 |
Vas (L) |
1.6408 |
|
Cms (μM/N) |
363.7844 |
Cms (μM/N) |
381.9736 |
|
fs (Hz) |
121.119 |
fs (Hz) |
118.200 |
|
Qms |
2.880 |
Qms |
2.811 |
|
Qes |
1.041 |
Qes |
1.016 |
|
Qts |
0.765 |
Qts |
0.746 |
Table 2
Modeling the mid-range driver in LEAP, allows us to see the amplitude response of the system pre- and post-break in. This was accomplished by designing a totally enclosed cabinet for the pre-break in driver, deriving the system amplitude response, then substituting the broken in driver and the re-running the simulation, with both plots displayed in the same graph for comparison. The results are shown in Graphic 1.
Clearly, the differences in amplitude response between the pre- & post-break in systems are negligible. Indeed, maximum amplitude difference within the passband of the system is on the order of .09 dB! In passing it should be noted that it was the broken in system that exhibited the down .09 dB amplitude response at resonance. Also included for comparative purposes are the impedance curves for both systems.
Note the impedance peak frequency for the burned in system was slightly higher than that of the non-burned in system.
Graphic 1
Graphic 2
Next, a series of simulations were run this time using the 10" woofer. As in the preceding case, this was accomplished by designing a totally enclosed cabinet for the pre-broken in driver, deriving the system amplitude response, then substituting the broken in driver and re-running the simulation, with both plots displayed in the same graph for comparison. The results are shown in Graphic 3.
Graphic 3
As in the preceding case, the differences seen between the amplitude response plots of the pre- and post- broken in systems is negligible, the maximum magnitude difference occurring within the passband being .02 dB. Although difficult to tell given the graphic's resolution and the very small amplitude differences to begin with, it was the burned in system's amplitude response that was .02 dB down at resonance. In Graphic 4 we see the impedance plots of both systems, showing results similar to those seen in the mid-range simulations.
Graphic 4
The compliance of the air enclosed within the enclosure is significantly less than the driver's suspension compliance, therefore the enclosure has the dominant influence where it comes to determining things such as system resonance. Thus, owing to the physics of the enclosed box loudspeaker system, any pre/post differences in driver suspension mechanical compliance are constrained from having as large an effect on parameters such as resonance frequency, etc as intuition might lead one to believe it should.
Taken together, it's clear the volume of air confined within the sealed cabinet of the enclosed box loudspeaker system moderates any measurable and/or audible changes that might arise as a consequence of driver compliance changes.
Speaker Break In: Fact or Fiction? - page 2
What about the case of a vented box loudspeaker system? What sort of pre/post break in changes in amplitude response occur?
Graphic 5 & 6 illustrate that pre/post-break in amplitude response and system impedance differences are, much like that for the totally enclosed box, very small indeed. This comes as no surprise. Just as in the case of the totally enclosed box, the compliance of the vented box (for most common, practical implementations of that design now in production) has the dominant influence, minimizing the effect of variations in driver suspension mechanical compliance.
Graphic 5
To put in to perspective just how small the variances were between the pre/post break in systems modeled above, a further 4 simulations were run. The purpose of this series was to see how normal production unit-to-unit driver spec variances would affect final amplitude response of a system.
Four mid-range drivers, selected from the same production run, were measured and the data taken were used to work up the simulations. A totally enclosed system was designed for the first of the four drivers. The amplitude response of that system was selected as the baseline to which all others would be compared. Then the simulation was run again, each time substituting one of the remaining three drivers for the first in the cabinet designed for the first driver.
When the test series was run to completion, the resulting amplitude response graphs indicated that an end user would likely encounter larger system-to-system amplitude response differences (~1.04 dB Spl) owing to normal driver variances than would be encountered breaking in raw drivers. In Graphic 7 we see the results of that run.
Further perspective was gained by running four additional simulations, this time modeling amplitude response variations arising as a consequence of altering suspension compliance 5%, 20% and 30%. The amplitude response in each case was compared with a baseline response, derived from the system designed around the data pulled from direct measurement of the first driver. From the resulting plots it can be seen that even compliance changes on the order of 20% - 30% have very little (~.65 dB spl @ max. passband variance) effect on a system's amplitude response.
From the foregoing analyses, it's reasonable to conclude that suspension compliance changes arising as a consequence of initial driver burn in has little effect on the performance of a loudspeaker system.
But once a driver is past the initial suspension-stretching break in, do further changes occur?
Regardless of how completely broken in a driver may be, while under operating conditions many well-known & understood mechanisms come in to play that affect several of a driver's measured parameters, including suspension mechanical compliance.
When under normal operating conditions, its not at all unusual to see in a driver that has already been broken in a further 5% to 20% drop in a fs , due largely to an increase in the mechanical compliance of driver's suspension. In this case, typically it's the temporary elastic deformation of the surround that's the cause of the increase in driver compliance.
Cease stimulus and the driver's compliance will return - in most cases within seconds or minutes depending upon surround design, material composition, ambient temperature and so on - to its pre-stimulus value; the compliance changes are temporary. So too are the changes that occur in all the other driver parameters that are effected by compliance, hence the changes in fs , vas, etc.
Anectdotes & A Few Useful Observations
 It was the late 80's and one day I found myself in possession of 8 newly-delivered JBL 2226H LF drivers along with some JBL 2447H MF/HF drivers that were bound for a FOH system I was designing for a small theatre in New York. In those days, my practice was to burn in every driver that came across my bench for extended periods of time, then use the data derived from post-break in measurements in the design phase of the project.
Round about that same time, though, I was growing disenchanted with all the time I was spending burning in various drivers because my pre/post break in parameter/performance assessments consistently turned up next to nothing in terms of measurable differences. Where were the changes I should have been seeing?
In those days I didn't understand the process of driver burn in well enough to realize it's the initial burn in that makes the largest difference in a driver's performance and anything done subsequently along those lines does next nothing in terms of lasting effects. So it was with my incomplete understanding I set up a weekend-long burn in session of the 2226Hs, along with the 2447s.
I'm not sure now whether it was because I was becoming convinced that extended burn ins were all but useless or because I had just acquired a bunch of new test gear that I went ahead and measured the drivers pre-burn in. Anyway, I set up the burn in session that Friday and didn't return to do the post-burn in measurements until the following Monday.
The following Monday I measured each driver twice: first immediately after disconnecting it from the test rig, then again about 4 hours later. Aside from differences attributable to changes in each driver's voice coil temperature, in none of those drivers did I uncover any significant changes in any of the measured parameters or performance.
Four years after the system had been installed in the theater, I had the opportunity to go back and take some measurements. I availed myself of the opportunity and found that the amplitude response plots made that day matched to within a fraction of a dB those made when the system was first installed. Four year's worth of "breaking in" hadn't affected the system to any significant degree.
In hindsight, its clear the 2226s had been sufficiently broken in long before I took possession of them and it's doubtful any amount of burn in would have materially effected the 2447s, which sport titanium diaphragms.
A few years later, I found myself, literally, peering into a warehouse filled with raw drivers. Most of these drivers were the product of various Asian manufacturers, none of which I had any previous experience with.
At that point in time, I was working on the design of a 3-way system and was at that stage in the process where I had to select an appropriate woofer for the system. The head of engineering recommended I take the time to burn in each candidate driver before doing any measurements as some would likely never have been burnt in at all. Being familiar with the driver manufacturing process, it was hard to imagine a driver never being exposed to a suspension-stretching stimulus, but as it turned out, some of the candidates did indeed exhibit symptoms of never having been burnt in.
At that particular establishment, driver burn in was a quick process: a sine wave, delivered at the driver's pre-burn in fs and at an amplitude large enough to stretch the driver's suspension, but not so large to cause damage was used. Following initial burn in, suspension compliance would show the usual expected shift, then eventually drift back to and settle at a value something on the order of ~5% to 10% greater than than that measured pre-burn in. In this case, taking the time to burn in drivers was necessary.
Conclusion
In an electrodynamic driver featuring the usual surround-diaphragm-spider construction, driver suspension mechanical compliance plays a key roll in determining the measured value of various driver parameters. All of these parameters will shift as the mechanical compliance of the driver's suspension shifts in value. The bulk of a driver's compliance shift will occur at the time of initial burn in.
Subsequent shifts in compliance are largely temporary in nature. An example of one such mechanism contributing to such temporary shifts is that which arise from the elastic deformation of butadiene-styrene surrounds. Given sufficient time to recover, these changes tend to reverse themselves and the driver returns to its pre-stimulus state.
As the enclosure compliance in both totally enclosed boxes and vented cabinets dominates that of the driver for most practical implementations of either type enclosure currently in production, any potential changes in system amplitude response attributable to changes in driver suspension mechanical compliance tend to be minimized. Normal production unit-to-unit driver spec variances can affect final amplitude response of a system to a larger degree than that expected from normal pre- post-burn in driver suspension compliance changes.
Resources
Thiele, A. N.: "Loudspeakers in Vented Boxes: Part I", Journal of the Audio Engineering
Society, Vol. 19, #5 May 1971
Thiele, A. N.: "Loudspeakers in Vented Boxes: Part II", Journal of the Audio Engineering
Society, Vol. 19, #6, June 1971
Small, Richard H.: "Direct Radiator Loudspeaker System Analysis", Journal of the Audio Engineering
Society, Vol. 20, #5, June 1972
Small, Richard H.: "Closed-Box Loudspeaker Systems Part I: Analysis", Journal of the Audio Engineering
Society, Vol. 20, #10, Dec. 1972
Small, Richard H.: "Closed-Box Loudspeaker Systems Part II: Synthesis", Journal of the Audio Engineering
Society, Vol. 21, #1, Jan. /Feb. 1973
Benson, J. E.: "Theory & Design Of Loudspeaker Enclosures", Howard W. Sams & Company,
Indianapolis, IN, 1996
Button, Douglas, J.: "Heat Dissipation & Power Compression in Loudspeakers", Audio
Engineering Society Preprint #2981
Gander, Mark R.: "Dynamic Linearity and Power Compression in Moving-Coil Loudspeakers",
Journal of the Audio Engineering Society, Vol. 34, #9, September 1986
Klasco, Mike.: "Voice Coil Design in Loudspeakers", Sound & Communication, March 1997
Klasco, Mike.: "Woofers and Subwoofers", Sound & Communication, July 1994