
Optoma PD50A Plasma TV Review
Optoma PD50 Plasma TV
- Product Name: PD50A Plasma TV
- Manufacturer: Optoma
- Performance Rating:

- Value Rating:
- Review Date: November 16, 2005 19:00
- MSRP: $ 3749
| Video Features Native Resolution: 1366x768 (50" diagonal) Brightness: 400 Nits Contrast Ratio: 3000:1 (typical) Screen Size: 50-inch diagonal Displayable Colors: 16.77 million (24-bits) Viewing Angle: 160 degree (horizontal/vertical) Native Aspect Ratio: 16:9 (widescreen) Features Audio Features Warranty: 1 year limited parts & labor |
Inputs/Outputs Included Accessories: Power cord, D-sub-to-component adapter, mini-stereo to RCA adapter, remote control, batteries, User manual Power Consumption: 495 watts (normal operation); <3 watts (standby) Languages: English, French, Spanish Dimensions: 47.9"W x 30.1"H x 3.9"D (w/o pedestal); 47.9"W x 31.7"H x 10.6"D (with pedestal) |
Pros
- Super slim display
- Possibly the most affordable 50" plasma on the market
- High measured ANSI contrast ratio
- Includes basic amplifier for optional loudspeakers
- NTSC tuner
Cons
- No RGB gain/cut in user controls
- No usable color temperature controls
- Substandard video processing for interlaced sources
- Vague and simplistic user manual
Features, Delivery & Setup
LCD, plasma, LCD plasma... So many choices, and the prices are dropping rapidly (to the dismay of non-Korean-based manufacturers you can be sure). We happened to get our hands on one of the least expensive 50-inch plasma televisions around. What we've found is that these models lack the customization, and often color accuracy, of more expensive models, but compensate by bringing large, flat-screen technology to consumers at an affordable price. The key is knowing their strengths and weaknesses and using them properly to their best advantage. With this in mind, we tore into the Optoma PD50A 50-inch plasma television and began our evaluation.
Features
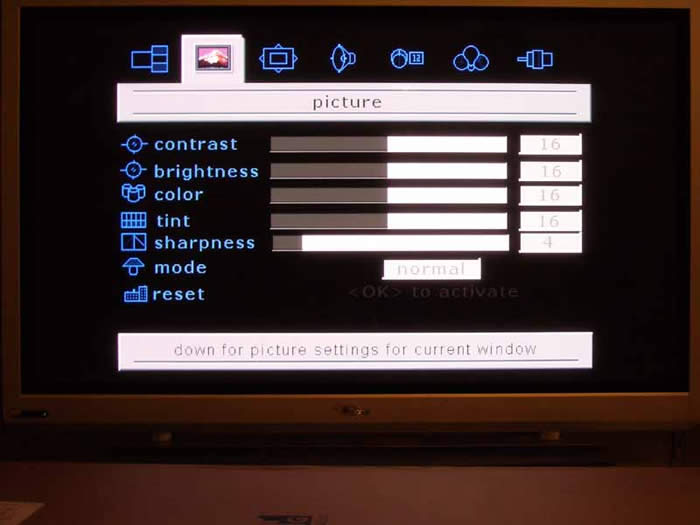
There isn't much in the way of features on this unit - this is about as bare bones as you will find in a display intended for entry-level consumers who want an affordable large screen plasma television. Settings vary per input, but in general you have access to black level, white level, color and tint controls and you can adjust audio via bass, treble and balance sliders. The MODE feature adjusts color temperature, but only slightly and should probably stay in the Cinema setting at all times. One feature I found helpful was the "Favorite Channel" functionality found on the remote control. I only watch a few television stations, so having this "on-the-fly" method of adding and subtracting a small number of channels to a navigable list was quite appealing.
Delivery and Setup
We always recommend a two-person installation when handling LCD or plasma televisions over 30" in size (OK, probably any televisions over 30" in size). The Optoma is heavy, but the box was easily lifted up a flight of stairs with the help of my lovely wife. The unit is packaged as a box-within-a-box which is generally the safest way to ship more fragile electronics and the way most larger screen televisions are shipped nowadays. The Optoma PD50A requires a pedestal stand (sold separately, batteries not included, see your store for details, etc) in order to place it on a tabletop or display stand. If you want to wall mount it, you're in luck as it has four very easy to access mount points on the back that will work with any number of universal mounts. Wall mounts typically range from $100-$300 (higher if you want something that has more movement) and the pedestal can be found for around $99. Keep in mind that the pedestal is a custom piece particular to the PD50A and third-party options are likely not compatible.
The inputs are accessible from the bottom rear of the unit (no front or side inputs or outputs are present). We found the input layout to be slightly confusing, though this isn't a big deal as most people aren't connecting and disconnecting all week long as we are. Pay particular attention when utilizing the HD1 component inputs. You will notice that on first glance you would assume that the top (back) row of green, blue and red RCA connections make up the YPbPr inputs. On this display, the Pr (red) connection is actually located below (behind) the blue RCA. Let's just say that I enjoyed some very entertaining color gymnastics when I first connected a DVD player to this display!
Before using the on-board NTSC tuner (the TV input), you'll first need to go into the TUNER menu and select either "antenna" or "cable" as the RF input source. The cable type for most people will be "standard". If you believe that your cable system will respond better to HRC (harmonically related carriers - generally tuned slightly below standard cable frequencies) or IRC (incrementally related carriers - generally tuned slightly above standard cable frequencies) then by all means select those options before proceeding. Selecting "autoset" at this point will initiate a fairly quick programming sequence whereby all available channels will be scanned and unavailable channels will be discarded (channels can then be manually added or subtracted later using the "edit channel" if needed).
PD50A Menu System & Remote Control
The Optoma PD50A correctly allows for independent user settings for each input, subject to the particular and disclosed grouping of s-video and composite connections, which make up the AV1 input.
Switching inputs is accomplished through the remote - but in an oddly quirky manner. Custom installers will want to utilize RS-232C control to make input adjustments as the IR remote commands have two separate source toggle buttons ("Video" and "Data") which make for a very non-standard interface. The Logitech Harmony 880 universal remote, for example, never really adapted to the rather odd input selection methodology and I could hardly fault the remote in this instance. The dual buttons were intended to lessen the amount of toggling that needed to be done to cycle inputs, but the result wreaks havoc with "state aware" remote controls. The way it functions is:
Video Source
- TV
- AV1 (composite & s-video)
- AV2 (480i YPbPr)
- HD1 (480i/480p/720p/1080i YPbPr)
- HD2 (VGA.HD15)
Data Source
- Digital DVI-HDCP
- Analogue DVI
Both of the component inputs can handle 480i, but only the HD1 input will support 480p, 720p or 1080i input signals. As mentioned above, all sources retain their own picture settings - a big plus and considered a requirement for any serious display. The menu system is broken up into seven icon-labeled sections for layout, picture, window, audio, options, and settings. Coincidentally, the Optoma uses a different iteration of the software found in our prior review of the Proton 37" LCD TV.
PIP/POP
This menu section controls the picture-in/on-picture and split-screen functions. There are three options. The first two, full screen and PIP, can also be cycled and accessed via the remote control's PIP button. The last involves a split screen mode. There isn't much here to shout about, but for those who enjoy using PIP and POP functions, the Optoma provides all of the basic needs. Side by side Split Screens are extremely handy with widescreen televisions as the format is more conducive to viewing two programs at once (particularly sporting events - like trying to stay abreast of two different football games on Sunday afternoon.)
Picture
Screen
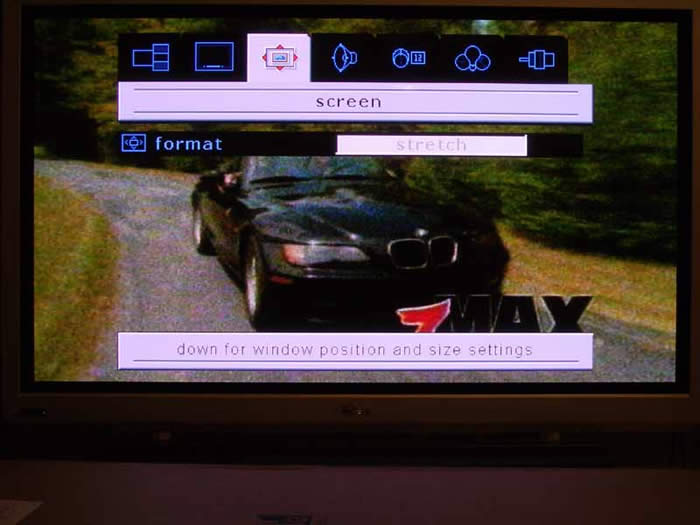 The Screen menu, like all of the menu items is contextually aware and features settings and controls for image size (controlling aspect ratio and zoom). Most of these features are self explanatory, but here is a simple description of how they affect the input signal:
- Full: This stretches the input signal to the width of the display while maintaining correct aspect ratios for DVDs. Use for 16:9 HDTV content and widescreen anamorphic DVDs.
- Native: This displays the source in a pixel-to-pixel mapped area of the screen. For DVDs, that means that approximately 720x480 pixels are utilized out of the 1366x768 available. This is a 1:1 pixel map of the source content, resulting in a nicely crisp picture; however the unused space is a significant waste of screen real-estate.
- 4:3: This scales input signals vertically to 768 pixels, resulting in a 1024x768 pixel structure being utilized in the middle of the screen with the left and right portions of the screen remaining black.
- Stretch: This is a non-linear scaling mode that takes 4:3 material and fits it to the 16:9 aspect ratio of the screen while keeping center-focused content less scaled than the outer edges. This is handy for watching television, provided there is not a ton of left to right movement.
- Wide: This mode takes the incoming signal and stretches it to extend past the boundaries of the screen. This would perhaps be a good fit for those people who absolutely hate to see black bars on movies. The sacrifice here is correct aspect ratio and some picture content.
Audio, Settings & Options
These three Setup menu areas are not in the least confusing or complicated. Audio allows adjustment of bass, treble and balance and also allows you to engage a proprietary virtual surround mode that adds some artificial spaciousness from two speakers. An MTS audio selection is also provided for SAP, mono and stereo settings. We recommend keeping the surround function off, but bass and treble controls can be utilized to provide a minor amount of broadband adjustment to help compensate for any room issues you may have such a boundary gain. The Settings menu should probably have been combined with the Options menu.,It allows language selection, setting the OSD (on-screen display) timeout and engaging of a "screen safe mode" which is a cryptic (i.e. not explained in the manual or easily experienced) function that helps alleviate image retention issues should you find that there is such a problem on your display. The Options menu, sets closed captioning (including the mode) and content blocking, or parental controls as we tend to call them.
Tuner
The Tuner menu is one of the first places you'll stop if you are planning on utilizing the television's NTSC tuner. This is where you select whether antenna or cable is entering the television via the RF input and engage the "autoset" mode to automatically locate and add active channels into the tuner. You can select cable type as we mentioned earlier to better fine tune your reception choices and you can also manually add or delete channels from those programmed during the initial "autoset" session.
Remote Control
I really liked this remote overall. I found it a bit finicky at times with regard to sensitivity and how accurately I needed to point it at the IR sensor on the Optoma plasma TV, but overall it was simple yet sufficient. The dual source buttons were a place where I felt some discontent, but only because of what it meant to universal remote control functionality. It made it nearly impossible to program due to a lack of direct inputs (and the dual buttons, while nice for the user, resulted in a somewhat confused direct-select/toggle hybrid). Every manufacturer of display devices should take note - there aren't such a terrific amount of inputs that they cannot discretely be included on the remote control. It makes macro programming so much easier and takes a load of time out of switching inputs.
Navigation, volume and channel selection buttons were well laid out and the buttons themselves, and the remote in general, had a nice feel in the hand. I am a fan of vertical channel and volume buttons, so I wouldn't mind seeing that changed, but they were not completely horizontal so it wasn't terribly perplexing to get a feel for which buttons to press for what. The entire remote is somewhat flipped from the norm, with the number pad being located at the top of the unit, but I think this actually worked quite well in practical use.
The favorite channel functionality built into the remote was a nice touch and made quick work out of skipping the 80% of useless drivel that occupies the cable TV lineup these days. Adding and subtracting channels to the favorites list was as easy as pressing a button.
There are some fun "toys" on the remote as well (in addition to PIP functions). DISPLAY shows the active source, FREEZE grabs the current image on screen and holds it, and ZOOM gives you steps of magnification (2x/4x/9x/16x) on the current input while in Full Screen mode. For those night owls, there is even a remote control-activated sleep timer that can be set to shut the TV off after 30/60/90/120 minutes.
Calibration and Benchmark Testing
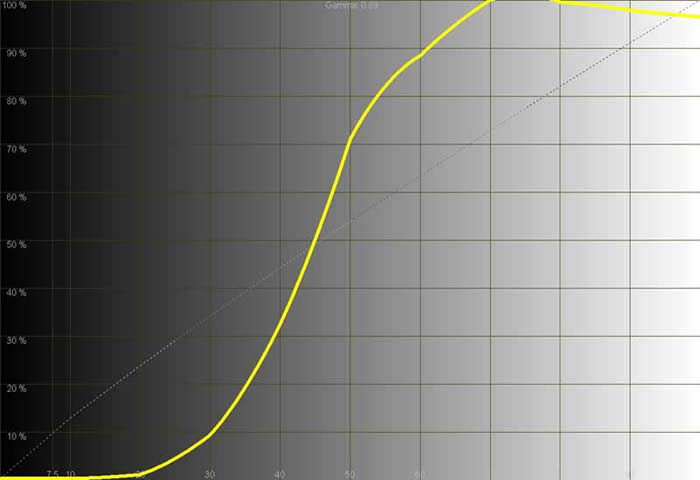
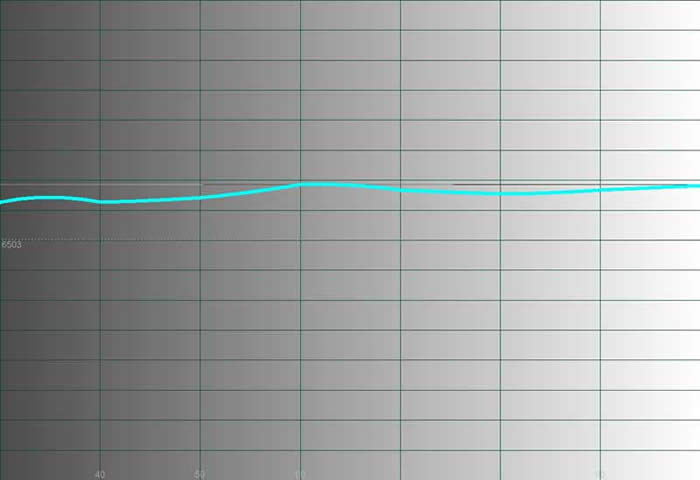
We used Datacolor's Colorfacts Professional 5.0 software to measure and help calibrate black and white levels on this plasma television. It allowed us to evaluate grayscale uniformity and contrast on the set as well as generate some telling histograms and CIE information. The interesting thing with this television is that you pretty much get what you get - at least in the user menus system. As I mentioned, we were able to set Black and White levels, but that's about it. Color and Tint were about as good as they were going to get and color temperature was not really adjustable. Since there wasn't much of a "before and after", I took the liberty of showing some extremes: namely, the default measurements on the analogue composite inputs and then the digital DVI-D inputs. We found that the DVI-D input had to have its Brightness control (black level) turned all the way down to get appropriate black levels from the AVIA Pro test disc.
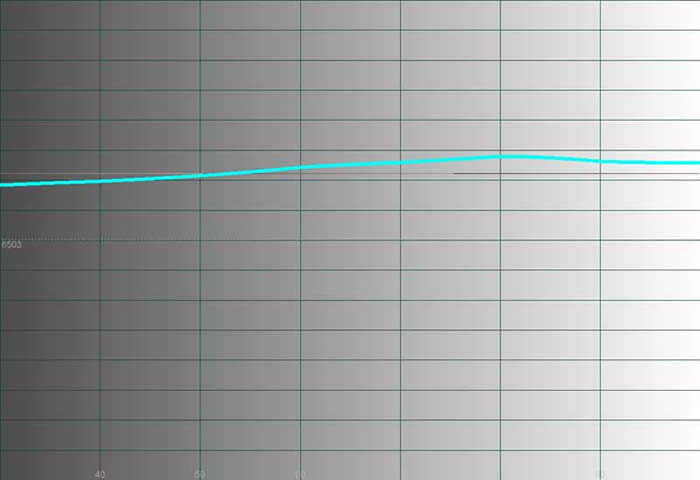
One thing to rave about is that after calibrating the black and white levels on the HDMI inputs I was able to record an ANSI contrast ratio of 1391:1! This panel has some definite ability to show commendable dynamic range.
During the calibration process I noted that I could not get a full field of 100 IRE white on the plasma display. In fact, 70 IRE seemed to be the limit due to some kind of internal mechanism designed to protect the unit from burning in or otherwise damaging the panel. Switching to a windowed pattern allowed me to complete the calibration steps needed to evaluate grayscale uniformity. For those of you who planned on buying this plasma display so you could watch full fields of 100 IRE white all day long I'm afraid you'll need to look elsewhere... for those who plan normal use - I don't think this will ever come up.
|
Composite Video Inputs (default) |
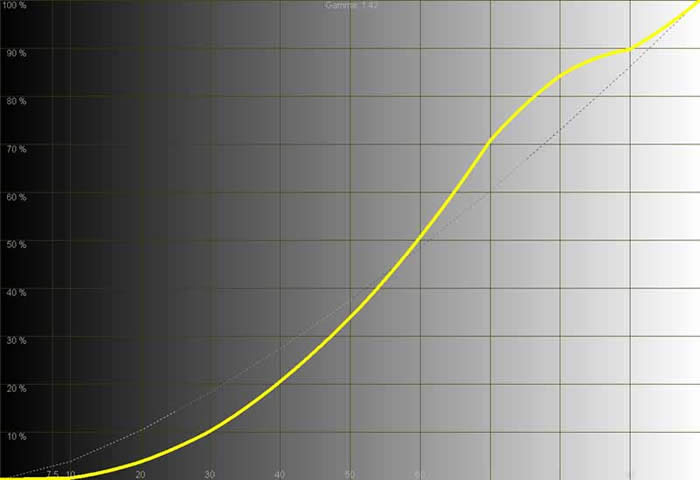
HDMI Inputs (w/B & W levels calibrated) |
|
|
|
|
The only thing worse than a runaway composite video input... |
...is a "super cool" HDMI input. I think Optoma jumped n the "bluer is better" bandwagon. At over 8500K this is one cool display. Red and green remained fairly tight. This is not uncommon. |
|
|
|
|
We do not really recommend using the composite video input of this display for obvious reasons, but then again I haven't recommended composite inputs since 1995. |
The HDMI input has a much smoother luminance histogram with a slight dip and bump surrounding the midrange. With no gamma correction available, what you see is what you get. |
|
|
|
|
The color temperature is not adjustable on the PD50A... |
...and as a result the user has to be content with a rather cool (but still pleasing) picture. If you're going to push a color, blue is not a really bad one to push as it mostly serves to give the impression that whites are really white . |

CIE Chart - Color Reproduction & Saturation Potential
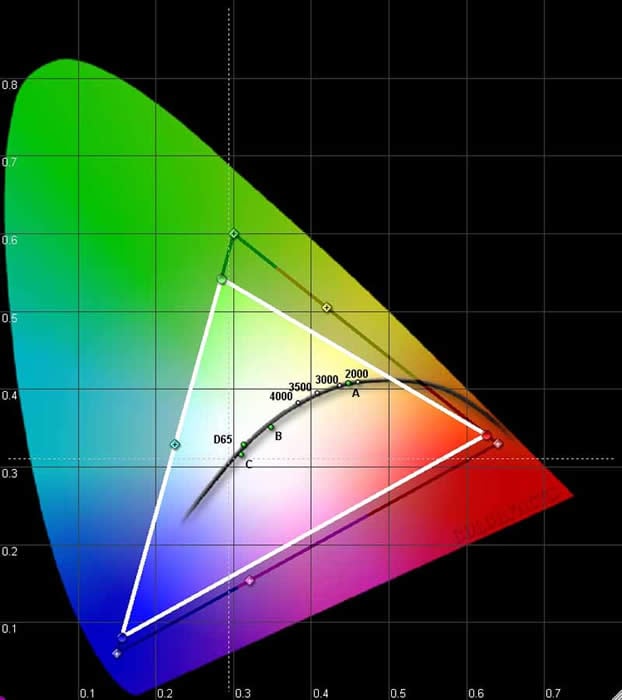
This color gamut triangle on the CIE chart determines how "deep" or "rich" the colors will be from a display. For instance, a Red primary that is too high on the chart will indicate that the display device may only be able to produce an orange-red instead of a deep red. Similarly, a Green primary that is too low may indicate that the display device will produce greens that are closer to yellow than what may be desirable. A wide color gamut indicates that the device is able to produce rich, saturated colors.
Please note that since the AVIA Pro calibration disc was used for this test, the results may be slightly different when run from a higher quality source such as a test signal generator. We chose to use AVIA Pro so that we could calibrate the entire system using the full DVD-to-television path.
Audioholics/HQV Bench Testing Summary of Test Results
Perfect Score is 130
Optoma PD50A Benchmark Score: 41 (don't expect this TV to do stellar deinterlacing or noise reduction, simply use it with a good quality source component)
|
Test |
Max |
AV2 |
Component |
HD1 |
Component |
|---|---|---|---|---|---|
|
Color Bar |
10 |
5 |
Pass |
5 |
Pass |
|
Jaggies #1 |
5 |
3 |
Pass |
3 |
Pass |
|
Jaggies #2 |
5 |
3 |
Pass |
3 |
Pass |
|
Flag |
10 |
5 |
Pass |
5 |
Pass |
|
Detail |
10 |
10 |
Pass |
10 |
Pass |
|
Noise |
10 |
0 |
Fail |
0 |
Fail |
|
Motion adaptive Noise Reduction |
10 |
0 |
Fail |
0 |
Fail |
|
Film Detail |
10 |
5 |
Pass |
0 |
Fail |
|
Cadence 2:2 Video |
5 |
0 |
Fail |
0 |
Fail |
|
Cadence 2:2:2:4 DV Cam |
5 |
0 |
Fail |
0 |
Fail |
|
Cadence 2:3:3:2 DV Cam |
5 |
0 |
Fail |
0 |
Fail |
|
Cadence 3:2:3:2:2 Vari-speed |
5 |
0 |
Fail |
0 |
Fail |
|
Cadence 5:5 Animation |
5 |
0 |
Fail |
0 |
Fail |
|
Cadence 6:4 Animation |
5 |
0 |
Fail |
0 |
Fail |
|
Cadence 8:7 animation |
5 |
0 |
Fail |
0 |
Fail |
|
Cadence 3:2 24fps film |
5 |
5 |
Pass |
5 |
Pass |
|
Scrolling Horizontal |
10 |
0 |
Fail |
5 |
Pass |
|
Scrolling Rolling |
10 |
0 |
Fail |
5 |
Pass |
|
Total Points |
130 |
36 |
|
41 |
|
Comments on HQV Testing
As you can see, the Optoma television does not contain a sophisticated deinterlacer or noise reduction engine. As such, we simply recommend that you use it with a high quality source component. If you could adjust color temperature, this display would be quite good when paired with a solid source. Obviously, you can also see that the internal video processing handles deinterlacing and mixed modes a bit differently on the HD1 inputs and the AV2 inputs. I tend to favor deinterlacing since I don't see a lot of mixed modes in real world use, so using the HD1 inputs would probably be best when using this display (even though it scored a bit lower). The HD1 input locked onto the unflagged 2:3 pull-down sequence in the film detail test (albeit slowly) whereas the AV2 inputs did not.
Viewing Evaluation & Conclusion
I took some time to look at a bunch of movies on the Optoma PD50 to determine how well it performed in real world use (plus it gets old looking at all those patterns and color fields). For all of these evaluations I utilized the DVI-HDCP inputs which I fed with a Denon DVD-5900 outputting 720p. The entire system was also connected through an APC H15 power conditioner and voltage regulator for those who feel those details matter when talking about picture quality.
DVD: Robots (emphasis on color reproduction)
With good color and terrific detail, Robots seemed like a great place to start in evaluating the color potential of this plasma display. I was blown away that a non-Pixar company could do such a fantastic job, but after Ice Age I shouldn't have been too surprised to see another hit come out of the Blue Sky Studios crew. In particular, the sequence where Rodney meets up with Fender and goes through a virtual Rube Goldberg device to get from point A to point B in Robot City was amazing. Later, when Fender took a trip to the fiery realm of Ratchet's mother, the blacks and richer, deeper colors were equally impressive. Even though I knew the color temperature was far too high, it never really distracted me in real world viewing. It actually looked quite good in this CG-based film. Those who are wanting a picture that can really pop out on the screen will not be disappointed.
DVD: Kingdom of Heaven (picture detail and pixel refresh rate)
This Ridley Scott film counts Orlando Bloom, Jeremy Irons, Edward Norton among its cast and was absolutely stunning to watch. There is so much natural detail in this film, from landscapes, to costumes, to facial close-ups that I'd have to put it up there with Lord of the Rings (but not in terms of plot or execution or necessarily transfer quality). The other thing that caused me to want to use this film as evaluation material was its abundance of fast-moving action which served as a natural source for showing the speed of the display. The Optoma PD50A seemed to do a good job of handling the difficulties of keeping up with the abundance of quickly-changing material, and I never felt as if the picture was soft or blurred due to inability to quickly refresh the pixels.
Color in this movie was not as vibrant as Robots, being more earthy in nature, but it was rich nevertheless and showed off an almost uncanny ability of the Optoma to reach in and pull out color even in very dark scenes. Blacks were black, not gray, and shadow detail was present, not muted as with many LCD displays I have seen of late. I felt the beginning of the movie with Orlando working as a blacksmith and then fighting with his father in the forest brought out the full contrast range of this television.
DVD: Hitch (picture detail and color reproduction)
Hitch is just a great opportunity to see the color reproduction potential of a television. Does it look good? Does it produce vibrant imagery from what is a very dynamic and colorful film? The answer to both questions is a resounding 'yes'. I think Will Smith's classy but diverse wardrobe alone would have been enough to see how well the Optoma PD50A did with a myriad of colorful topics. Add in skin tone, a very detailed picture with plenty of close-ups, and stir in a healthy dose of external sets and you've got some source material that is as challenging as it is fun to watch. I felt the Optoma 50" plasma TV rendered this movie in stunning color that was vivid and realistic.
Cable Television
Standard definition cable TV was displayed with satisfactory results, though high definition is what you'll want to feed this unit - preferably via the HDMI outputs of a cable or satellite set-top box. Scaling was done sufficiently well and I utilized the stretch mode quite a bit, though it could potentially distract during football games and other events where the side of the picture is utilized quite a bit and there is motion across the entire screen. Jaggies were reduced, but still present in some instances, reflecting our HQV test results. Color was well saturated and black and white levels came through with apparent accuracy.
Conclusion
The Optoma PD50A plasma television is, as we mentioned, quite possibly the least expensive 50-inch plasma display on the market (street price). For users with digital sources it's almost a no-brainer, unless you're a stickler for D65 color temperature and a perfect color profile. In that case, you'll need to spend quite a bit more money to get this much television. For the rest, the Optoma represents a plasma display that is large, attractive and will be quite impressive to your friends. If it were priced higher my reservations would be greater, but for a street price under $2500 you can't really go wrong.
Optoma PD50A
MSRP: $3749
715 Sycamore Drive
Milpitas, CA 95035 USA
http:/www.optomausa.com/
Tel: 408-383-3700
Fax: 408-383-3702
Optoma Technology, Inc.
Optoma Technology, Inc. is an award-winning developer of projection and digital display products for business and home. The company manufactures multimedia projectors for mobile users, fixed installations and home theaters, HDTVs, LCD flat panel monitors and plasma displays. Optoma products combine superior image processing technologies with exceptional engineering and innovation to deliver images that are bright, crystal clear, and finely tuned for tone and color. Optoma products are sold through the company's global network of pro AV dealers, major consumer electronics retailers and Internet resellers. Optoma's worldwide headquarters is located in Milpitas , California . For more information, please call 888-942-2929 or visit optomausa.com.
The Score Card
The scoring below is based on each piece of equipment doing the duty it is designed for. The numbers are weighed heavily with respect to the individual cost of each unit, thus giving a rating roughly equal to:
Performance × Price Factor/Value = Rating
Audioholics.com note: The ratings indicated below are based on subjective listening and objective testing of the product in question. The rating scale is based on performance/value ratio. If you notice better performing products in future reviews that have lower numbers in certain areas, be aware that the value factor is most likely the culprit. Other Audioholics reviewers may rate products solely based on performance, and each reviewer has his/her own system for ratings.
Audioholics Rating Scale
 — Excellent
- — Very Good
- — Good
- — Fair
- — Poor
| Metric | Rating |
|---|---|
| Detail and Resolution | |
| Deinterlacing & Scaling | |
| Contrast and Black Levels | |
| Color Reproduction | |
| Noise Reduction | |
| Calibration Options | |
| Build Quality | |
| Ergonomics & Usability | |
| Ease of Setup | |
| Features | |
| Remote Control | |
| Performance | |
| Value |
Clint Deboer was terminated from Audioholics for misconduct on April 4th, 2014. He no longer represents Audioholics in any fashion.
View full profile