
HSU Research VTF-3 MK3 Subwoofer Review
- Product Name: HSU VTF-3 MK3
- Manufacturer: HSU Research
- Performance Rating:


- Value Rating:
- Review Date: October 22, 2007 18:25
- MSRP: $699
Primary Use: Subwoofer
System Type: Powered, Bass-reflex
Ports: Dual 4”, flared at both ends
Amplifier Output Power: 350 Watts, rms
Phase: Switchable O° - 180°
Crossover Frequency: Lowpass, Continuously variable, 30 - 90
Hz, Bypassable
Crossover Slope: 4th-order, 24dB/Octave
Drive Units: (1) 12” (nominal) driver
Sensitivity: 90dB (2.83 Volts @ 1 Meter)
Nominal Impedance: 4 Ohms
Frequency Response: 18
-3dB (Max. Extension Mode)
25 Hz -3dB (Max.
Output Mode)
Color: Black or
Maple
Grille: Black
Video Shielding: Yes
Dimensions: 17” W x 22” H x 25” D
Weight: 90 Lbs. /unit
Max. Power consumption: 430 W
Warranty: Driver/cabinet: 7 years; Amplifier: 2 years
Pros
- Surprisingly clean output
- Excellent extension for a system this size
Cons
- Very Limited choice of finishes
- Port noise tendencies when used in bass extension mode without turbo option
Introduction
Life for Hsu Research began in 1991 with the introduction of a 7 foot (!), tubular subwoofer that featured a 12” driver perched at one end. From that beginning, they’ve grown over the years under the guidance of MIT - educated Dr Poh Hsu, to offer a variety of products. Mostly well-engineered, high value-for-dollar subwoofers, they’ve recently entered into a new market area with the introduction of non-subwoofer speaker products, such as the HB-1 bookshelf speaker, HC-1 center channel speaker, the Ventriloquist VT-12 system and the diminutive VY-254. Today, we’ll be looking at the Hsu VTF-3 Mk3 subwoofer, sporting an updated version of the Class- A/B output, tracking power supply amplifier included with the system.
First Impressions
 Right out of the box, it’s
obvious the VTF-3 Mk3 is a no-nonsense, no-frills sub. Nothing more than the
very most basic – that is, essential - controls, processing features and so
forth are found on the unit. Nevertheless, we do see some hints as to what its
performance capabilities are and where the real value of the sub lies. Take,
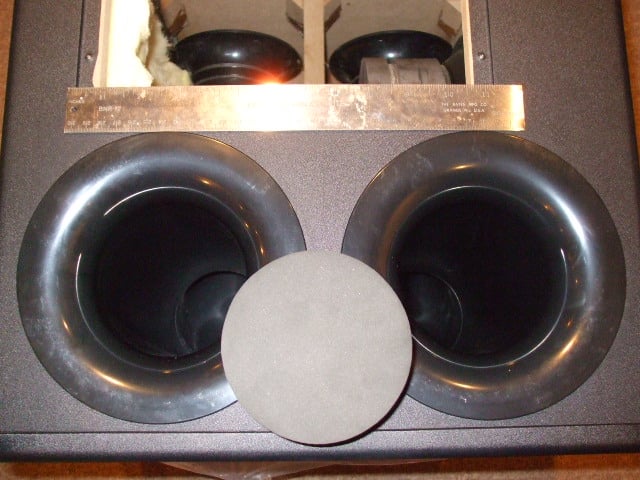
for example, the pair of 4” ducts (seen at right) found just above the amp’s
control panel on the back of the sub. 3” ducts could have been used, but
narrowing the diameter would have increased the air velocity within the ducts, (under
normal operating conditions) in turn increasing the likelihood of wind noise. In
terms of unwanted noise, the quieter a sub, the less it calls unwanted attention
to itself, allowing one to better the enjoy the music listened to or the movie being
watched. The gray disk seen in the photo, perched as it is between the two
external ports, is the plug inserted into one of the ports when you want to
switch from max. output mode to max. extension mode. Hence the “VT” or
“variable tuning” in the VTF-3 Mk3’s name.
Right out of the box, it’s
obvious the VTF-3 Mk3 is a no-nonsense, no-frills sub. Nothing more than the
very most basic – that is, essential - controls, processing features and so
forth are found on the unit. Nevertheless, we do see some hints as to what its
performance capabilities are and where the real value of the sub lies. Take,
for example, the pair of 4” ducts (seen at right) found just above the amp’s
control panel on the back of the sub. 3” ducts could have been used, but
narrowing the diameter would have increased the air velocity within the ducts, (under
normal operating conditions) in turn increasing the likelihood of wind noise. In
terms of unwanted noise, the quieter a sub, the less it calls unwanted attention
to itself, allowing one to better the enjoy the music listened to or the movie being
watched. The gray disk seen in the photo, perched as it is between the two
external ports, is the plug inserted into one of the ports when you want to
switch from max. output mode to max. extension mode. Hence the “VT” or
“variable tuning” in the VTF-3 Mk3’s name.
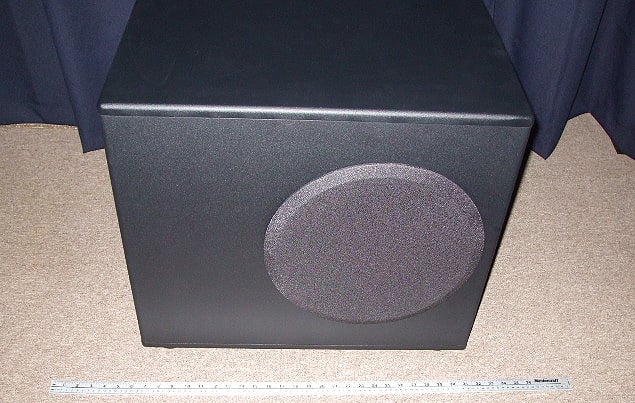
The finish, too, is a no-nonsense, no frills classic black look with a texture reminiscent of the black tolex often seen on pro audio gear. It’s pretty scuff-resistant and easy to clean. The black finish helps minimize the visual impact and being about the height of an average end table, the WAF is respected.
Setup
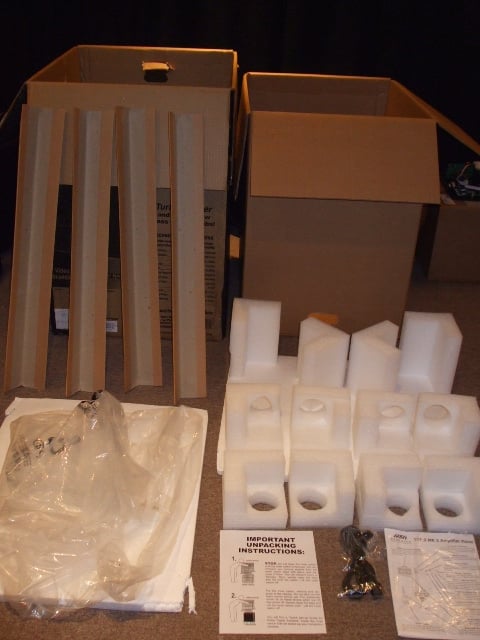 Hsu Research wants their products to arrive intact! They’ve taken the
carton-within-a-carton approach and you’ll find instructions on just how to
unpack the unit pre-placed along the way. Once unpacked, you’ll have quite a
collection of packing material (as seen at right) that you’ll probably want to
hold onto. You’ll also have before you, of course, the VTF-3 Mk3, instruction
sheet & manual, along with the sub’s power cord. Time to get busy setting
the thing up!
Hsu Research wants their products to arrive intact! They’ve taken the
carton-within-a-carton approach and you’ll find instructions on just how to
unpack the unit pre-placed along the way. Once unpacked, you’ll have quite a
collection of packing material (as seen at right) that you’ll probably want to
hold onto. You’ll also have before you, of course, the VTF-3 Mk3, instruction
sheet & manual, along with the sub’s power cord. Time to get busy setting
the thing up!
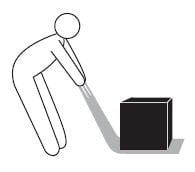
As with any sub, positioning the VTF-3 Mk3 is an important step in maximizingthe system’s performance in your listening space. As these things go, the VTF-3 Mk3 isn’t all that big. Still, moving it around in order to determine the best final position might get a bit cumbersome or awkward for you. One suggestion to make moving the sub around easier (illustrated in the manual) is to place it on a blanket or something similar. This’ll make it quite a bit easier and help make placement of your set up go quicker.
 In my case their really wasn’t
much need to experiment with positioning as all I needed do was swap out the
sub I currently use (Klipsch KW-120-THX) for the VTF-3 Mk3. Initially arriving
at the position now used by whichever sub I happen to be using at the time
however did take quite a bit of work. For the larger subs too heavy/bulky to
carry safely I tend to use a hand truck to get the unpacked item to the
listening space, then once unpacked, I tend to use the blanket trick.
In my case their really wasn’t
much need to experiment with positioning as all I needed do was swap out the
sub I currently use (Klipsch KW-120-THX) for the VTF-3 Mk3. Initially arriving
at the position now used by whichever sub I happen to be using at the time
however did take quite a bit of work. For the larger subs too heavy/bulky to
carry safely I tend to use a hand truck to get the unpacked item to the
listening space, then once unpacked, I tend to use the blanket trick.
For this review the VTF-3 Mk3 was teamed up with a Klipsch THX Ultra 2 speaker system, powered and/or managed by a Denon AVR-3806 AVR, all driven by a Toshiba HD-A20 DVD/VD transport. Measurements were taken using LinearXs LMS.
Once situated, it didn’t take long to integrate the VTF-3 Mk3 into the rest of the system already in place in the home theatre where all the listening evaluations took place. The Denon AVR-3806 AVR was tasked with the job of bass management. Audyssey was used throughout (engaged while watching movies, set to “Flat” when listening to music). For the sake of thoroughness, the part of the setup process that took place at the Denon end of the signal chain was run twice: once with the sub set to run in the max. output mode and then once again when the sub was run in max. extension mode.
Build Quality
Remove the VTF-3 Mk3’s amplifier and - after the size of the driver’s motor structure - probably the most interesting if not downright fascinating feature are the ducts (as seen below). They’re lonnnnng and bent: at a 90° angle, which really is the only way you could fit a pair of ducts, each 4” in diameter, of the length necessary to tune the particular driver/cabinet combination that makes up the VTF-3 Mk3. Having worked out some of the engineering challenges getting the air flowing correctly through that 90° bend is the subject of a Hsu Research patent, now pending.
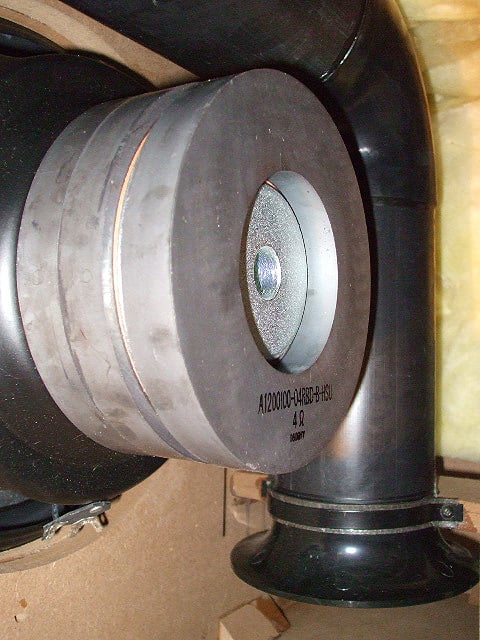
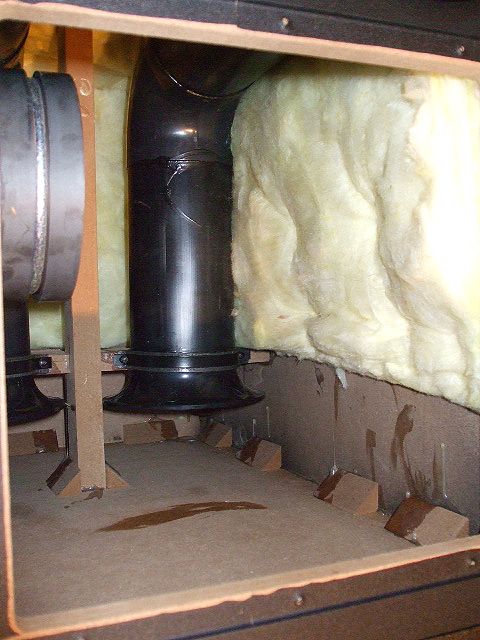
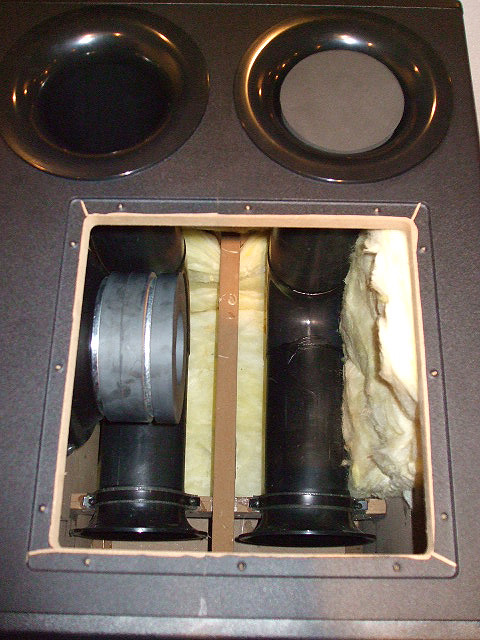
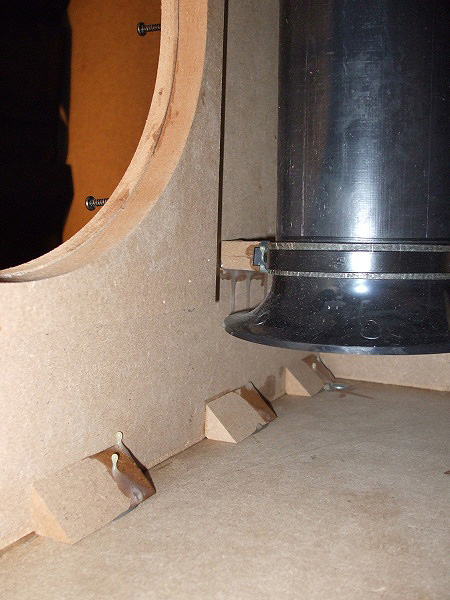
The cabinet itself comprises panels of various thicknesses, glued together, secured with glue blocks throughout, cross-braced (said bracing doubling as a mechanical support for the ducts) and lightly lined with fiberglass cladding on some of its interior surfaces. The driver (and power amp) both bolt directly to the cabinet. Hsu Research have taken steps to keep mechanical noise down, such as employing the vibration-resistant banding used in clamping the interior end of the ducts securely to the cabinet. That’s a nice, basic feature when you consider how easy it is for mechanical vibrations to set up in a sub, resulting in one of the most instantly annoying sounds ever heard! Fit and finish were very good. I found no flaws worthy of mention anywhere.
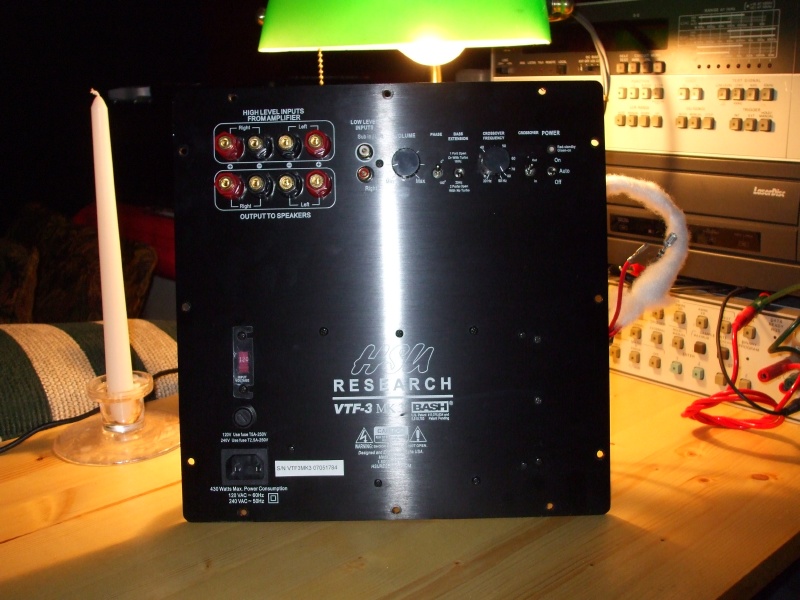
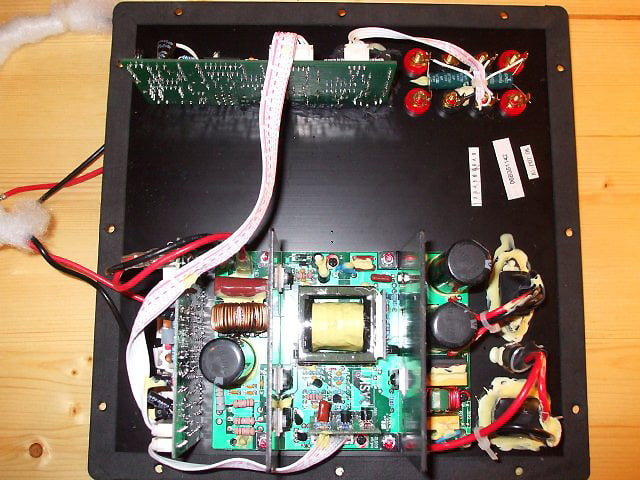
The VTF-3 Mk3 features a 350W Class-AB output stage with tracking power supply. The unit is bolted into the back of the sub and sits just below and to the right of the system’s ports. It features a 3-way power switch (On/Auto/Off), continuously low pass filter (30 Hz – 90 Hz, with 4th order/24dB octave crossover slope), crossover bypass switch, 2-way phase (0° - 180°) switch, two line-level inputs, a pair of speaker-level inputs & outputs, and a switch used for selecting either max. extension or output modes. There’s also the polarized, two-conductor power jack, user-replaceable fuse and protected input-voltage switch. This is, by the way, a new, updated version of the amp that was originally released with earlier versions of the VTF-3 Mk3. (See Figure 1b below for a comparison of the old & new amp’s transfer function).
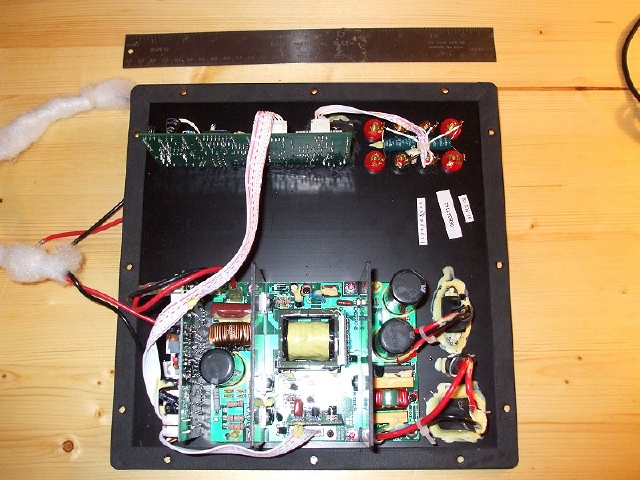
The amp is also where we again see Hsu Research’s attention to minimizing unwanted mechanical noises: where air leaks across the amp’s metal faceplate might be a problem, they’ve applied a sealant. The power leads (seen on the left side in the above, right graphic) feeding the driver itself are wrapped in such a way as to prevent any kind of noise arising they should come into contact with any internal components.
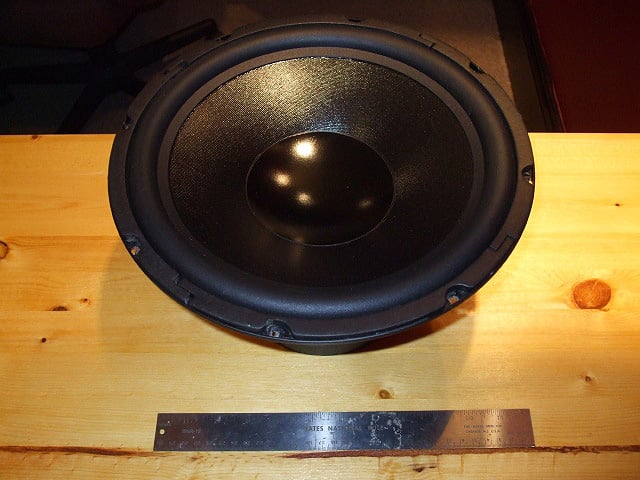
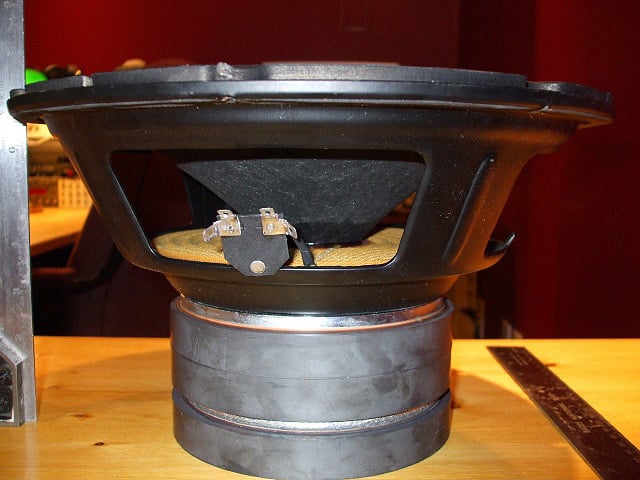
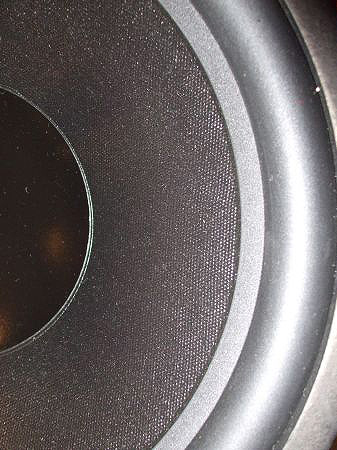
 For my money, the real star of this show is the VTF-3 Mk3’s
driver. It’s a nominal 12” unit, with a half-roll surround, and sporting a
massive vented motor assembly. Hsu Research has, from its inception, focused on
12” driver as its driver of choice and they have over the years refined their
design approach to where their products perform out to the limits of what a12”
driver can do. In the world of subwoofers it’s easy to overlook 12” drivers,
seemingly overshadowed by their 15” and 18” brethren. Underestimate the VTF-3
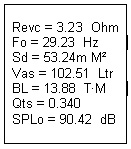
Mk3 at your own risk – this is one potent sub! For the specification-inclined I’ve
included a table with some of the driver’s T/S parameters.
For my money, the real star of this show is the VTF-3 Mk3’s
driver. It’s a nominal 12” unit, with a half-roll surround, and sporting a
massive vented motor assembly. Hsu Research has, from its inception, focused on
12” driver as its driver of choice and they have over the years refined their
design approach to where their products perform out to the limits of what a12”
driver can do. In the world of subwoofers it’s easy to overlook 12” drivers,
seemingly overshadowed by their 15” and 18” brethren. Underestimate the VTF-3
Mk3 at your own risk – this is one potent sub! For the specification-inclined I’ve
included a table with some of the driver’s T/S parameters.
VTF-3 MK3 Listening Tests
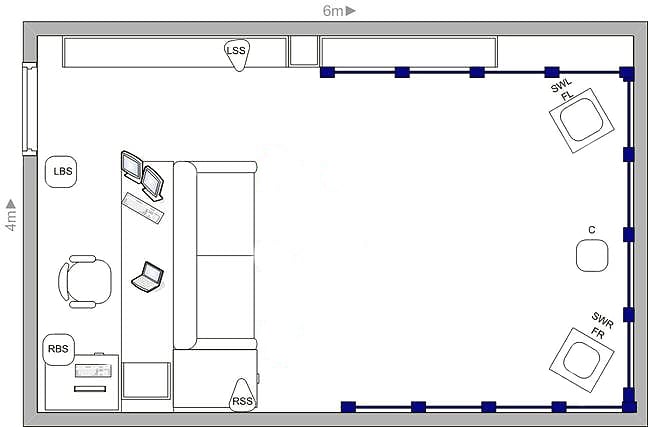
Listening was done in a room measuring approximately 6m x 4m, no windows and enclosed on all four sides, with the VTF-3 Mk3 located at one end of the room. (See illustration below). The sub was (at various times) positioned either between the front center channel speaker and the front left channel speaker or simply placed in substitution of the sub that ordinarily sat beneath the front left channel speaker.
CD: Various Artists/Composers, The Boston Audio Society Test CD-1
The first CD up is The Boston Audio Society Test CD-1, track 3 “Saint-Saëns: Organ Symphony, excerpt from second movement (Poco Adagio)”. This is a fine example of a work capable of stressing even the hardiest of subs. It’s also a track you’ll see turn up now and again in bass-freak discussions when the worst-of-the-worst-you-can-ever-throw-at-a-sub topic comes up. It’s fair to say its reputation as a sub killer is well deserved and the warning in the liner notes “When playing this track for the first time, lower the volume as your woofers may be at risk” you would be wise not to ignore.
The track begins with and features throughout melodic, pianissimo strings. Then the pipe organ gets in gear and unleashes a salvo of peddle tones that reach down to a glorious 16 Hz or so. 16 Hz isn’t something you hear, rather it’s something you feel. Some subs may confuse the issue by wheezing a pile of harmonics your way each time it attempts to plumb the depths, impressive as that may be, you’re still not hearing the fundamental 16 Hz.
With the VTF-3 Mk3 max. extension mode -3dB point very close to 16 Hz, you’ll very nearly get there, as close as the law’s of physics and Hsu Research’s design skills will allow. When presented with the opportunity, the VTF-3 Mk3’s tendency is to gracefully reach as far down into the infrasonics it can and come back in one piece. Subjectively speaking, the VTF-3 Mk3 consistently surprised anyone who happened to be within earshot at just how much bass emerged from the end table-sized box sitting at or near the front-left corner of my listening space. Overall, two words describe the music and LFE that poured from the VTF-3 Mk3: distinct & articulate.
CD: Linkin Park,
Reanimation 

Next up is Linkin Park’s “Reanimation” (Warner Bros., WEA; ASIN: B000069CWE) Another favorite, this is a great CD for assessing the qualitative aspects of a sub’s performance. Don’t expect the ultra low end stuff you find in the BAS CD mentioned above. What you can expect is a CD that will tell you just how cleanly the VTF-3 Mk3 can do what it’s made to do when not reaching down as low as it can go. The sub did a truly exceptional job, for this price class, of playing back track after track, very, very cleanly, hence the judgment that the VTF-3 Mk3’s ability to lay down bass lines that were distinct & articulate. Frgt/10 is a particularly fun and informative track in this regard.
Being a sub that just happened to be set up in a home theater, it got its workout laying down the low end for quite few movies in the time I had to getting to know the VTF-3 Mk3. Two movies that come to mind that did the VTF-3 Mk3 justice are Jarhead and Superman Returns.


DVD: Jarhead & Superman Returns
For a trip to the Land of LFE, Jarhead and the Superman Returns provide plenty of just the sort of effects you’d want from a sub when not listening to the subtleties of complex string arrangements and the like. Between the two DVDs we find plenty of ambient rumbles, rockets, and explosions and all the feel-it-in-the-gut moments that makes a sub like the VTF-3 Mk3 really shine. The percussives were clean, distinct (there’s that word again), and downright startling (not many things like the audio track of a combat scene to jack the adrenaline), even when played back at the outer volume limits of the VTF-3 Mk3. Excellent!
Recommendations
The HSU Research VTF-3 Mk3 is a well designed product, packing a terrific driver, obviously crafted with an emphasis on the basic features that are important to deliver maximum bang for the buck in a product in its price class. Within its limits, it did a number of things exceptionally well. Add to all that product support, a very useful, interesting manual and small enough to fit comfortably in all but the tiniest locales and in the VTF-3 Mk3 you find a truly top-flight product and an excellent investment for the discerning movie and music lover. Buy two and bliss out even longer!
VTF-3 MK3 Measurements & Analysis
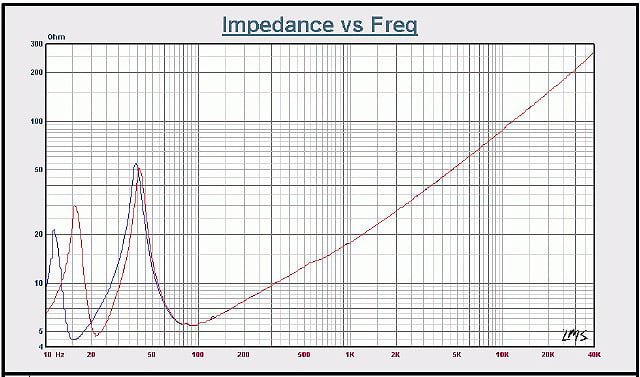
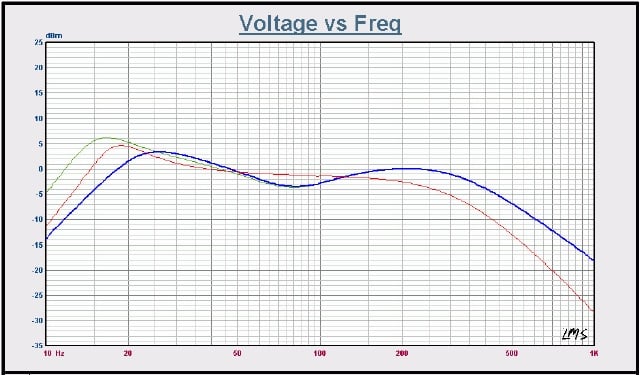
Figure 1a, b.: System Impedance at left, amplifier transfer function, at right.
The impedance curve of a system (seen above, right) can provide useful information about the system, including the presence of any pathologies that might effect its performance. The impedance scans were done with the VTF-3 Mk3’s power amp disconnected, the cable connecting the driver to the LMS card fed through one of the system’s ducts. As always, the 4-wire measurement method was used.
The red curve is the system’s impedance with both ports open (max. output mode) and the blue curve that with one port blocked (max. extension mode). At left we see the typical max-min-max curves presented by a bass-reflex or ported system. The blue curve’s local minimum at just over 15 Hz and the red curve’s local minimum at just over 21 Hz indicate the system’s native (driver/cabinet with no power amp in the circuit) tuning frequencies when set to operate in either max. extension mode or max. output mode. Further examination of the curves present no noteworthy pathologies.
At right, Figure 1b presents 3 amplifier transfer functions. The blue curve is the transfer function of the current amp, set to run in max output mode. The green curve is again for the current amp. this time set to run in max. extension mode. For comparison purposes, the transfer function of the old, original power amp (red curve) and no longer used by Hsu Research, is included.
All three measurements were made driving a single line-level input channel directly with the LMS card’s line out. (Driving both of the VTF-3 Mk3’s line-level inputs will result in a 6 dB increase in the amp’s output. (You are getting more voltage gain for a given input but the overall power limit of the amp will be unchanged).
The left most peaks for both the max extension and max output modes of the current amp have been shifted below and above the old amp’s LF speak (respectively). Both of the new amp’s curves feature a gentle roll-off immediately above their respective peaks, hitting a local minimum at around 80 Hz. Capturing data plots of a powered sub’s amplifier transfer function is a good to gain further insight to just how a particular sub functions. As a side note, if you know what a powered sub’s amplifier transfer function and you know what said sub’s dB spl response plot is, with just a bit of math you can derive thesub’s native dB spl plot.
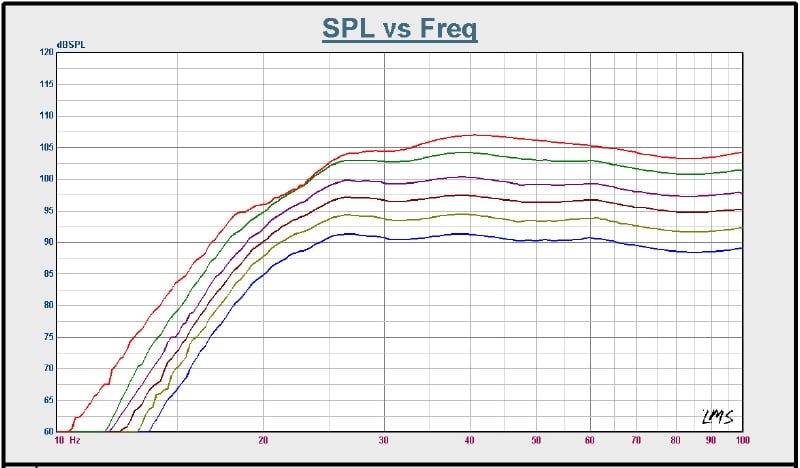
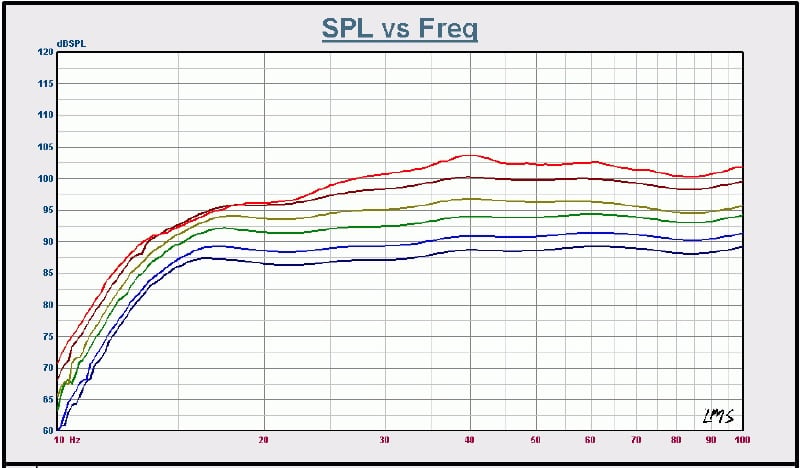
Figure 2a, b. Amplitude response plots, VTF-3 Mk3’s. At left, max. output mode) & max. extension mode) at right. 2m, on-axis, dB re 20 µPa., ground plane, no scaling. All measurements done outdoors.
In Figure 2a & b we see (at left) the amplitude response plot of the VTF-3 Mk3 when operating in max. output mode (both ports open) and max. extension mode at right (one port open). The outdoor ground plane measurement approach was used, with the LinearX M31 microphone placed 2m, on axis from the sub. No scaling or smoothing has been used. Ground plane at 2m produces results very similar to that of measurements made under anechoic conditions at 1m.
The scans in both cases were started at a drive level sufficient to produce approximately 90 dB in the passband and re-run with the drive level increased by ~ 3dB at each turn until compression significantly affected the system’s output. The phase switch was set at 0°, the crossover was bypassed and mode switch was set, of course, at either max output or extension mode. Note that at no point during measurement or listening was the optional turbo unit used (none were provided for the review). Adding the turbo, had one been available, would have resulted in a system capable of as much port-noise free sub- 20 Hz output as two VTF-3 MK3’s!
The measurements fairly well speak for themselves. We see the compression kicking in as the curves (in the mid-bandpass region) approach the 105 dB spl mark. At the higher output levels, particularly when the VTF-3 Mk3 was operating in max. extension mode (and much as Hsu Research would prefer it not to) at 16 Hz, the MK3 without turbo has port noise creeping in well before the amplifier runs out of steam. Adding the turbo (had one been available) would have effectively given about 6 dB more port-noise free output at 16 Hz. Overall, the VTF-3 Mk3 proved it self an excellent example of a well engineered product, purpose built with the intention of wringing every last drop of performance possible from a single 12” driver in a vented cabinet. Let’s see you top this one, Dr Hsu! ;-)
VTF-3 MK3 Conclusion
Over the years I’ve been exposed to many, many subs, in both
home and professional settings. Along the way I’ve encountered some truly
superb products. It’s really is easy to become spoiled once you’ve had the
opportunity to experience the very best that’s out there. So when Gene
approached with the idea to review a modestly-priced subwoofer, I was quite
prepared not to like it. Quite the opposite happened in that not only
did I like what this sub could do, but was consistently surprised by how well
Dr Hsu managed to get this thoroughbred with a 12” driver to perform – and
perform on a consistent basis. I’ll close with a strong buy recommendation; buy
two if the budget allows for it!
HSU Research
VTF-3 Mk3
MSRP: $699.00/unit; without turbo
option
http://www.hsuresearch.com
The Score Card
The scoring below is based on each piece of equipment doing the duty it is designed for. The numbers are weighed heavily with respect to the individual cost of each unit, thus giving a rating roughly equal to:
Performance × Price Factor/Value = Rating
Audioholics.com note: The ratings indicated below are based on subjective listening and objective testing of the product in question. The rating scale is based on performance/value ratio. If you notice better performing products in future reviews that have lower numbers in certain areas, be aware that the value factor is most likely the culprit. Other Audioholics reviewers may rate products solely based on performance, and each reviewer has his/her own system for ratings.
Audioholics Rating Scale
 — Excellent
- — Very Good
- — Good
- — Fair
- — Poor
| Metric | Rating |
|---|---|
| Bass Extension | |
| Bass Accuracy | |
| Build Quality | |
| Appearance | |
| Dynamic Range | |
| Performance | |
| Value |