
HSU VTF-15H Subwoofer Review
- Product Name: VTF-15H Subwoofer Review
- Manufacturer: HSU Research
- Performance Rating:

- Value Rating:
- Review Date: October 31, 2006 08:25
- MSRP: $ 879 as tested (Black finish) $999 (Rosenut finish)
350 watt “BASH” design amplifier (High efficiency & Low weight)
15” Paper Cone woofer with inverted Dust dome and foam edge
Flush-mount amp configuration
Computer Assisted Design enclosure
Cloth grill with pin-mount retention
Standard IEC detachable power cord
Cloth grill with pin-mount retention
Built in crossover with Bypass switch
Tunable porting modes
Zero or 180 degree phase switch
Crossover infinitely variable from 30 – 90 Hz
22 Hz mode Vented, 16 Hz mode sealed (Claimed not measured)
Size: 25” high x 18" wide x 26" deep.
Weight: 123 pounds
Pros
- Smart Styling and manageable size
- Very Inexpensive for performance capabilities
- Reasonable high outputs without high power
- Interesting port design making maximum use of internal volume
- “Q” control for fine tuning bottom end of woofer
- Narrow cabinet profile containing most volume in the cabinet depth
- 7 year warranty on woofer, 2 years on amplifier
- 30 day satisfaction guarantee
Cons
- Big and heavy – not easily moved by a single person (123 pounds)
- Mediocre Volume Control on Amplifier (No detents or easily repeatable settings)
- No remote control
- Plastic 5-way binding posts give amplifier a cheap appearance
- Relatively low RMS power output capabilities (350 Watt “Continuous”) limits low frequency extension
HSU VTF-15H Introduction
 The
Hsu VTF-15H is a self-powered front-loaded vented subwoofer featuring a
15" long throw driver and 350 watt amplifier with controls to allow
tweaking of the low pass crossover as well as the bottom end of the subwoofer
to optimally match it to your room and listening preferences. Weighing in at 123lbs
and costing $879 for the black finish, it was hands down, the “BEST BUY” of the
group of subs we compared. It's no
lightweight, and requires a lot of depth if you orient the box with the normal
orientation of woofer/ports facing forward. (Almost 30 inches if you plan on
actually plugging some cables into the back-plate amplifier.) Considering the
small amp employed to power the Hsu, the output with music was truly
impressive. I listened and tested the
sub as supplied, that is with both ports open.
It has strong bottom end down to about 30 Hz, very low for music, not
quite the equal of either the Rythmik FV15HP or SVS PB12-Plus DSP subwoofers
previously reviewed, but still quite impressive as long as you were not
expecting high output bottom end down to 20 Hz. I found for 99% of the music I listen to, a
cutoff of 30 Hz is more than adequate.
It is when you start to get into movie sound effects or recorded pipe
organ tones that a cutoff of 30 Hz becomes a weakness. The amplifier claims to have a peak short
term power output capacity of 1400 watts.
That sounds like an awful lot of power for an amp that does not need a
heatsink and only requires 430 watts
input power. While I did not get inside
the box to verify this, based on my listening alone, I would have to guess that
any 1400 watt “peak” is quite short in duration relative to a full 10 cycle
burst at 30 Hz (333 milliseconds). When
you examine the peak to RMS ratio for subwoofer content, it is generally higher
than what is common for full range music.
In short, you are limited MORE by the peak output of the amp, than you
are by the continuous power capability of the amplifier.
The
Hsu VTF-15H is a self-powered front-loaded vented subwoofer featuring a
15" long throw driver and 350 watt amplifier with controls to allow
tweaking of the low pass crossover as well as the bottom end of the subwoofer
to optimally match it to your room and listening preferences. Weighing in at 123lbs
and costing $879 for the black finish, it was hands down, the “BEST BUY” of the
group of subs we compared. It's no
lightweight, and requires a lot of depth if you orient the box with the normal
orientation of woofer/ports facing forward. (Almost 30 inches if you plan on
actually plugging some cables into the back-plate amplifier.) Considering the
small amp employed to power the Hsu, the output with music was truly
impressive. I listened and tested the
sub as supplied, that is with both ports open.
It has strong bottom end down to about 30 Hz, very low for music, not
quite the equal of either the Rythmik FV15HP or SVS PB12-Plus DSP subwoofers
previously reviewed, but still quite impressive as long as you were not
expecting high output bottom end down to 20 Hz. I found for 99% of the music I listen to, a
cutoff of 30 Hz is more than adequate.
It is when you start to get into movie sound effects or recorded pipe
organ tones that a cutoff of 30 Hz becomes a weakness. The amplifier claims to have a peak short
term power output capacity of 1400 watts.
That sounds like an awful lot of power for an amp that does not need a
heatsink and only requires 430 watts
input power. While I did not get inside
the box to verify this, based on my listening alone, I would have to guess that
any 1400 watt “peak” is quite short in duration relative to a full 10 cycle
burst at 30 Hz (333 milliseconds). When
you examine the peak to RMS ratio for subwoofer content, it is generally higher
than what is common for full range music.
In short, you are limited MORE by the peak output of the amp, than you
are by the continuous power capability of the amplifier.
HSU VTF-15H Product Overview
According to Dr. Hsu, “The new VTF-15H features new integrated flare triangular ports (patent
pending), variable Q control, and hybrid operation (including both sealed and
ported modes). Between the Q control, operating modes, and EQ choices, this is
the most flexible subwoofer we have offered to date, catering to virtually any
audiophile’s preferences. The new 15-inch woofer is a very low Q (0.25), low
inductance woofer resulting in very high efficiency and high headroom. Bass is
extremely tight, especially when you set the Q control to a low Q. The use of the new integrated flare triangular port allows us to get
the biggest possible port for each subwoofer. We are no longer limited by
diameter of standard size port tubes. The triangular ports tuck away nicely in
the corners of the panel, allowing a compact panel size to accommodate a large
woofer and large ports and yet provide a visually striking look.”
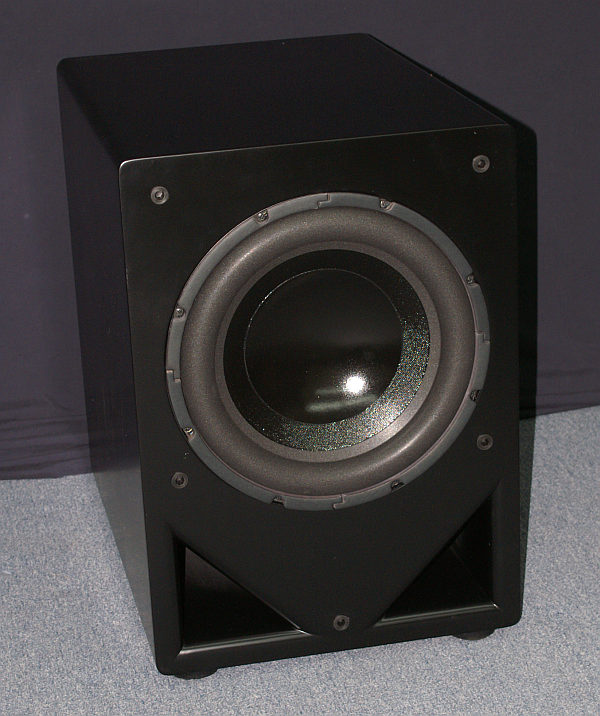
The Driver (Subwoofer)
The 15” driver used in the Hsu VTF-15H does not appear to be anything extraordinary based on either appearance or bandwidth in this box. The cone is paper, and the edge a relatively large diameter half roll foam surround, pretty standard stuff for inexpensive loudspeakers. Frankly, for a subwoofer, as long as the cone won't break from the stress of forces, anything commonly used if made of a sufficient thickness (which for different materials means a different mass of course) is going to be pistonic, a term meaning it will act like an air pump, and simply push and pull the air alternately setting up those low frequency waves we enjoy so much. Even paper is hard enough to be acting like a simple piston (what you want) at subwoofer frequencies. This of course raises the question, why use aluminum or polypropylene or something exotic? Well, if the aluminum is coupled to the voice coil by a thermally conductive bobbin, that will add lots of heat sinking. Paper just burns if you get it too hot. Polypropylene will either melt, or come unglued. Of course, paper lacks sex appeal, and sometimes that is what marketing asks for. If it is new, it must be better right? The foam surround is plenty wide enough to not mechanically limit the travel of the woofer, and given the relatively high cutoff in this box, a reasonably large one occupying more than 5 cubic feet, unless you start putting 1400 watts of power in at 20 Hz with both ports open, I doubt this woofer will strain. Listening tests (read further) confirm.
The Amplifier
Actually, I was quite surprised to find the
amp b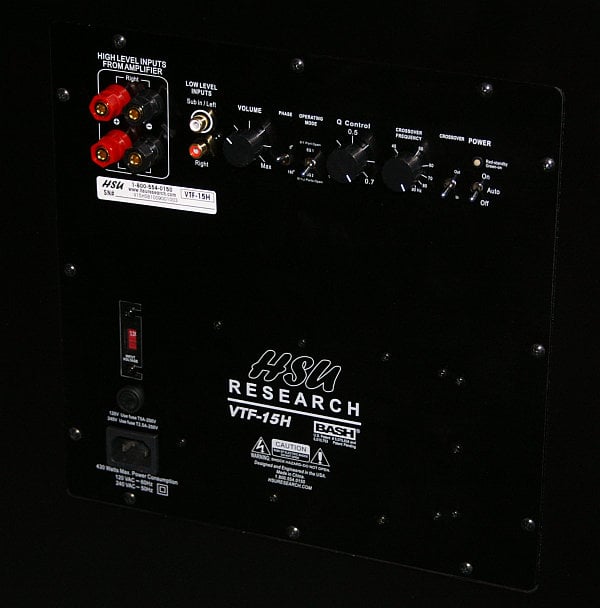 eing used with the Hsu was a BASH design.
I will admit my bias against the company, yet I found it had the ability
to drive the Hsu sub to considerable volume levels in a very large room. My
experience in the past with BASH amps, has been less than encouraging, but I
have no negative
eing used with the Hsu was a BASH design.
I will admit my bias against the company, yet I found it had the ability
to drive the Hsu sub to considerable volume levels in a very large room. My
experience in the past with BASH amps, has been less than encouraging, but I
have no negative
comments to make about the finesse and skill which was used to adjust the maximum output of this amp so that there were no hard clipping or compression artifacts audible enough to make me complain. Anyone who knows me well will be quick to inform you that making me complain does not take a whole lot of effort or much in the way of an error.
My first complaint with the amp is that the potentiometer action felt rather soft or loose. Not the feel you would expect from a high end product control, but when you price subs at these points, you have to count the pennies as well as the dollars.
My biggest criticism of the amplifier was the fact that we are only given a very limited range of Low Pass frequencies to use. (30 – 90 Hz) Limiting the top end of the Low Pass to 90 Hz, means that this sub should not be used with very small satellites tops (those using a single 4 or 5.25” midbass driver) unless you have an outboard bass management system to allow you a more suitable crosssover point than 90 Hz. Since it would not have cost a dime to increase the frequency range of the Low Pass, and since the sub is clearly able to go up well above 90 Hz, I must assume the reasoning was that it is better to offer the user finesse and finer control within the range of 30 to 90 Hz (since most potentiometers are limited to a rotation of 300 degrees) rather than to offer the user the option of a higher crossover point.
While not the path I would have taken in the design of this product, I will bow to Poh Hsu's expertise on his own market, and assume of the majority of the buyers for this product will have full range systems having no problem with an 80 Hz crossover point or simply don't own small 4 or 5 inch full range tops that would benefit from that higher crossover point. It is also possible the majority of those purchasing this subwoofer will have an external bass management system, and so be prepared for almost any combination of components.
Like with all subs used in a home theater environment, we highly recommend utilizing the internal bass management and level control of your A/V processor and either bypassing the sub's internal filters or using them in conjunction (if needed) to ensure the best integration with your speaker system.
If you plan on using the Hsu with a bass management system, and are new to them, Gene DellaSala has written some excellent articles on this topic, which can be found here:
Hometheater Multiple Subwoofer & Setup Guide
Bass Management Basics - Settings Made Simple
Basic Subwoofer Setup Guide Not for Dummies
HSU VTF-15H Measurements & Analysis
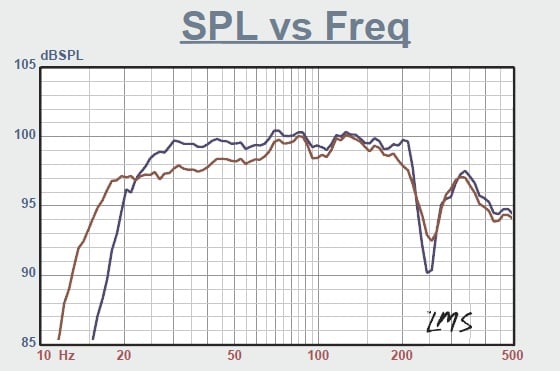
The first part of testing was to measure the frequency response from a modest output, all the way to the point where the system was clearly compressing and had hit the output wall, so to speak. I must admit, using the CLIO unit in this way, is a bit like using an elephant gun to shoot down mosquitoes. CLIO is an incredibly powerful and accurate instrument capable of taking a huge number of valuable metrics for characterizing an audio system. That said, on to our audio 101 exam of the Hsu Subwoofer. With the crossover control bypassed, the “Q” control set to 0.7 (meaning maximum bass), both ports open, and the “Operating Mode” switch set for both ports open, (Higher cutoff frequency) the following curves were run.
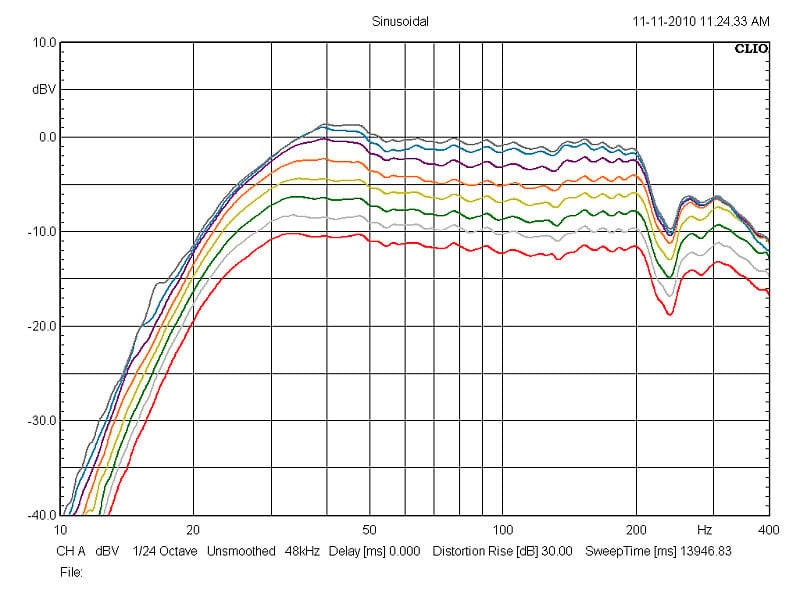
Hsu Research VTF-15H Frequency Response at Various Output Levels
Without compression, the level difference between the two top curves, the dark gray and the blue, should be the same db difference as between the two lowest curves, the red and the light gray. Since the power output is not limitless, at some point, the input is compressed, and a 3 db increase in input does not result in a 3db, or even a 2db increase in output. That, in essence, is compression. That is also the point to be understood and taken away from the above collection of curves. What is also noteworthy about this is that this is LONG TERM CONTINUOUS power, not instantaneous or peak power. This sweep starts at a very high frequency (for a subwoofer) 400 Hz, and slowly (14 seconds) sweeps down to 10 Hz. Notice the top curve starts to head south (lose output) near 40 Hz, while the lowest red curve hangs in there all the way down to 30 Hz before starting to fall off. Once again, we see here that compression is not a frequency independent event, but rather starts at a higher frequency for a higher drive level as shown in the above curve.
What can also be gleaned from the Clio curve above is that the port anti-phase is well above the bandwidth of the speaker with both ports open, so this subwoofer can do rather well with a higher crossover point as the response up to 200 Hz is ruler flat. So much of a problem in some of the other cabinets was, with both ports open in the Hsu, pushed well outside of the passband, and not as severe in its effect. This is in part due to the port geometry, and (I would assume) also in part to the shorter length of the ports needed to tune a larger box to about 22 Hz.
This slight underdamping of this woofer in this box was evident in listening tests, and the “Q” control supplied with the amplifier did not seem to make any perceptible difference with both ports open while listening to music. Now having seen the curves, I can imagine it would have been immediately apparent with pink noise. In short, without a bass management system and measurement gear on hand, tuning the optimal Q by ear alone would be a daunting task.
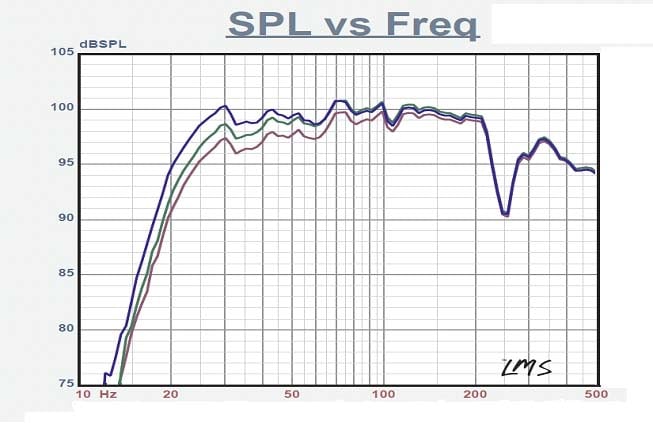
Effect of Q Control on Output of System as Measured by Hsu Research
While seen from the Clio curve, although not
apparent in the Hsu Resarch curve is that there is a slight rise at the bottom
range of frequencies suggesting this woofer might have been more optimally
damped (at the expense of some maximum output) with the optional foam plugs Hsu
includes than with both ports open.
While I did not take such a measurement, Dr Hsu was kind enough to
provide his to me which is reproduced below
Effect on Output when Triangular Foam plugs are used to lower Box tuning
This curve clearly shows the adjustment made by the “Q” control allowing one to tweak the box slightly tilting the curve to better adjust the response in room. If you look closely, you can see that the foam decreases the system Qts, lowers the cutoff frequency (with notable loss of output) and changes the rate of slope below resonance (port is less effective as reducing cone output below Fb). You can also notice the foam damps the antiphase output from the ports at 250 Hz.
Unfortunately we had time to only measure and listen to one mode (all ports open). As seen in the curves provided by the manufacturer, the one port open mode should provide true below 20 Hz extension (at reasonable SPL levels), an overdamped response (gentle downward sloping response), with stronger output at 16 and 20 Hz, but slightly less output in the 25 - 32 Hz range (port output actually cancels woofer output at 16 and 20 Hz in the two ports open position). With this model, you can choose your own set of compromises. When listening to music that does not require as much bass headroom, but you want very tight sounding bass, set it to one port open or sealed mode. When you are watching movies with lots of sub 20 Hz, set it to one port open. When you watch movies or listen to music that does not have sub 20 Hz content but want the most visceral impact with minimum compression artifacts, use the two port open mode (and set to lower Q if you want a tighter bass).
CEA-2010 Test Results
On to the CEA 2010 testing. CEA testing was performed with both ports wide open (response as shown in Clio) for achieving maximum output over the majority of the subwoofers bandwidth at the cost of a small amount of output at 20 Hz. To understand the meaning behind the graphics below and testing methods used, please refer to the prior article (Subwoofer Shootout Measurements Overview) on this method. The process is a simple one. Drive the input to the system to the point where either the amp, its compressor, or its speaker simply refuses to give you more output, or the distortion created at that output level exceeds the CEA “redline”. In EVERY system tested, the result (if not the peak SPL) was similar in one regard. At the highest frequencies in the sub's bandwidth, we ran out of amplifier power, or the compressor refused to put out more power than the amp could cleanly deliver. At the lowest frequencies, the subwoofer runs out of excursion. This is completely normal and what is to be expected. It may also explain why the CEA standard does not bother testing higher than the center frequency of 63 Hz. Below is a spectrum capture of the Hsu Research VTF-15H system at maximum usable output for each of the standard 1/3rd octave centers from 20 – 63 Hz.
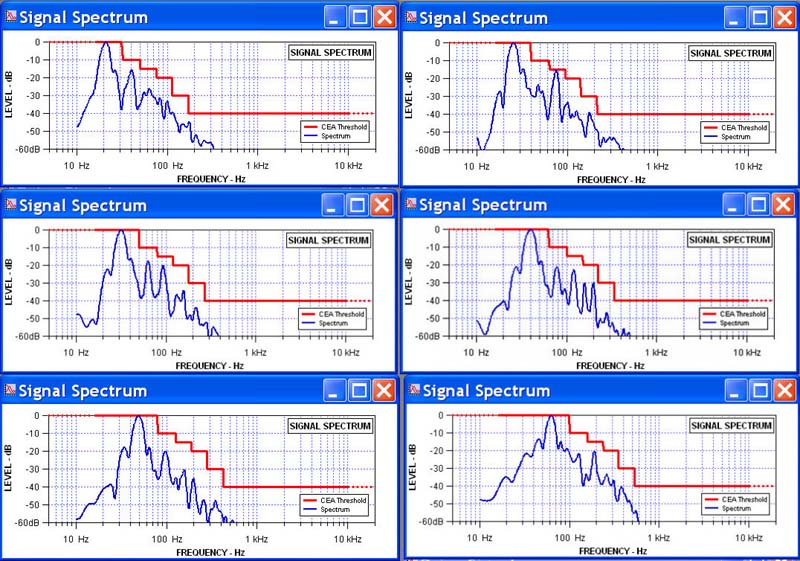
Hsu Research VTF-15H CEA-2010 Distortion Test Results
| Hsu Research VTF-15H | CEA Test Performance | |
| Frequency | Maximum Peak SPL @ 1 Meter | RMS @ 2 meters |
| 20 Hz | 112.9 dB | 103.9 dB |
| 25 Hz | 118.8 dB | 109.8 dB |
| 32 Hz | 122.0 dB | 113 dB |
| 40 Hz | 124.7 dB | 115.7 dB |
| 50 Hz | 124.7 dB | 115.7 dB |
| 63 Hz | 124.6 dB | 115.6 dB |
Max SPL Output Data of the Hsu Research VTF-15H Subwoofer
Why not test this speaker up to 80 Hz? Surely it is important, no? Yes of course. Two primary reasons I believe that the CEA standard excludes an 80 Hz measurement. Any large sub will be amplification limited by the time it is going as high as 63 Hz. Looking at 80 Hz will add little to the value of the testing. The reason the Hsu Research VTF-15H sub limits at 121.7 to 121.6 Db from 40 – 63 Hz is not simple coincidence. This is the point at which the amplifier “runs out of gas”, in this case the compressor itself puts on the brakes to continue the analogy. Going higher in frequency should not yield a different result with any real serious subwoofer. Let's also bear in mind the CEA pulse signal centered at 63 Hz is only 3dB down at 80 Hz, so if the sub was falling off that low it would affect the 63 Hz measurement as well. Differences in testing of less than a db in these circumstances should not be viewed as meaningful. The 0.1 db loss at 63 Hz was likely an effect of a very minor amount of VC and/or amplifier heating as the procedure I used was in testing from lowest to highest frequency.
Update: 2/16/11:
We ran a complete battery of new measurements and analysis on various port tuning modes and configurations
HSU VTF-15H Review Supplemental
Update: 9/27/11:
In order to make it easier for our readers to compare our CEA data between subwoofers tested prior to our new Subwoofer Measurement Protocol, we scaled our 1 meter peak CEA data to 2 meter RMS by subtracting 9dB for each frequency. We also added +3dB to the 1 meter test data to represent true peak output performance.
HSU VTF-15H Listening Impressions
I was really surprised to get as much output from the Hsu as I did. While it could definitely play loud enough to satisfy my need for high SPL's in even my very large laboratory, it did not posses the high damping at the lowest frequencies I prefer. I have become used to hearing from more expensive and heavier subs made for high outputs typically used in the professional industry. (Yes, I am spoiled rotten). These subs often have overdamped responses at low volumes to compensate for the considerable heating effects from hours of constant use by the typical DJ trying to blow his audience away. I was not expecting too much from the BASH amplifier, but despite that, I found it performed well, and more importantly I found Hsu's approach to his system design with limited power preferable to a “GO DOWN TO 20 Hz at all costs” approach, and to hell with the sensitivity. The VTF-15H was clearly a well compromised effort based on maximum performance for the dollar. While the output was sufficient, I would not describe the bass as tight or well controlled. (With a different tuning option, i.e., use of the supplied foam plugs, that opinion might well change). Frankly it had the sound of a speaker, that was compromised in terms of not having enough motor force (BL) (read magnet, metal and voice coil) to adequately damp the cone motions without a hint of ringing. Bear in mind also, that this effect increases beyond the steady state measurement whenever the system is driven to or near its output limits. I would like to have had a bigger motor on the woofer for greater control than what I had. This correlates well in my mind with the CLIO curve which shows the slightly rising low end with both ports open. When I rotated the control down to the 0.3 position (lowest Q and highest damping), I frankly noticed no improvement in the sound. It might well be both audible and measurable, but I didn't hear it using music as a source.
Application
 Because of the relatively small amount of
amplifier output, I believe it would be best applied with music or home
theater, limited, as it was during the test to having both ports open. Performance down to 20 Hz, even for a large
system, is going to require a bit more horsepower than this amp is capable
of. It is of little use to have a
speaker which goes down to 20 Hz, and then find at maximum amplification, the
SPL produced makes just enough 20 Hz to break the barrier of audibility. What of dynamic range at 20 Hz? How do we pick it out from the inevitable
harmonics that are going to accompany it in music? In the “professional” end of the market, it
is not at all uncommon to see bands and PA's using big 18” speakers which get
cut off at 50 or even 60 Hz, for the simple reason, they simply want the most
loudness physically possible. In music
(as opposed to Home Theater sound, specifically movie soundtracks) with few
exceptions, most “bass” is between 50 and 100 Hz. This combination of driver size, (15”),
amplifier power (350 “continuous” watts) and box size seems to want to
naturally roll-off slightly below 30 Hz, and none of the music I played seemed
thin or wanting bass because of it. This
box (in my opinion) is best for music, and while it will work for home theater,
if you absolutely have to get that 20 Hz tone in your living room, be prepared
to spend more $$ and get a system with a bigger amplifier, or do as Dr Hsu
recommends and place the box in the room corner if at all possible. Perhaps HSU will consider offering a hot rod
version of this product (bigger amp, bigger driver motor) at a slight cost
adder to those bass heads really wanting uncompromised true 20Hz
extension.
Because of the relatively small amount of
amplifier output, I believe it would be best applied with music or home
theater, limited, as it was during the test to having both ports open. Performance down to 20 Hz, even for a large
system, is going to require a bit more horsepower than this amp is capable
of. It is of little use to have a
speaker which goes down to 20 Hz, and then find at maximum amplification, the
SPL produced makes just enough 20 Hz to break the barrier of audibility. What of dynamic range at 20 Hz? How do we pick it out from the inevitable
harmonics that are going to accompany it in music? In the “professional” end of the market, it
is not at all uncommon to see bands and PA's using big 18” speakers which get
cut off at 50 or even 60 Hz, for the simple reason, they simply want the most
loudness physically possible. In music
(as opposed to Home Theater sound, specifically movie soundtracks) with few
exceptions, most “bass” is between 50 and 100 Hz. This combination of driver size, (15”),
amplifier power (350 “continuous” watts) and box size seems to want to
naturally roll-off slightly below 30 Hz, and none of the music I played seemed
thin or wanting bass because of it. This
box (in my opinion) is best for music, and while it will work for home theater,
if you absolutely have to get that 20 Hz tone in your living room, be prepared
to spend more $$ and get a system with a bigger amplifier, or do as Dr Hsu
recommends and place the box in the room corner if at all possible. Perhaps HSU will consider offering a hot rod
version of this product (bigger amp, bigger driver motor) at a slight cost
adder to those bass heads really wanting uncompromised true 20Hz
extension.
Dr. Poh Hsu and his company have written an excellent manual for how to position a subwoofer in a room, and in it makes a suggestion which makes a great deal of sense for a single sub system, and is applicable to ALL subwoofers made for home use. PUT IT RIGHT NEXT TO YOUR LISTENING CHAIR. This approach should minimize the room, maximize the direct to the reflected sound, and since the bottom end of the sub usually has the greatest group delay (time shift as delay) putting a single sub next to the listener makes a great deal of sense as an approach for maximum output where a corner is not available.
If you want to check out the online user manual, it is available here: http://www.hsuresearch.com/products/VTF-15HSubmanual.pdf
In addition to the full blown user manual, Hsu Research offers a very smartly written quick start guide, so that anyone in a big hurry to start using his new sub is not going to have to read hundreds of pages of manual just to figure out what each control does. That guide can be found at the same link (above) as the manual, and is located in the box titled "Brochure" along with the full manual.
Overall Product Impression
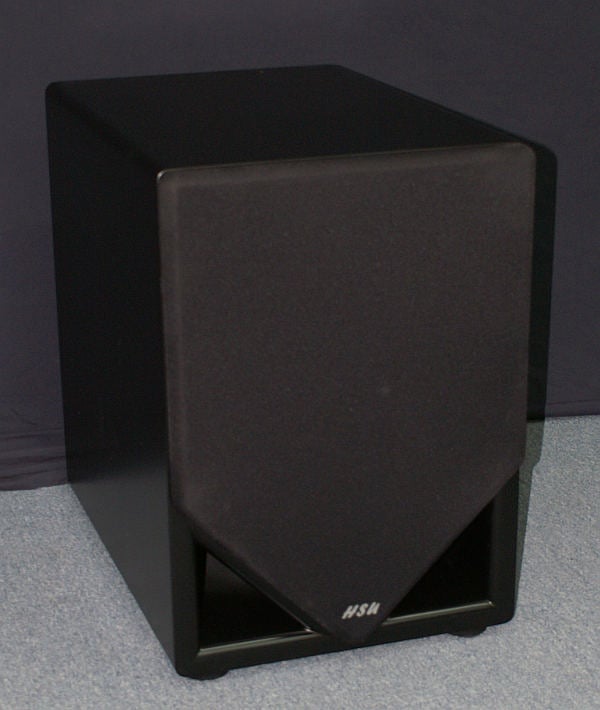
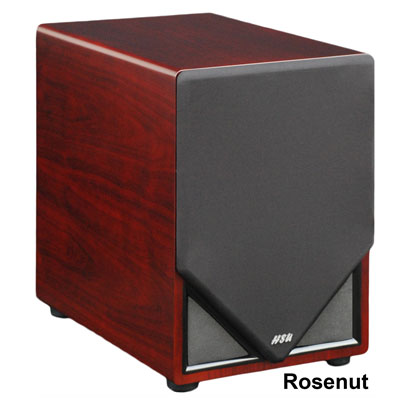
Visual
The Hsu sub as submitted had a smooth black finish, neither attracting attention nor warranting special notice. There were no issues to be seen with the cabinet finish, and I found the dual V shaped ports at the bottom of the cabinet both sound from an engineering standpoint, as well as visually appealing. If you have the room for it, there is not too much chance it is going to clash with any of your furniture or draw much attention to itself. What I liked most was that it's styling of the ports and grilles was both unique and attractive. During his visit to my laboratory, I was informed by Dr Hsu, that the "Rosewood" would be available at a $999 price point. For some reason, the $999 model is called "Rosenut" on the website. (It looks like Rosewood!) Likely for the same reason that Champagne is called sparkling wine when the grapes are grown in California instead of the Champagne region of France, but I should leave that explanation to Dr. Hsu.
Points in Favor of the Hsu VTF-15H Subwoofer
Strong engineering, excellent integration of the sub with the power amp and cabinet, and a surprising amount of output from the system given the relatively low output capacity of the amplifier used. We have to remember under IDEAL conditions the fact that a 1db increase after 250 watts is 70 watts, after 320 watts Is 80 watts, after 400 watts is 100 watts, and as we try to put more and more wattage through the VC, the heating of the copper causes the speaker to grow less and less efficient. While high power is necessary and desirable for short bursts (especially for subwoofers) in the long term it is simply heating up the voice coil and lessening the lifetime of your product. Considering the relatively low cost of the product, one could opt for purchasing two VTF-15H's if more output is desired. We are champions of multiple subwoofers for better and smoother bass distribution across the entire listening area. Just make sure your spouse can handle two of these behemoths sitting in your living room.
Criticism of the Hsu VTF-15H Subwoofer
As I mentioned before, the bass did not have the tightness and control of the more expensive, higher powered and lower tuned models tested. The conclusion I kept coming to was for the higher tuning, the system would have benefited from use of a lower Qts (read bigger magnet or higher BL). I did not find the “q” control knob on this amp to be particularly useful, or at least offer me enough in the way of response modification over its range of motion that it justified its existence. For SURE, I would have preferred to have a wider range of control over the included crossover so I could have run the sub up to a higher crossover frequency. If the Clio curves showed anything, it is that this sub is very well suited to be used with smaller satellites at a higher than normal crossover frequency. Again, that would work better with more power, but at this price point, I am nitpicking.
HSU VTF-15H Conclusion
 As an engineer whose entire career has rested
on product development, and having designed dozens if not hundreds of powered
subwoofers since the late 80's, I can say without reservation the Hsu Research
is an excellent effort on a shoestring budget.
It is always a greater challenge to an engineer to create a good
sounding product on a budget, than to be given a set of performance parameters
and say, "well, it cost what it cost" when he is finished. That kind of engineering is becoming more and
more rare to be truthful, so with money tight, and everyone looking for a
bargain, anyone in the market for a $900 to $1000 subwoofer would be foolish to
not consider the Hsu Research VTF-15H.
It is an excellent example of what can be done when you attempt to
squeeze the last bit of performance from a modest budget. My only reservation with the product is the
amplifier reliability. Without a
heatsink, the long term life of this may be a question. Still, with a two year warranty, that gives
you plenty of time to pound it and know if if burns up, Hsu Research will honor
your warranty. That said, if you
expect high outputs and intend to drive the sub like a drunken college student
at a frat house party, it might be better for your neighbors if your amp does
blow the fuse.
As an engineer whose entire career has rested
on product development, and having designed dozens if not hundreds of powered
subwoofers since the late 80's, I can say without reservation the Hsu Research
is an excellent effort on a shoestring budget.
It is always a greater challenge to an engineer to create a good
sounding product on a budget, than to be given a set of performance parameters
and say, "well, it cost what it cost" when he is finished. That kind of engineering is becoming more and
more rare to be truthful, so with money tight, and everyone looking for a
bargain, anyone in the market for a $900 to $1000 subwoofer would be foolish to
not consider the Hsu Research VTF-15H.
It is an excellent example of what can be done when you attempt to
squeeze the last bit of performance from a modest budget. My only reservation with the product is the
amplifier reliability. Without a
heatsink, the long term life of this may be a question. Still, with a two year warranty, that gives
you plenty of time to pound it and know if if burns up, Hsu Research will honor
your warranty. That said, if you
expect high outputs and intend to drive the sub like a drunken college student
at a frat house party, it might be better for your neighbors if your amp does
blow the fuse.
High performance at low power does indeed come at a price however, SIZE and weight. Unless you enjoy lifting 125 pounds at a time by yourself, I suggest you have a friend or two handy to help move it into your listening room. Of course before soliciting for some extra muscle, make sure you know exactly where you want to place this cabinet. This is not a portable product. Your cleaning lady is not going to lift the corner to vacuum under it. Make sure, you have the space, and know where you are going to plant it. The physics of making loud low distortion bass demand this kind of size and weight, so be prepared for it.
Hsu VTF-15H Subwoofer
Review
$879 as tested (Black finish) $999 (Rosenut finish)
Hsu Research
985 N. Shepard Street
Anaheim, CA 92806
1-714-666-9260
About
Hsu Research
HSU Research, Inc.
began as a specialized deep bass research company in 1991. Dr. Poh Hsu started
the business shortly after receiving a PhD in engineering from MIT. He moved to
Orange County, California with the dream of making the world’s best subwoofers. More information about Hsu Research can be
viewed at: http://www.hsuresearch.com/faq.html#2
The Score Card
The scoring below is based on each piece of equipment doing the duty it is designed for. The numbers are weighed heavily with respect to the individual cost of each unit, thus giving a rating roughly equal to:
Performance × Price Factor/Value = Rating
Audioholics.com note: The ratings indicated below are based on subjective listening and objective testing of the product in question. The rating scale is based on performance/value ratio. If you notice better performing products in future reviews that have lower numbers in certain areas, be aware that the value factor is most likely the culprit. Other Audioholics reviewers may rate products solely based on performance, and each reviewer has his/her own system for ratings.
Audioholics Rating Scale
 — Excellent
- — Very Good
- — Good
- — Fair
- — Poor
| Metric | Rating |
|---|---|
| Bass Extension | |
| Bass Accuracy | |
| Build Quality | |
| Appearance | |
| Dynamic Range | |
| Performance | |
| Value |