
SVSound SB12-Plus Review
SVSound SB12-Plus
- Product Name: SB12-Plus
- Manufacturer: SVSound
- Performance Rating:


- Value Rating:
- Review Date: October 10, 2006 20:00
- MSRP: $ 699 (Vinyl) $749 (Veneer)
Sensitivity (2.83 V/1m): 86.5 dB spl
Amp. Power: BASH© High-efficiency 425W hybrid-class, digital-switching power amp
Rated Impedance: 4 Ohms
Frequency Response (+/- 3, -6, -10 dB): 22 Hz (-3 dB) - 300 Hz (+ .2 dB); 20 Hz (-6 dB) - 300 Hz (+ .2 dB); 19 Hz (-10 dB) - 300 Hz (+ .2 dB)
Bass Principle: Acoustic Suspension
Cabinet Dimensions (W x H x L): 13.5"x 13.5"x 13.5" (342.9mm x 342.9mm x 342.9mm) without grill cloth
Active Processors: Crossover: active lowpass filter,
variable,40 - 120 Hz
Parametric EQ: Variable Q (.1 to .9 octave), variable
attenuation level (0 to -12 dB), and variable frequency (20 –80 Hz);
Variable
phase (0 –180 degrees), and Room Compensation (variable slope highpass filter)
(Small, Medium, Large Bypass)
Connection: Line Level: RCA & XLR jacks; speaker level: 5-way, gold-plated binding posts
Recommended Placing: Corner placement suggested
Shipping Weight: 40 lbs (18.1 kg)
Pros
- Near-20Hz -3dB point in a small cabinet
- Full Spectrum processor set
- 5 available finishes
- Updated driver & well constructed cabinet
Cons
- Driver Mildly Noisy At Max Levels
SVS SB12-Plus First Impressions
SVSound is no stranger to the hallowed pages of Audioholics.com. Building their reputation on products with a high bang-for-the-buck value (and this small sub is one impressively big bang-for-the-buck product), they are renowned for their comparatively large products, such as the mighty SVS PB12Plus-/2 reviewed earlier in this web page.
Wait a sec... small ? Huh SVSound?
SVSound has a product line that is in a constant state of evolution and the SB12-Plus is their answer to the needs of the market segment that has been clamoring for a smaller sub for those applications where something like the PB12Plus-/2 would be outright overkill and not likely to meet with the approval of any significant others dwelling within earshot of said item.
First Impressions
Unpacking the SB12-Plus was pretty quick and I had it out of the box and up & running in under 5 minutes. As has been my experience with other SVSound products, the design of the shipment carton & packing is well thought out and provides for a safe transport container.
Right from the get-go its obvious SVSound has spared nothing where it came to distilling their engineering know-how into this small (for them!) subwoofer. They've brought forward most of the same processor features found in their larger, more costly products, fitted it out with a seriously tweaked 12" driver and packed it all into a cabinet with a footprint only slightly larger than 1 square foot. Small.
 |
 |
 |
|
 |
| Black Vinyl | Oak | Maple | Gloss Black | Rosenut |
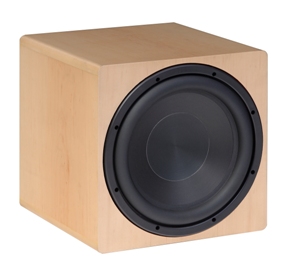
SVSound offers the SB12-Plus in a variety of finishes (Black Vinyl, Oak, Maple, Gloss
Black and Rosenut). Whether you're choosing the finish to minimize visual impact, harmonize with
your décor or just keeping the significant other happy, having a variety of available finish options is
important.
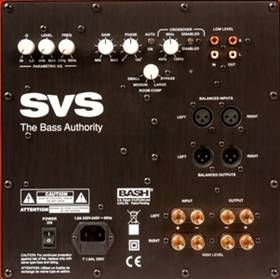
The model delivered for review featured a maple finish ,a clean faceplate, (no mount points!) and a back panel bristling with enough knobs, switches and jacks to keep all but the most terminally tweak contented.
The Driver
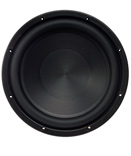
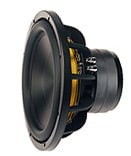
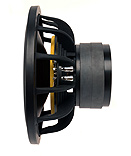
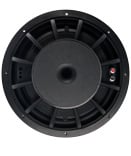
The driver chosen for this model, the Plus 12.3 is the 3rd version or generation (hence the ".3") of a driver that has already established a successful track record with SVSound. Two years in the making, it represents a significant advancement over the original item. Here's a current list of design highlights:
Bi-filar wound, high-temp, 4-layer 2"aluminum voice coil with Mil-spec polyimide insulation
- High temperature polyamide voice coil bobbin/former
- Dual progressive poly-cotton spiders with integrated power leads
- Custom tooled spider landing for increased lateral stability
- Cast aluminum frame with integrated cooling vents - epoxy powder-coat finish
- Chrome plated spring loaded push terminals
- Integrated single piece rubber wrap-around gasket
- Black anodized high grade aluminum cone diaphragm with inverted aluminum dust-cap
- High-excursion, custom SBR surround (Styrene-Butadiene Rubber)
- Dual stacked select grade ferrite magnets
- Low carbon 1008 steel single piece T-yoke and gap plate - electrophoresis finish
- Absolute highest quality acrylic adhesives used throughout
- Extreme excursion capability, enhanced efficiency and durability
- Small batch, hand-built in SVS's dedicated Ohio assembly line
SVS SB12-Plus Measurements and Analysis
System amplitude response, measured nearfield, scaled to 1m,
All User-accesible, Onboard processors disengaged or otherwise set inactive.
In the SB12-Plus amplitude response curve we see the typically well controlled, balanced plot we've seen in other SVSound subs. The LF rolloff, typically nearer 12 dB Oct in a sealed (acoustic suspension) system, sits at just over 24 dB oct. Processor controlled, the BASH amp never pushes the driver beyond its electrical or mechanical limits, all the while ensuring the superbly flat response as seen above.
The one "Con" item mentioned at the top of the article (Driver Mildly Noisy At Max Levels) Was, in practice, a very minor issue. (The fact that I am picking at such an insignificant nit speaks loudly for the overall quality of the product in terms of both design & construction). The noise referred to was faintly audible but only when the sub was driven hard - out to its limits - with pure sine wave test tones. Realistically, who spends their recreational listening time listening to sine waves? When reproducing music, any noise was rendered inaudible.
Electronic lowpass filter; fc = 120 (green), 80 (gold), and 40 Hz(dark red), Off (dark blue) measured nearfield, scaled to 1m.
All User-accesible, Onboard processors disengaged or otherwise set inactive.
Whether the SB12-Plus is used as part of a 2, 5 or 7 channel system an electronic lowpass filter is essential for proper integration. The constant-variable lowpass filter supplied with the sub was quiet, accurate and functioned exactly as it was designed to. Above are the response plots resulting from the filter set at 120, 80 & 40 Hz.
PEQ, variable frequency function, ~ 80 Hz (green curve), ~ 45 Hz (gold curve), and Off (blue curve). Measurement scaled to 1m.
All other processors disengaged or otherwise set inactive
Along with the LP filter, the SB12-Plus sports a single-band parametric equalizer (PEQ). Designed to notch out peaks in the measured amplitude response, above we see the PEQ dialed in at 2 different frequencies. Continuously variable, it too was quiet, accurate and functioned flawlessly at notching out response peaks (depending on how set) to the tune of ~ 10 dB or so.
PEQ, variable Q function, f ~ 45 Hz, Low (blue), Mid (purple), High (red) scaled to 1m.
The adjustable Q function of the SB12-Plus's PEQ allows for the effective control of the width of the PEQ's notch, allowing the end user to custom-fit the notch with greater accuracy.
The Room Gain Control (RGC) as implemented in the SB12-Plus functions essentially as a variable slope, highpass filter. It can be set to either Small, Medium, Large or Bypass (Off). "Small, Medium, Large" refer to the size of the room, of course. The website suggests 1400ft^3 as being "Small", up to 2400ft^3 as "Medium" and anything over 2400ft^3 as being "Large". Its a nice feature and some endusers will no doubt find it useful in tweaking the sub's performance in their listening space.
The LMS graph shows the effect in dBr of the 3 settings. Measurements were done and the resulting "Small, Medium, Large" amplitude response plots were then normalized to the curve taken with the RGC bypassed. Here's the graph key:
1. Dark Blue: Reference Plot
2. Purple: Large
3. Green: Medium
4. Mustard: Small
Room Gain Control. Reference response curve, RGC Bypassed (Blue), Large (Purple), Medium (Green) & Small (Mustard)
By normalizing the response plots its easy to see exactly how and where each setting rolls off the lowest portion of the sub's acoustical output.
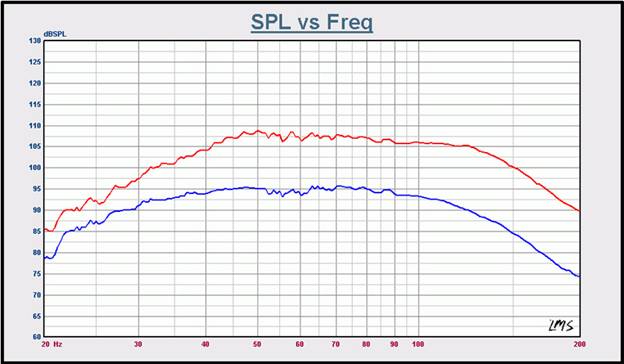
System Max Output (Blue curve), measured anechoically @ 2m, no scaling or smoothing.
LP filter engaged and set @ ~ 120 Hz.
Come time for assessing the SB12-Plus's max output capabilities the sub was taken to a nearby anechoic chamber to which I have access (schedule permitting). Measurements were done at 2m, on axis with the LP filter engaged and set to ~ 120 Hz. All other user-accesible, onboard processors were disengaged or otherwise set inactive.
First run was done at a respectable mid band level of just over 94 dB spl. Max db spl sat just above 106 db spl, midband and as before, the measurement distance was 2m. It's evident that as the unit is driven harder the LF knee of the system's response is pushed progressively higher. (Compare these plots to the first plot done at the top of the series) Thus the unit ensures the driver survives to rock another day.
SVS SB12-Plus Build Quality and Conclusion
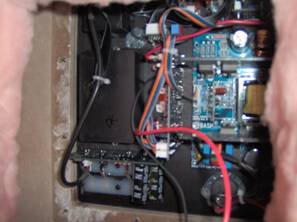
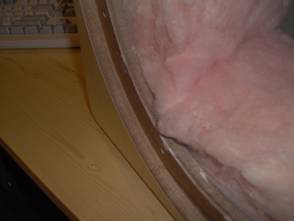
The cabinet is a straightforward design, built sturdily with thick panels, and partially filled with fiberglass. The BASH amp & all processors, as already noted, are bolted into the back panel of the cabinet. The faceplate has been recessed to accommodate flush-mounting of the 12.3 driver. The driver is affixed to the cabinet by means of bolt/t-nut mounting hardware. The outer rim of the driver is enclosed in a rubber surround which in addition to its aesthetic value forms a gasket which ensures a tight seal with the cabinet.
Set-Up
I'd like to reprise here something written in an earlier review of an SVSound product as it is just as applicable now as then:
[Do] treat a thoroughbred right - whether it be, say, a race horse or a car (such as a Ferrari) and it will deliver like nothing else can. Don't, then you're denying yourself the exceptional performance that puts it in the thoroughbred rank to begin with.
Taking the time to set up a subwoofer is essential to maximizing system performance. Big or small, passive or active, vented or totally enclosed box, every subwoofer when setup correctly will deliver the best performance it is capable of in your listening space. It's well worth making the effort.
Placement is a common first step in setting up a sub. You may already be familiar enough with the unique acoustical topology of your room to know exactly where it needs to go before you start fine-tuning phase, dialing in the perfect PEQ settings combination, and so forth. If that's the case, you're off to a running start, made all the easier because the SB12-Plus isn't (as subs go) large or overly heavy.
On the other hand, if you aren't all that familiar with the unique acoustical characteristics of your listening space you'll again find the comparatively small size of the SB12-Plus an advantage. Essentially, "small" means you have a larger number of placement options than you would otherwise if you were dealing with a "large" subwoofer. For all but the dying-est, die-hard bachelor or bachelorette audiophiles, visual impact, for better or worst, factors into placement decisions. Looked at from the what's-visually-feasible perspective, a small sub offers more placement latitude than a large one. Best of all, integrating two small subs into a room as opposed to one larger one offers the benefits of better modal control for smoother bass over a wider listening area.
One quick way of determining the initial favorable locations in your room is to run a looped sine wave test tone (eg 300 Hz to 20 Hz) and walk the room, listening for those spots where response sounds most balanced or even. There are other approaches and for a more in-depth treatment of this topic, audioholics.com provides a wealth of information for the reader to peruse.
In the particular room where the SB12-Plus was auditioned, the sub was located about half-way back along the west wall of the room. After about an hour 舗 s worth of processor adjustments based on both careful listening and measurement a well-balanced response was arrived at. Though there were the occasional minor settings changes made on the fly as I grew more familiar with the sub, by and large the initial settings were maintained throughout the listening sessions. No processing other than that provided by the sub itself was used throughout the listening sessions.
Listening Tests
 1
&
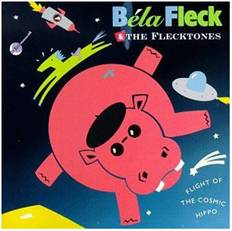
2. Bela Fleck
&
The Flecktones
"Flight of the Cosmic Hippo"
(Label:
Warner Bros\WEA; ASIN: B000002LOZ) and
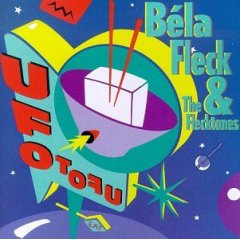
"UFO Tofu"
(Label: Label: Warner Bros / Wea; ASIN:
B000002MF7) are both discs that'll give any subwoofer a workout. Especially where it comes to
assessing how well a sub can
finesse
the material presented to it.
These tracks work
well with their minimalist arrangements, there's little for any bad sub behavior to hide
behind.
1
&
2. Bela Fleck
&
The Flecktones
"Flight of the Cosmic Hippo"
(Label:
Warner Bros\WEA; ASIN: B000002LOZ) and
"UFO Tofu"
(Label: Label: Warner Bros / Wea; ASIN:
B000002MF7) are both discs that'll give any subwoofer a workout. Especially where it comes to
assessing how well a sub can
finesse
the material presented to it.
These tracks work
well with their minimalist arrangements, there's little for any bad sub behavior to hide
behind.
Of particular interest here are "Flight of the Cosmic Hippo" found on "Flight of the Cosmic Hippo" and "Sex In A Pan", found on the "UFO Tofu" album. On bass, Victor Wooten and on drumitar, Roy "Future Man" Wooten (pictured at right). The Flecktones self-styled "blu bop" is a quirky, virtuosic mix of jazz, blue grass and whatever else might be the inspiration of the moment.
These tracks never fail at revealing the flaws or limitations of lesser subs, said items making the bass lines sound bloated or loose, the drumitar's "kick drum" sound, top heavy or over damped - all depending on the sub. The SB12-Plus responded to the challenge by filling the listening space with tight, clean rhythm bringing the Wooten Bros virtuosity to life in a lively, powerful way. Subjectively speaking, it's not unusual to encounter the sort of quality performance the SB12 delivered, though typically you'll find it in products costing much more or occupying more real estate.
 3. Mickey Hart
"Planet Drum"
(Label: Rykodisc; ASIN: B0000009O6). This disk is
packed with challenging, musically complex compositions for voice, percussion and little else.
3. Mickey Hart
"Planet Drum"
(Label: Rykodisc; ASIN: B0000009O6). This disk is
packed with challenging, musically complex compositions for voice, percussion and little else.
In the face of such percussive complexity it's easy for a sub to run out of dynamic headroom when pushed hard enough. The SB12-Plus is no exception, but owing to the quality of its design & components it maxed out gracefully, instead of simply collapsing in a heap of annoying distortion. Subsequent measurement showed the driver in the unit is held safe from harm by a built in limiter, hence its ability to play safely right out to the edges of its amplitude envelope. How well a sub deals with its own limitations when pushed hard enough is illuminating; whether or not excellence exists on the edge plays a role in determining the value of the product.
The Planet Drum disk has been around for quite a while and remains a favorite for putting any sub through its paces.
Recommendations
Any designer sitting down to design a sub must abide by the physics-imposed constraints of efficiency, bandwidth and cabinet size. In the end, any product represents a compromise of sorts, the compromise being the particular balance point chosen by the designer between the three. Whether or not that choice is musically satisfying depends on a number factors, but in the end it's the consumer that votes with his or actual purchases that determine whether or not the designer's vision was commercially valid. In the SB12-Plus we have a product focused clearly on that portion of the market that cannot or will not have a place for a large unit in their listening space. SVSound chose to go with a small, totally enclosed cabinet, pack a single 12" driver into it and powered the system with a 425-watt power amp. The end result? SVSound pushed the SB12-Plus 舗 performance right to the edge of the small-sub envelope. While in terms of raw dB spl output it cannot hope to rival the performance of something such as its big brother the PB12-Ultra/2 there are other musically-important performance metrics where it equals the performance of its larger siblings.
If making the furniture shake a floor or two up is how you define a sub's worth then a single SB12-Plus is not for you. On the other hand, if you're listening tends to be done in a small room or a system the size of the aforementioned PB12-Plus/2 just isn't going to happen because the SAF heads into the cold zone at the mere mention of a box big enough to house Fido, then the SB12-Plus is an obvious way to go.
Where the SB12-Plus keeps up with its much larger siblings is the flat response, quality design & build and a comprehensive set of built-in processors. One advantage of its small size is how well it lends itself to multiple-sub setups - an approach for which there are some definite sonic advantages.
Conclusion
SVSound has, once again, brought to the market a product that outright excels in the value-for-dollar category. It may be relatively small in size (about 1 cubic foot), but it's SVSound through and through: well built, and lots of power and SPL output. Coupled with its collection of built-in processor features and it's the logical choice for those who want the SVS sound but have chosen not to go with or have no need for something along the lines of SVSounds larger dual driver subs. Park two or more of these acoustical dynamos in your listening space and get ready to enjoy great sound your friends' will envy while garnering gratitude of your significant other who hasn't given up a king's ransom in floor space in pursuit of your audio nirvana.
The Score Card
The scoring below is based on each piece of equipment doing the duty it is designed for. The numbers are weighed heavily with respect to the individual cost of each unit, thus giving a rating roughly equal to:
Performance × Price Factor/Value = Rating
Audioholics.com note: The ratings indicated below are based on subjective listening and objective testing of the product in question. The rating scale is based on performance/value ratio. If you notice better performing products in future reviews that have lower numbers in certain areas, be aware that the value factor is most likely the culprit. Other Audioholics reviewers may rate products solely based on performance, and each reviewer has his/her own system for ratings.
Audioholics Rating Scale
 — Excellent
- — Very Good
- — Good
- — Fair
- — Poor
| Metric | Rating |
|---|---|
| Bass Extension | |
| Build Quality | |
| Fit and Finish | |
| Features | |
| Performance | |
| Value |