
SVS PB12-Plus/2 Subwoofer System Review
SVS PB12-Plus/2
- Product Name: PB12-Plus/2
- Manufacturer: SVSound
- Performance Rating:


- Value Rating:
- Review Date: January 04, 2006 19:00
- MSRP: $ 1199+
|
Sensitivity (2.83 V/1m, avg'ed from 16 Hz to
200 Hz): |
86.5 dB spl |
|
Amp. Power: |
BASH© High-efficiency 900W hybrid-class, digital-switching power amp |
|
Rated Impedance: |
14 Ohms |
|
Impedance, (10 - 200 Hz) averaged for 16, 20 & 25 Hz tunings: |
11.3 ± .1 to 58 +3, -4 Ohms |
|
Frequency Response (+/- 3 dB): |
23 Hz (-3 dB) - 305 Hz (+ 3 dB) (25 Hz system tuning) |
|
Resonance Frequency: |
Variable: 16, 20 or 25 Hz |
|
Bass Principle: |
Bass reflex |
|
Shipping Weight: |
74.8 kg (165 Lbs) |
|
Cabinet Dimensions (W x H x L): |
482mm x 673mm x 711mm |
|
Active Processors: |
Crossover: active lowpass filter, variable,40 - 120
Hz |
|
Connection: |
Line Level: RCA jacks; speaker level: 5-way binding post |
|
Recommended Placing: |
Manufacturer suggests corner placement. |
Pros
- Earthquake in a box
- Quiet, effective & useful processor set
- Variety of available finishes
- Well designed & constructed cabinet
Cons
- It's Big.
- Prone to wind noise at extreme levels
- Large current inrush heavily loads AC mains
PB12-Plus/2 First Impressions
SVSound is a relative newcomer to the home audio arena and has quickly made a name for itself. In the relatively short time they've been in existence they've earned an enviable reputation for building products that deliver exceptionally high value for the price. My experience with the PB12-Plus/2 has shown that reputation is richly deserved. This is one impressively big bang-for-the- buck product.
Founded in 1999 by Ron Stimpson (the "S" in SVSound) and Tom Vodhanel (the "V"), SVSound sold their first products online in 2000. Since then they've offered a broad, ever evolving, spectrum of products, introducing in 2002 their first box-shaped line of subwoofers, of which the PB12-Plus/2 is a member.
Prior to 2002, SVSound focused on cylindrical-shaped products. Looking at the cylindrical-shaped subs, I can't help but wonder if any of SVSound customers had problems with the house cats viewing the things as the mother of all scratching posts!
First Impressions
 I'm not sure what
impressed me most when I first saw the newly-delivered sub parked in one of my garage bays: the size of
the shipping container, that it was delivered on a pallet or the fact that the delivery guy
didn
't even want to attempt getting it through the backdoor. It was
big
and it was
definitely
not
a
"lifestyle"
sub for the living-space challenged or the faint of
heart. Figure 1(right) shows the new arrival with my 8-year old, in the picture for scale.
I'm not sure what
impressed me most when I first saw the newly-delivered sub parked in one of my garage bays: the size of
the shipping container, that it was delivered on a pallet or the fact that the delivery guy
didn
't even want to attempt getting it through the backdoor. It was
big
and it was
definitely
not
a
"lifestyle"
sub for the living-space challenged or the faint of
heart. Figure 1(right) shows the new arrival with my 8-year old, in the picture for scale.
Unpacking the thing was pretty quick, though: cut the wrap straps, pop off the top of the shipping carton and there it was - the mighty PB12-Plus/2 - wrapped in a big cotton sock! Also included were the usuals: some accessories and a well written, very useful user manual.
Sliding the PB12-Plus/2 out of the base of the carton and onto a 2-wheel hand truck I soon had it located in my main listening room. After the effort expended in getting it up a flight of stairs I decided I could skip going to the gym that day.
SVSound offers the PB12-Plus/2 in a variety of finishes (Black textured, Walnut, Cherry, Maple, Rosewood, and Piano gloss) an especially important option where it comes to a product this size. A word of advice where it comes to maximizing Spousal Acceptance Factor (SAF): minimize the visual impact of a sub this big by taking the time to choose the finish that blends best with the décor of whichever room it is destined for. Better yet, let the Spouse pick out the finish. This move can pay off big time!
The model delivered for review featured a walnut finish that worked well with the décor of the main listening room. So well, in fact, that it eventually merged into the scenery of the room, delivering a surprisingly minimal visual impact. Not bad for something the size of a doghouse.
SVS PB12-Plus/2 Build Quality
|
|
|
|
|
|
|
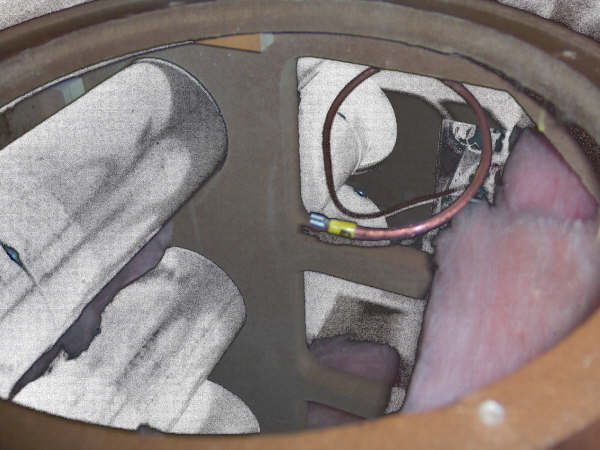
SVSound PB12-Plus/2 Hardware (Ducts not showing as they were not removable). Drivers feature aluminum cones, santoprene surrounds and strontium-ferrite magnets. Note port plugs perched in the back, right hand corner of the cabinet top. Beneath the drivers is the cabinet base plate. |
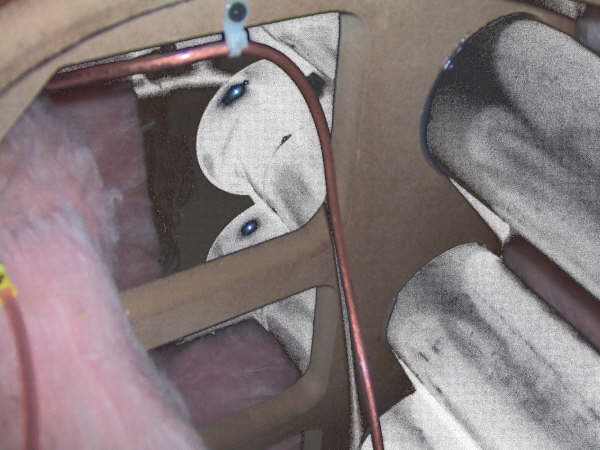
Both Photos: System flipped upside down, drivers removed. Top photo: looking aft, towards power amp. Note internal cross bracing also serves to brace the internal duct work. Bottom photo: Looking forward, note port flaring, heavy gauge internal wiring and thickness of front panel & internal bracing. |
Set-Up
Treat a thoroughbred right - whether it be, say, a race horse or a car (such as a Ferrari) and it will deliver like nothing else can. Don't, then you're denying yourself the exceptional performance that puts it in the thoroughbred rank to begin with. The same holds true for subs in the PB12-Plus/2 class. It is a thoroughbred and it is absolutely essential you take the time and make the effort to set this sub up properly.
A side note is in order here. With a system capable of dissipating into a listening space the kind of acoustic power the PB12-Plus/2 can do (with ease) you'll find that the architecture of your home will play a surprisingly substantial role in determining just what your listening experience will be. Here I'm not referring to the well known phenomena of room modes setting up within the space of your listening room - that's a given.
What I am referring to are resonances setting up in the floor the sub sits on or in other architectural features, such as a fireplace. In my case, the sub could excite floor resonances to the point that the floor would vibrate like a big, fat wooden drum head, making furniture weighing (in some case) several hundreds of pounds jiggle to an unsettling degree. At one point when I had the PB12-Plus/2 really opened up, it excited the naturally occurring resonances that set up in my fireplace chimney located at the south end of the listening room. Subs that don't crank that kind of acoustic output will not elicit those kind of responses, hence they won't require the degree of complexity in setup that creatures such as the PB12-Plus/2.
At any rate, with the system tuned to 20 Hz, the crossover and parametric EQ disabled, and phase at 0°, I moved the sub to the main listening position and began some preliminary setup tests. Using a looped, swept sine wave signal (300 Hz to 16 Hz) as a test signal, I walked the room to get an idea (acoustically speaking) what options were available regarding final placement.
In the end two candidates (one, about half-way back along the west wall of my listening room, the other about three-quarters back along the same wall next to a sofa) emerged as frontrunners: I settled for the latter, position that minimized the visual impact of the system. Once placed, I followed the set up procedure provided by the manual. After about two hours of careful listening - and judicious use of the phase, crossover and paraEQ features sported by the system - I arrived at a settings mix that sounded very well tempered. (See Figure 13 for a before/after PEQ).Over the following next few weeks I did a lot of recreational listening, occasionally tweaking a setting or two until I was satisfied I had the sub performing at its best. Then the critical listening begin. It should be mentioned in passing that all listening tests were done using the PB12-Plus/2 processors (crossover, PEQ, etc) were used. No other processing upstream of the sub was used.
Listening Tests
Music
 I've always considered music
&
video soundtrack
playback as two largely separate roles (though distinctions can blur, of course) that a subwoofer in
the
>
1$k price bracket should handle with equal success. For the first part of my critical
listening tests -
what I'll refer to as the
"finesse"
segment - I chose a
number of tracks that would show how well (or not) the sub could perform by
not
calling
attention to itself. Essentially I was looking for as seamless integration with the rest of the
playback system as possible.
I've always considered music
&
video soundtrack
playback as two largely separate roles (though distinctions can blur, of course) that a subwoofer in
the
>
1$k price bracket should handle with equal success. For the first part of my critical
listening tests -
what I'll refer to as the
"finesse"
segment - I chose a
number of tracks that would show how well (or not) the sub could perform by
not
calling
attention to itself. Essentially I was looking for as seamless integration with the rest of the
playback system as possible.
(Unless otherwise noted the music playback portion of the listening sessions were conducted with the system tuned to 20 Hz).
From the Crown SASS Microphone CD I selected a few tracks featuring plain, old piano. I was interested in getting a sense of how well matched, in terms of timbre, the SVS sounded vis a vis the rest of the system. Tonally speaking, I wanted every note to sound as if it were coming from the same piano, with no apparent telltale differences above and below the 80 Hz point.
At first, the piano sounded a little too warm in the 80 Hz region, though it wasn't bad for a start. Tweaking the crossover setting cured that problem: lowering the LP crossover point to around 60 Hz brought everything into proper perspective. The PB12-Plus/2 handled that easily enough, though I've seen other subs fall down in the face of this particular challenge.
 Kim Mitchell's
Aural Fixation
CD provided a variety of tracks, such as
World's Such a Wonder
with lots of kick drum action
.
After passing the piano
timber test, I wanted to know how the PB12-Plus/2 would behave when faced with a signal source, such as
a kick drum, transient in nature and with a fundamental frequency within an octave's breadth of
the resonant frequency of many subs. I like using
Aural Fixation
for testing purposes because
the kick drum sounds like it was compressed and EQ'd as you'd find in a typical live music
setting which is a sound I'm pretty familiar with.
Kim Mitchell's
Aural Fixation
CD provided a variety of tracks, such as
World's Such a Wonder
with lots of kick drum action
.
After passing the piano
timber test, I wanted to know how the PB12-Plus/2 would behave when faced with a signal source, such as
a kick drum, transient in nature and with a fundamental frequency within an octave's breadth of
the resonant frequency of many subs. I like using
Aural Fixation
for testing purposes because
the kick drum sounds like it was compressed and EQ'd as you'd find in a typical live music
setting which is a sound I'm pretty familiar with.
Though there's no hard & fast rule where it comes to tuning kick drums, kick drum tracks can nevertheless be a useful testing tool because, as previously mentioned, they tend to be tuned to frequencies in the neighborhood of many a sub's resonance frequency. Subs designed and built on underdamped alignments (tweak out a few extra dB at system resonance, but at the expense of system response elsewhere) reveal themselves pretty quickly as such when faced with this type of test signal.
As mentioned previously, I had the sub tuned to 20 Hz, a choice providing for flattest passband response. So how did it sound? In a word 舑 great! The sub handled the tight kickdrum sound with ease, in a way reminiscent of some superbly engineered closed box systems I've heard elsewhere.
 If you've experienced a choral or organ music concert in a large cathedral, you know a
reverberant space that size has a unique, memorable acoustic character. One distinguishing...
and
surprising...
aspect of recordings made in spaces such as this are the amounts of low frequency
acoustic energy captured in those recordings, even when the material is choral. Surprisingly enough,
recordings of this type can, on occasion, contain infrasonic information in the 8 Hz -
10 Hz
range. As well, occasional excitement of room resonances that are at sub-harmonic frequencies to a
particular note played or sung, all give evidence for the necessity of having a subwoofer in place to
more faithfully reproduce the event and thus more fully present the illusion of moving the listener to
the space. Poorly designed subs that exhibit
high mechanical noise floors
fare poorly where it comes to convincingly resolving such low level information. The
Tallis
Scholars 25th Anniversary Silver
CD set was used to subjectively test how well the sub would
handle subtleties of this nature. The PB12-Plus/2 didn't have any such noticeable difficulty in
handling the LF portion of any tracks played from this particular CD set. As a matter of fact I found
the sub did so well I ended up listening to both disks in the set; a rare treat with the PB12-Plus/2
adding an
essential dimension to the listening experience.
If you've experienced a choral or organ music concert in a large cathedral, you know a
reverberant space that size has a unique, memorable acoustic character. One distinguishing...
and
surprising...
aspect of recordings made in spaces such as this are the amounts of low frequency
acoustic energy captured in those recordings, even when the material is choral. Surprisingly enough,
recordings of this type can, on occasion, contain infrasonic information in the 8 Hz -
10 Hz
range. As well, occasional excitement of room resonances that are at sub-harmonic frequencies to a
particular note played or sung, all give evidence for the necessity of having a subwoofer in place to
more faithfully reproduce the event and thus more fully present the illusion of moving the listener to
the space. Poorly designed subs that exhibit
high mechanical noise floors
fare poorly where it comes to convincingly resolving such low level information. The
Tallis
Scholars 25th Anniversary Silver
CD set was used to subjectively test how well the sub would
handle subtleties of this nature. The PB12-Plus/2 didn't have any such noticeable difficulty in
handling the LF portion of any tracks played from this particular CD set. As a matter of fact I found
the sub did so well I ended up listening to both disks in the set; a rare treat with the PB12-Plus/2
adding an
essential dimension to the listening experience.
PB12-Plus/2 Measurements and Analysis
Figure 5 shows the PB12-Plus/2's amplitude response curves for the 25 Hz (Blue), 20 Hz (Purple) and 16 Hz (Green) system tunings. The drive level was 2.828 Vac and measurements were taken nearfield, subsequently scaled to 1m. For these measurements the crossover network and parametric EQ were both disabled, phase = 0°. All measurements were done indoors. Keep in mind that the nearfield measurement technique effectively excludes the measurement-skewing effects of the room within which the unit is being measured, therefore actual dB spl levels attained in practice are much higher, owing to room gain.
For each of the three tunings we see a respectably flat amplitude response which to a degree explains how the PB12-Plus/2 did so well in the music playback section of the critical listening sessions. Finessing subtle acoustic details and integrating with the rest of the system as well as the PB12-Plus/2 did is dependent on the ability to generate amplitude response curves like these.
You'll note that at the 16 Hz tuning the system exhibited a slightly lower dB spl output than that seen in either the 20 Hz or 25 Hz. In my listening experience this really wasn't a shortcoming as the system can dissipate so much acoustic power into your listening space in the first place that even the heartiest of bass freaks will find the system satisfying. Indeed, the PB12-Plus/2 is so capable, if in your mind you have any question as to the ability of the floor or other nearby structures making up your listening space to withstand the rigors of a resident sub in this class, by all means make the effort to strengthen or otherwise protect those structures and the room's contents.
We've seen thus far the PB12-Plus/2's ability to maintain respectably flat amplitude response curves at modest levels. But where it comes to how & why the PB12-Plus/2 performed as well as it did for the shock and awe portion of the listening sessions, respectably flat amplitude response curves only tell part of the story. For more insight we need to look at the sub's power compression behavior.
Power compression curves tell us to what degree and at what frequencies the system shifts from a linear relationship - between electric power in to acoustic power out - to a nonlinear one, the higher the sub's acoustic output goes before sliding into nonlinear behavior, the greater the dynamic "punch" the system will deliver.
For the power compression test I moved the PB12-Plus/2 from the main listening room to my home theatre. My home theater is purpose built to withstand outrageous amounts of acoustic power dissipating within and not vibrate, jiggle etc and sports a concrete sub-floor structure. My main listening room, on the other hand, sits on a wooden floor, has lots of stuff that can jiggle, vibrate, sway, etc and I just didn't want to take the risk of damaging anything. If you'd like to recreate these tests, I highly recommend you (and anyone else present) wear a good pair of earplugs. During those tests that resulted in the curves presented in Figure 6b, the PB12-Plus/2 would at times dissipate enough acoustical power into the room sufficient to cause blurred vision! That 舗 s pretty loud.
Figure 6a provides a relative look at the PB12-Plus/2's compression characteristics. For the series of curves shown, measurements were taken nearfield, then normalized to a reference level, referred to as 0 dB) in the graph. As can be seen, power compression is evident, but the PB12-Plus/2 does a fine job of keeping it to a reasonable minimum.
Figure 6b is a second, entirely separate set of curves. Rather than nearfield measurement conditions, I positioned the measurement microphone at the listening position, located ~ 2m away from the PB12-Plus/2 and placed at ear height..A series of sweeps were run, each time incrementally increasing the gain approximately 3dB. The parametric EQ (note the respectably flat 16 舑 30 Hz segment of the system's amplitude response) and requisite high-pass filter were used.
The PB12-Plus/2 could easily reach 106 dB @ 20 Hz at the listening position (~ 2m distance), with nary a hint of compression. Excellent! Previously, I 舗 ve had the unit cranking at levels > 110 dB, (with expected, but nevertheless, realistically low compression levels). For this series of tests I did not take it higher than 106 dB simply because at that level I had so much stuff vibrating across the 2 floors above my home theater that I figured the PB12-Plus/2 had admirably proved its point.
Indeed, for the last 3 sweeps (101.7, 103.2, and 106 dB sweeps) I left the home theater and walked around my house to observe the effects of the vibrations produced on it and its contents. At the 106 dB sweep, I watched a telephone vibrate off a table top and fall to the floor, 2 stories up! Like I said, it had proved its point.
One particularly noteworthy feature found in the measurements is that the amplitude response in the 16 - 30 Hz segment of interest is that it grew flatter as the dB spl output increased.
As we can see from the power compression curves, the system did indeed diverge increasingly from linear operation at the + 9 dB and + 12 dB drive levels. For comparison purposes, if the PB12-Plus/2 remained linear at each test drive level, then Figure 6 would show a collection of straight lines.
The valleys we see in the + 9 and + 12 dB curves, can be caused by ducts going into non-linear operation, built-in electronic limiting in action or a combination of both. In any case, power compression is evident and illustrates that even a plaster-busting behemoth like the PB12-Plus/2 has its limits.
With the power amp disconnected I ran a series of impedance scans. Here we see the double Z-peak typical of a vented cabinet. Minimum impedance was just over 11 ohms, which wasn't unexpected as the drivers are connected in series.
Impedance curves are useful in diagnosing pathologies such as strong mechanical resonances, defective drive units, etc. They're also useful for getting a fairly accurate view of the systems tuned resonance frequency. In this case, the impedance minima appearing between the two z peaks were within a couple of Hz of the stated tuning frequencies listed in the manual (16 Hz, 20 Hz and 25 Hz).
In the case of the PB12-Plus/2, the z curves are also useful for determining what affect (if any) the baseplate, situated as close as it is to the front of the system's two drivers has on system tuning.PB12-Plus/2 Measurements and Analysis (cont.)
Figure 8: PB12-Plus/2 impedance curves, taken with & without baseplate in place.
In Figure 8 we can see that the affect is minimal; with the baseplate in place the system tuning frequency shifts only slightly downward, which was anticipated.
Impedance curves are also useful in determining current draw (both magnitude & phase) for a system. The PB12-Plus/2 exhibited the current curves showing in Figure 9 Scaling the drive level upward, measuring the resulting z curve at each step and deriving the current curves can give a pretty comprehensive picture of what the system will demand of the amplifier driving it.
Figure 9: PB12-Plus/2 current draw, in Amperes, at 16, 20 & 25 Hz system tunings.
The PB12-Plus/2 comes with a useful array of features built in to the power amp. The variable electronic crossover provides for a lowpass crossover function, useful for setting up your sub to integrate correctly with the rest of your system. Figure 10 shows the system response at a crossover setting of 120, 80, 60 and 40 Hz.
Figure 10: Electronic lowpass filter; fc = 120, 80, 60, and 40 Hz, measured nearfield, scaled to 1m, 2.828 Vac drive level.
Along with the electronic lowpass crossover, the PB12-Plus/2 sports an equally useful parametric equalizer. Figure 11 shows the results of a quick check of the variable Q function and Figure 12, the variable frequency function. I found both features indispensable in setting up the sub for proper room/system integration.
Figure 11: Parametric EQ, variable Q function, 2.828Vac drive level, scaled to 1m.
Figure 12: Parametric EQ, variable frequency function, 2.828Vac drive level, scaled to 1m.
Both features worked exactly as they should and were invaluable in setting up the sub.
In figure 13 are the measured results of a putting the PEQ to use flattening a low-Q response peak, located just under 20 Hz. As can be seen, the peak was indeed substantially flattened. Subjectively, the qualitative difference was substantial.
The stepped frequency highpass (HP) filter (used in conjunction with the system's tunable duct array) serves to both define the PB12-Plus/2's response below the chosen system tuning frequency as well as protect the driver's from damage. The literature supplied with the PB12-Plus/2 emphasizes the importance of selecting the correct highpass frequency for each of the 3 possible tunings. Once you've been exposed to just how powerful a unit the PB12-Plus/2 is, its easy to imagine how sensible and necessary it is to ensure the correct HP frequency is chosen. Doing so ensures maximum performance and a long, productive lifespan.
Figure 13: ParaEQ application: Red curve (before), blue curve (after).
PB12-Plus/2 Listening Tests and Conclusion
 Wrapping up
the music sessions, it was now time to unleash the beast on some of the most popular low-end challenges
now out there.
Wrapping up
the music sessions, it was now time to unleash the beast on some of the most popular low-end challenges
now out there.
One of my favorites is the soundtrack behind the original Jurassic Park crunch & munch scene where T-Rex stomps into view to the accompaniment of lots of infrasonic energy, down to around 10 Hz or so. Sonically, there's little else going on, so any buzzing, chuffing, fluttering, general wind noise or other symptoms of a sub in distress will quickly make themselves known.
Again and again I'd play the clip, upping the gain on the sub a bit, seeing how it reacted. It was only at the highest playback levels I dared to drive it that the wind noise was audible, but you had to be seated near the sub to notice. If you sat apart from the sub, the noise from so many other things in the house shaking, jiggling, squeaking and so forth pretty much covered up any system noise!
One night I had a dinner party at my home and as these things tend to go, the guests spread throughout the house. Known only to a few, I had loaded up in the CD drive some T-rex-type infrasonic sound effects. Letting it rip, the sub shook the house and scared many a guest into hightailing it back to the kitchen area to find out what had just happened. Funnier yet was watching the kids launch themselves up the basement stairs saucer-eyed with fear, wondering what it was that just shook the house!
 Another favorite clip of mine is the soundtrack accompanying the depth
charge scene in U-571.
Another favorite clip of mine is the soundtrack accompanying the depth
charge scene in U-571.
Now I have never been depth charged, so I can't speak from the vantage of a reference point, but I have nevertheless found this clip useful for getting a fairly accurate sense of how concussive a punch a subwoofer can deliver in the 10 - 25 Hz region.
The PB12 delivered a disturbingly tactile slam that well conveyed the metal-bending might of a well placed depth charge. A lesser sub simply wouldn't have been able to pull this off in the way the PB12-Plus/2 did.
Where it comes to a soundtrack like this it would be hard to overestimate how much a capable sub can contribute to the sense of realism that inevitably draws one into a movie, shifting ones perspective from that of witness to participant. A good sub helps develop a convincing sense of tactility, realism, drama, and involvement. In this respect the PB12-Plus/2 was able to deliver by the wagonload.
 Last up was the soundtrack behind the Irene scene in
Blackhawk Down.
Last up was the soundtrack behind the Irene scene in
Blackhawk Down.
Lasting about half a minute the engine & blade noise has lots of energy at around 18 Hz and - ominously - around 8 Hz, as well. The 18 Hz was just within the PB12-Plus/2's reach, but the 8 Hz simply wasn't in the cards. Now flying in helicopters is something I have done, so speaking from a point of reference I can say the PB12-Plus/2 does a very credible job of recreating the gut-churning thump of a helicopter blade spinning up.
Conclusion
Once in a while you encounter a product that simply excels in the value-for-dollar category. The PB12-Plus/2 is just such a product and as such comes with a strong buy recommendation if you're in the market for a sophisticated floor shaker.
Be prepared to make the effort and take the time to properly set up this sub in your listening space.Because you have in the PB12-Plus/2 a product capable of dissipating substantial amounts of power into your listening space, the architecture and construction of the walls, ceiling, floors and other room features such as fireplaces and so forth will play a roll in your final listening experiences. If anything within earshot of the PB12-Plus/2 has a fundamental resonance within the sub's range it will find it with surprising efficiency. Integrating it with your listening room and the rest of your system will take time, but is well worth the effort. I found doing so essential to getting the top-flight performance the PB12-Plus/2 is capable of delivering. Once done, get ready to have a LOT of fun with this sub.
The Score Card
The scoring below is based on each piece of equipment doing the duty it is designed for. The numbers are weighed heavily with respect to the individual cost of each unit, thus giving a rating roughly equal to:
Performance × Price Factor/Value = Rating
Audioholics.com note: The ratings indicated below are based on subjective listening and objective testing of the product in question. The rating scale is based on performance/value ratio. If you notice better performing products in future reviews that have lower numbers in certain areas, be aware that the value factor is most likely the culprit. Other Audioholics reviewers may rate products solely based on performance, and each reviewer has his/her own system for ratings.
Audioholics Rating Scale
 — Excellent
- — Very Good
- — Good
- — Fair
- — Poor
| Metric | Rating |
|---|---|
| Bass Extension | |
| Bass Accuracy | |
| Build Quality | |
| Fit and Finish | |
| Ergonomics & Usability | |
| Performance | |
| Value |