
Chrysalis Acoustics Photon-8 Powered Subwoofer Review
- Product Name: Chrysalis Photon-8 Powered Subwoofer
- Manufacturer: Chrysalis Acoustics
- Performance Rating:

- Value Rating:

- Review Date: August 05, 2008 16:49
- MSRP: $ 899
Amplifier Type: Class D w/ digital servo driver control
Amplifier Power (RMS/Peak): 1000/2000 Watts
Bass Extension (+/-3dB): 26 Hz
Woofer Diameter: 8" Kevlar reinforced resin composite
Motor Structure (magnet wt/voice coil dia): 12.7lb/ 2.5”
Crossover Frequency: 40 Hz to 120 Hz
Crossover type: Continuous variable low pass filter with bypass
Crossover Slope (initial/final): -12dB to -24dB/octave
Phase: 0 or 180 degrees
Dimensions: (HxWxD): 10.06" x 10.38" x 12.75"
Weight (lbs): 35 lbs.
Pros
- Tiny subwoofer yet still produces potent, deep bass despite its size
- Good transients and detail
- Excellent transparency
- Musical presentation
Cons
- Tiny subwoofer that ultimately limits maximum output and low end
- Thin cabinet wall construction
- A somewhat less than furniture grade finish
Introduction
 My big subwoofer
adventure continues this time with a little one. That is big adventure, little subwoofer. The little subwoofer is the Chrysalis
Acoustics Photon-8, a diminutive sub that claims a kilowatt of juice, RMS, a
full 3 dB of headroom dynamic power, and a 26 Hz roll off point. That’s quite an impressive claim for a sealed
sub design not much bigger than its 8 inch driver is.
My big subwoofer
adventure continues this time with a little one. That is big adventure, little subwoofer. The little subwoofer is the Chrysalis
Acoustics Photon-8, a diminutive sub that claims a kilowatt of juice, RMS, a
full 3 dB of headroom dynamic power, and a 26 Hz roll off point. That’s quite an impressive claim for a sealed
sub design not much bigger than its 8 inch driver is.
Chrysalis Acoustics is a subsidiary of well known and
well regarded subwoofer manufacturer Velodyne. The Chrysalis Acoustics product literature cites 25 years
of experience designing and building subwoofers. That experience is rooted in parent company
Velodyne’s history as a subwoofer manufacture that was founded in 1983. It is not entirely clear how intertwined the
actual engineering and manufacturing of the two companies actually is, but only
one of the two companies has been around long enough to claim 25 years
experience so the other would have to draw off of the first heavily to
substantiate that claim. Rest assured if you're buying this product, you're getting Velodyne engineering know how and technology.
Design and Construction
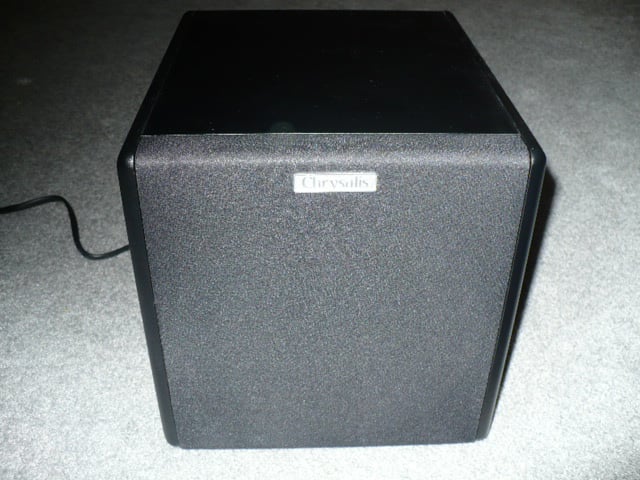
The Photon-8 is
a very modestly sized powered subwoofer with a front firing 8 inch driver. The cabinet is a rectangular sealed design
that is little more than 10 inches squared by over 12 inches deep that weighs
in at 35 pounds. Actually, the Photon-8
is about the size of the subwoofers that come with computer speaker systems
with some extra depth, kind of a computer speaker sub on steroids. The only subs that come with cabinets smaller
than this usually also come with a smaller driver.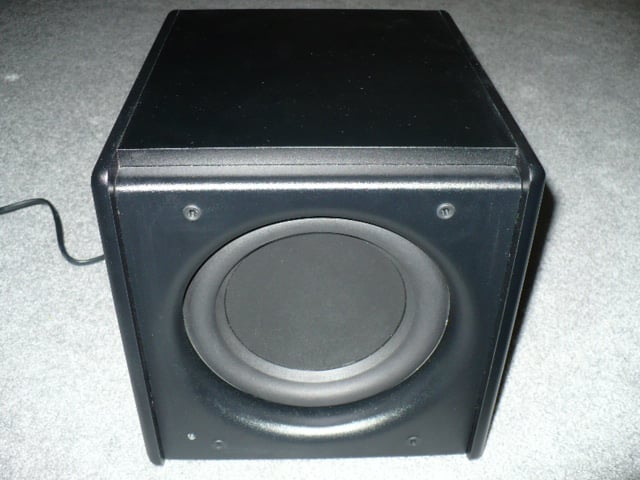
They also rarely have a frequency response of 26 Hz at the -3 dB point.
The cabinet itself features radiused edges and corners
and the top panel is slightly recessed below the side panels providing reveal
lines. The driver is internally mounted
with no visible mounting screws and recessed into the baffle with radiused
edges around the circumference of the opening.
The black cloth grille is also inset to be flush with the extended side
panels at the front and 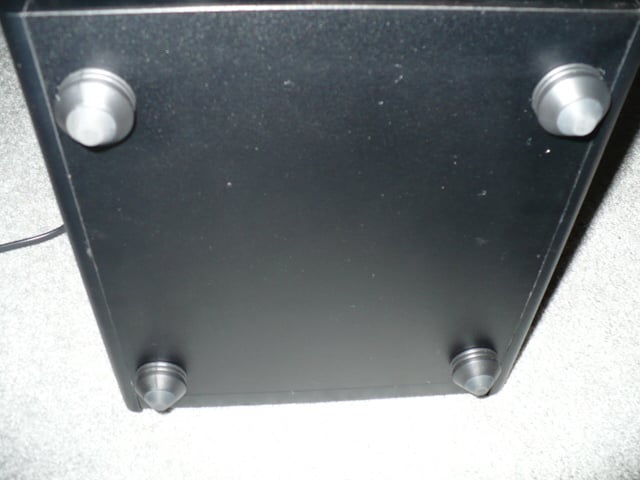 wraps over the top with the Chrysalis badge top and
center. At the bottom, the unit sits
atop rubber feet as the only support
option with no apparent accommodation for carpet spikes.
wraps over the top with the Chrysalis badge top and
center. At the bottom, the unit sits
atop rubber feet as the only support
option with no apparent accommodation for carpet spikes.
The single
finish option is a textured black vinyl. While the finish is competently applied, the
sub will not win any interior design awards or fool anyone into believing it is
fine furniture, or even that it is made of wood for that matter. The good news is 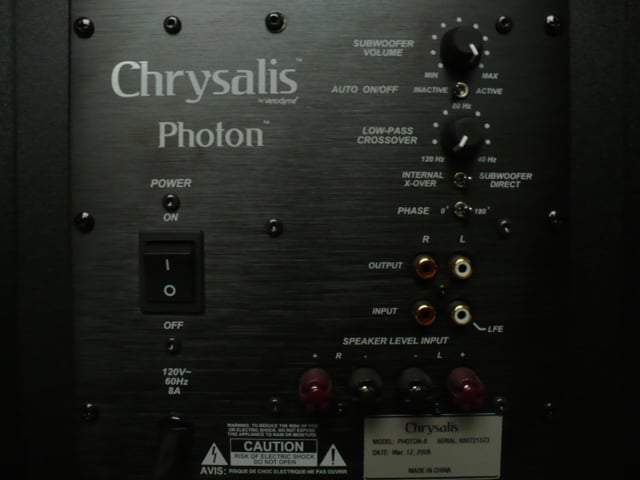 that a subwoofer this small
should be easy to hide just about anywhere if it violates the décor of the
surrounding room in any way.
that a subwoofer this small
should be easy to hide just about anywhere if it violates the décor of the
surrounding room in any way.
The rear of the unit is home to the typical mounting plate for the amplifier and ontrols. To the left side is a large rocker styled master power switch and a non-detachable power cord while to the right side are all the controls and inputs. These controls include two knobs allowing continuously variable settings for volume and the low pass crossover frequency. There are toggle switches for activating the auto on/off feature, the internal crossover, and setting the subwoofer phase between 0 and 180 degrees. Below the controls are two pairs of gold plated RCA connections for line level input and output as well as two pairs of five way binding posts for speaker level input that also have gold plated leads.
 The internal
crossover system for signal input is adjustable from 40 to 120 Hz and uses
staged for low pass filtering that varies between –12 dB/octave at the
crossover frequency to –24 dB/octave above the crossover frequency. The line level output is said to have a high
pass crossover that can be set for either 80 or 100 Hz that filters at –6 dB/octave below this frequency but there is no control apparent on the subwoofer
to adjust this setting.
The internal
crossover system for signal input is adjustable from 40 to 120 Hz and uses
staged for low pass filtering that varies between –12 dB/octave at the
crossover frequency to –24 dB/octave above the crossover frequency. The line level output is said to have a high
pass crossover that can be set for either 80 or 100 Hz that filters at –6 dB/octave below this frequency but there is no control apparent on the subwoofer
to adjust this setting.
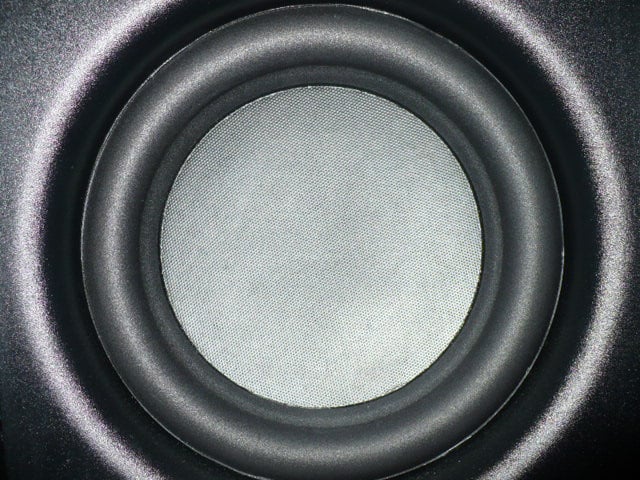
 The driver used in the Photon-8 has an 8 inch outside diameter that
Chrysalis states provides a 6.5 inch effective piston diameter. The cone itself is a composite resin that is
reinforced with Kevlar fibers and is mounted to the frame with an oversized
EPDM rubber surround while the internal suspension is said to use an oversized
spider, both to accommodate high excursion but retain linearity.
The driver used in the Photon-8 has an 8 inch outside diameter that
Chrysalis states provides a 6.5 inch effective piston diameter. The cone itself is a composite resin that is
reinforced with Kevlar fibers and is mounted to the frame with an oversized
EPDM rubber surround while the internal suspension is said to use an oversized
spider, both to accommodate high excursion but retain linearity.
The motor
structure on the back of that cone is also appreciably oversized. The magnet structure weighs in at 204 oz
(12.7 lbs) that effectively constitutes fully 1/3 of the entire subwoofer
systems weight and weighs more than some 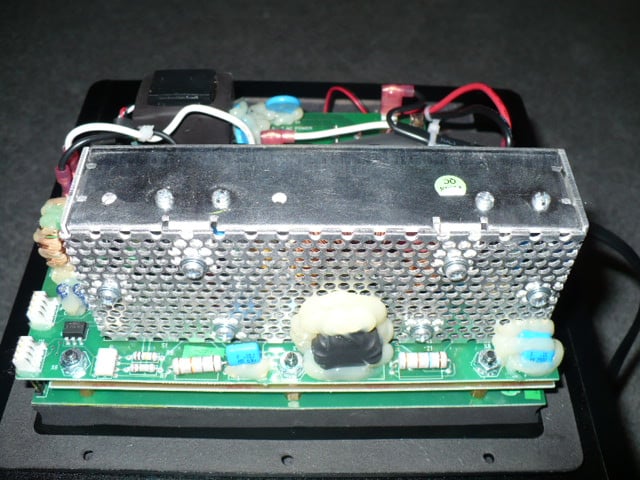 comparably sized subwoofer
systems. In between the cone and that
magnet is a high temperature, 2.5” diameter, dual wound coil. Coupled with a cast aluminum basket frame and
we have the makings of what should prove to be a very potent little driver.
comparably sized subwoofer
systems. In between the cone and that
magnet is a high temperature, 2.5” diameter, dual wound coil. Coupled with a cast aluminum basket frame and
we have the makings of what should prove to be a very potent little driver.
The Photon-8 is not video shielded but this is an ever diminishing
problem in this era of post CRT display technologies. If video shielding is an important
 consideration the Photon-10 is shielded, which provides an accommodating option
in the product line.
consideration the Photon-10 is shielded, which provides an accommodating option
in the product line.
The Photon-8 also boasts a
digitally controlled class D amplifier section that is said to deliver 1000
watts rms power and 2000 watts dynamic power.
Chrysalis jumps on the green bandwagon by pointing out its class D
amplifier is 95% efficient, producing minimal heat. This can be said to be true of all class D
amplifiers, and not specifically the Chrysalis amplifier, which are
considerably more efficient that traditional audiophile class A and AB
amplifiers. Based on the 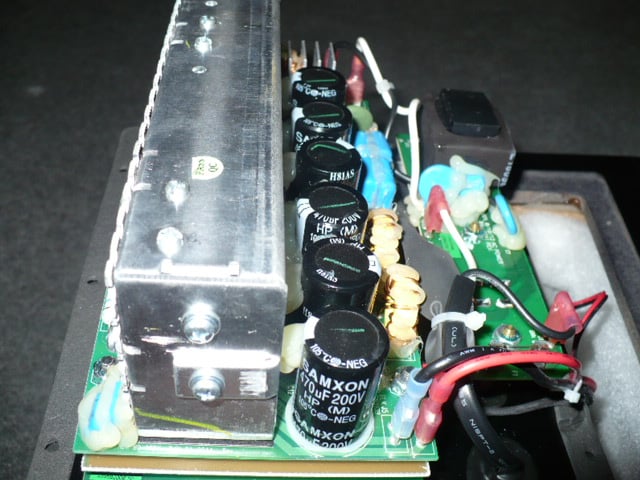 power
consumption rating of 8 amperes listed on the back of the unit at the standard
120 volts we get a power rating of P = 0.95(8A * 120V) = 912 watts which is
close enough to the 1000 watt rating that with a slo-blo fuse leaves little to
suspect the rated power of the amplifier.
power
consumption rating of 8 amperes listed on the back of the unit at the standard
120 volts we get a power rating of P = 0.95(8A * 120V) = 912 watts which is
close enough to the 1000 watt rating that with a slo-blo fuse leaves little to
suspect the rated power of the amplifier.
Both the amplifier and driver feature overload protection circuitry. The driver is digitally controlled with a current limiting driver servo to limit distortion by prevent clipping and over excursion. The amplifier section has thermal protection as well as protection against excessive voltage drops.
Disassembly of the Photon-8 to reveal the internals can only occur through the rear amplifier plate, which is secured with 10 wood screws around the perimeter. Inside the cabinet, fiber batting is wrapped around the outside faces of the cube and a second piece separates the driver from the electronics mounted to the back. The cabinet itself is constructed of ½” MDF with glued joints and triangular wedges used to reinforce the outside corners.
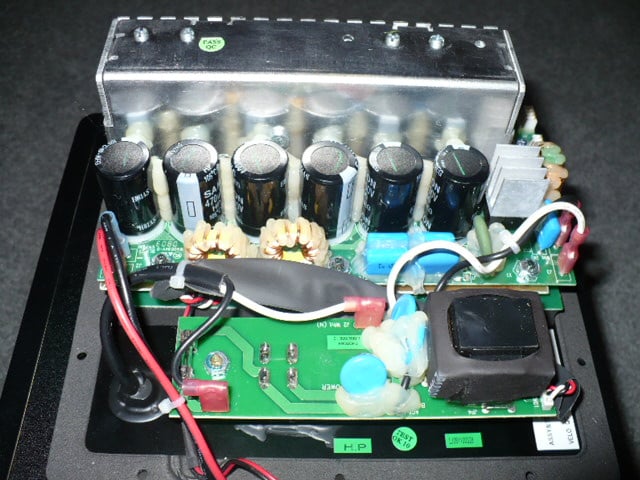
The amplifier, which is separated into two sections, occupies the entire back plate. One board dedicated to the power supply supporting the transformer and main fuses. The second tiered board supports the preamp functions and six 470 microFarad, 200 V power supply capacitors. There is a small heat sink to the side of the capacitors while the majority of the circuitry lives under a grilled metal housing.
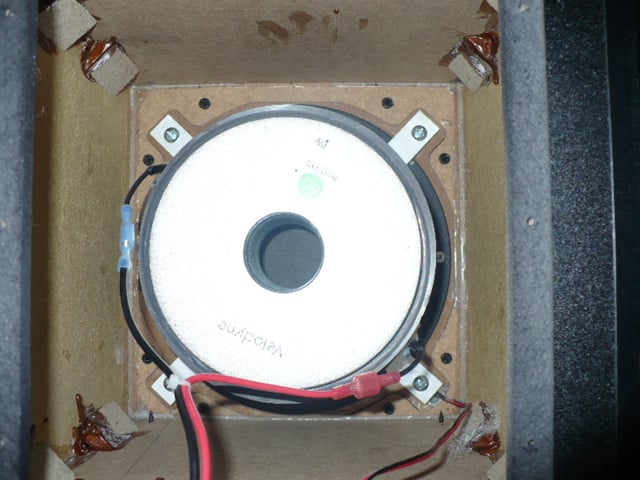
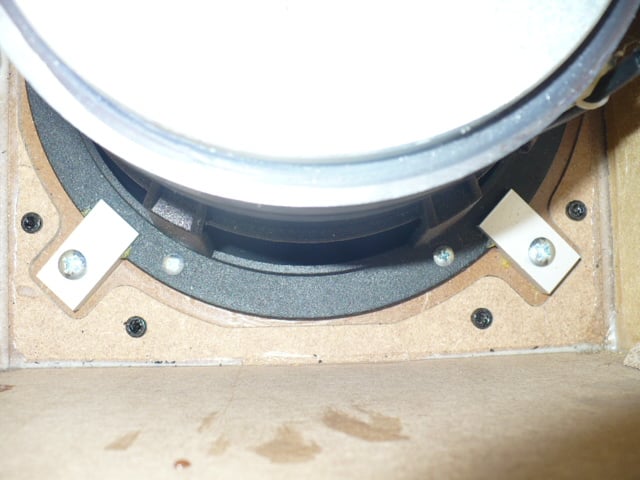
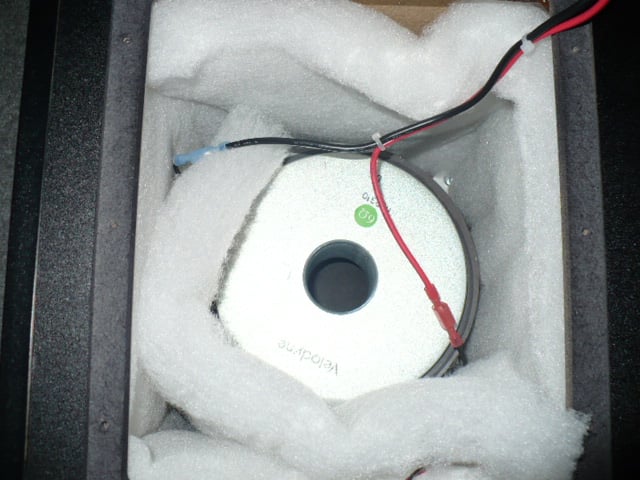
The majority of the interior volume is dominated by the driver, which fills about half of the space. The magnet itself, stamped with Velodyne and 6 ohms, is about 6 inches in diameter and about 2¾ inches thick. The powder coated cast aluminum basket, mounted to the inside of a two layer baffle with aluminum brackets and machine screws, appears quite sturdy.
Photon-8 Listening Test
System Setup
Setup for the Photon-8 subwoofer is standard once an acoustically acceptable location has been selected, place the sub, plug it in, and adjust the controls. If the subwoofer is used for an LFE channel with processor bass management, crossover bypass can be selected by switching the appropriate toggle from the internal x-over setting to subwoofer direct setting and plugging into the left RCA input marked LFE, otherwise dial in an appropriate frequency based on the roll off point of the accompanying main channels. After setting the crossover/bypass, next, using a full range source signal, adjust the phase to the setting that produces highest bass output with the main speakers. Finally, manually adjust the volume level to balance the overall system frequency response and use the processor functions for speaker setup to tweak the final output setting if using the subwoofer on a LFE channel.
Listening Evaluation
The Photon-8 subwoofer was evaluated using my A/V setup with a Toshiba HD-A35 used as source for HD-DVD, DVD, and CD content and a Play Station 3 for Blu-ray content. Audio processing and amplification were provided for using a Rotel RSX-1067 to drive a 7 channel Infinity Beta speaker array and to provide bass management at an 80 Hz crossover point. All source material used for the review was reproduced in its native format as either multi-channel or stereo with the Rotel set to two channel mode for stereo material and the Beta 40 towers engaged for reproduction of the mid and upper frequencies.
Normally I prefer being provided two subwoofers for review as it is easier to directly minimize certain room acoustics issues but for this review, I was sent a single unit. The advantage of multiple subwoofers is that they can be used to help limit modal coupling of bass frequencies to the room through judicious placement of the subs relative to the room, each other, and the listening position. I typically run dual subwoofers and shifting to a single sub presents an extra difficulty to sort out what is really coming from the sub and not from the room acoustics, which is best avoided if possible.
Editorial Note on Multiple Subwoofers
Multiple subwoofers are a good choice to smooth frequency response by minimizing room modal behavior through cancellation. Strategic placement of the subs at opposing nodal points for frequencies that trouble the listening area can be used to nullify the worst dips and peaks from the room modes. This is a distinct advantage over equalization, which can only trim peaks but not fill dips.
My own experience with running multiple subs has been a stark improvement with smoother frequency response, improved bass detail, and increased depth at the bottom end beyond what a single well placed sub can muster.
I am including several links where this topic is discussed in greater detail and also an Excel based spread sheet that calculates modes for a rectangular room:
During my time listening to the Photon-8, I found it to be a highly capable subwoofer despite its small size. For a subwoofer that looks like a computer speaker system sub on steroids, it was surprisingly able to put out a satisfactory amount of low bass content at SPL levels high enough to apply some tactile excitement to my listening room.
This is not to say that the sub does not have its limits, but there certainly are larger subs available that do considerably worse, both in terms of bass extension and in terms of maximum output. Overall, the Photon-8 did an excellent impression of being a larger sub than it was, never really sounding like a small sub.
The kilowatt of amplifier output is what drives the relatively low 26 Hz –3dB roll off point from a sealed subwoofer this small, but driver and cabinet size do take its toll on maximum SPL. While the Photon-8 can generate noticeable room shaking, during the most severe LFE demands, there was a point where the sub simply did not have any more to give. To the credit of the well designed and implemented protection circuitry, this point manifested itself as an unobtrusive absence, with little to no audible distortion to draw attention to a limit that would be given away by the floundering of a lesser subwoofer. As presented through the Photon-8, one will never know of the absence without already knowing what should have been expected.
As to musicality and overall sonic character, the Photon-8 fared very well. I found the subwoofer to have a clean sonic character that was full and well balanced. Compared to the very best subwoofers available at any price, the sound quality did have a slight bit of coloration, but any apparent coloration was minimal in an absolute sense and certainly as low or lower than many other price competitive designs.
Where the Photon-8 excelled was with low level detail and subtlety of presentation. Depth and detail remained in the Photon-8’s presentation even when rendering lower level LFE signals that further enhanced the impression of musicality in this subwoofer design. The Photon-8 was also able to maintain a nuanced presentation of the bass even while being asked to pound out higher levels of LFE signal.
Another strength was in its absence. The Photon-8 exhibited an excellent level of transparency through the crossover point, integrating into the overall sound field and drawing very little sonic attention to it when speaking up. My impression was that this sub was better at disappearing than other comparably priced subwoofers when using identical placement and crossover settings.
In summary, the Photon-8 can be considered a capable design by any standard and an outstanding design when taking into account its small stature.
 Blu-ray: The Fifth Element

Seems that this film is a bit of a favorite among the other reviews at Audioholics, so having recently upgraded my Super Bit DVD version for the (remastered) Blu-ray version, I thought that I would also make use of it. Being well aware of the poor treatment this film received despite being an initial BD release, first impressions of the format and all being at stake, I made sure I got the version that was copyrighted 2007, and not the 2006 version which was universally panned as sucking.
A great way to launch a format, don’t you think?
While this particular soundtrack does not have an overabundance of brutal LFE, it does have its share, but the bass, as recorded, is rather deep with good detail. The Photon-8 was up to this challenge, maintaining depth and nuance throughout the film. The score itself is an eclectic mix of styles with some traditional orchestral sections, Middle Eastern influences, and even some Caribbean and Reggae flavors. Strings, electric bass, and percussion were all given good treatment by the Photon-8 remaining well separated and with detailed and musical timbral characteristics coming through the subwoofer irrespective of style.
The film immediately opens with some rumbly deep bass effects that undulates and changes as the Earth rotates in view. The Photon-8 maintained the depth while handling transients and appropriately rumbling the room. Starship engines in this particular soundtrack are not overdone, allowing for some semblance of detail to the depth of the effects, which came through the Photon-8 nicely with some rumble. LFE as the dark planet forms and percussion pulsing as the discovering Earth Federation starship prepares to fire were subtle and deep. An electric bass is used in many of the varied and colorful musical sequences that are played tautly with some slap that the Photon-8 did well with, keeping the transients and articulations detailed while maintaining sonic depth. Percussion was always rendered cleanly by the Photon-8 with a lot of timbral detail coming through in the presentation. Double bass as well as the rest of the bottom end of the orchestra also retained good timbral character through this subwoofer.
HD DVD: Children of Men
 This is an excellent film that lately I have been looking to watch
again. While much of this film is quiet,
perhaps raising some eyebrows in its selection, there are a number of instances
filled with potent LFE that is surprisingly articulate rather than the more
usual boomy.
This is an excellent film that lately I have been looking to watch
again. While much of this film is quiet,
perhaps raising some eyebrows in its selection, there are a number of instances
filled with potent LFE that is surprisingly articulate rather than the more
usual boomy.
Once again, the Photon-8 was up to the task of smacking out the intense output without slobbering all over the actual sound quality. And in a movie this sonically stark, when the bass kicks in, it is obvious.
For examples of depth from the Photon-8, we have the solid rumble of passing truck traffic at various points in the film. Early on, a bombed storefront retains its staccato retort when the explosion is sent through the Photon-8. Jasper’s zen music shows off the subs ability to maintain composure with a bit longer of a pounding as this piece of electronica shakes the room. Then all is quiet until…tank fire. When I first watched the film, I was impressed with the quality and potency of this sound effect, a deep and penetrating thwack that manages to capture the sonic character of the shell exiting the turret muzzle; excellent through the Photon-8. As the battle rages, explosions and tank fire echoing through partially collapsed buildings, also excellent through the Photon-8. Then silence as mother and child are allowed to leave the building. When the battle resumes as the main characters move away, the thrumming explosions become increasingly distant, echoing deeply from the Photon-8. As the battle recedes into the distance, jets roar overhead and distant explosions sound in the surrounding silence. Overall, it was quite a good presentation from such a tiny subwoofer.
CD: Porcupine Tree: Nil Recurring
 A companion release to Porcupine Tree’s latest album, Fear of a Blank
Planet (FoBP), this EP consists of session material that did not make the
final track sequence of the album, but does not really consist of inferior B
side material. Featuring performances by
Robert Fripp and heavily influenced by King Crimson in composition, I find that
in some ways I prefer it to the main album release.
A companion release to Porcupine Tree’s latest album, Fear of a Blank
Planet (FoBP), this EP consists of session material that did not make the
final track sequence of the album, but does not really consist of inferior B
side material. Featuring performances by
Robert Fripp and heavily influenced by King Crimson in composition, I find that
in some ways I prefer it to the main album release.
I found that the Photon-8 was able to provide meat to the rendering of bass guitar and percussion throughout the album and was able to put some tactile emphasis on the thumping. Drummer Gavin Harrison does his usual fine job of providing much in the way of challenging material for sub testing and the Chrysalis performed well. The Photon-8 maintained good bottom end timbral characteristics and musicality while taking the beating and yet was still able to convey subtleties like low frequency studio acoustics/ambience effects.
The title track, an instrumental featuring Fripp, starts with a solid thump of bass drum that came through solidly on the Photon-8 while a somewhat more delicate bass guitar line moves in the background that was kept clean and separated by the sub. About a minute and a half in, the song picks up at least 3-4 dB of intensity, a transition that the sub conveyed cleanly. Towards the middle, the arrangement quiets and pars down to bass and percussion that retained texture and solidity with the Photon-8’s presentation despite the loss of driving volume levels. Even the finger work on the bass guitar strings stayed audible using the Photon-8. A number of other demanding tempo and rhythmic changes were also cleanly passed through the Photon-8 with the piece ending in a bit of thrashing that was well handled by the sub. Normal is a mirror to Sentimental from FoBP, its lyrical opposite if you will that shares the same choirs. It opens with an intricate acoustic guitar line that suddenly transitions to a thrashing, no problems with the Photon-8 taking it and staying clean. I find the verse musically somewhat reminiscent of Prince Rupert Awakes from King Crimson’s Lizard with Jon Anderson on guest vocals. During the verse, a coarse, highly textured synthesizer part is rendered with considerable detail by the Photon-8. At the choirs, the Photon-8 backs the bass guitar and drums with a solidity and then holds up well through some more trashing later when the second half of the bridge kicks in. A vocal fugue passage follows, quieting down, where the Photon-8 shows off musical chops handling timbre for low percussion well. Cheating the Polygraph opens with exposed percussion that come through the Photon-8 tight and clean with good timbral character and providing meat and substance to the bass guitar when it is added. The song changes gears at the choirs to heavy syncopated percussion and the Photon-8 handles the change staying clean and tight. The solo quiets down exposing the bass guitar and synthesizers. Using the photon-8, the bass was satisfyingly meaty while allowing detailed bass synthesizer detail to come through. The final track, What Happens Now?, is somewhat lighter. Here the Photon-8 supports the musicality at the bottom nicely. Bass guitar comes through delicately and the drums are nicely detailed on the bottom. The bridge picks up tempo, and the sub keeps pace with rapid, syncopated bass drumming and culminating in a retardando into an epic closing with swells of bass guitar while the drums pound away, all kept cleanly separated by the Photon-8.
CD: Peter Murphy: Unshattered
 Peter Murphy’s most recent effort,
Unshattered, features some nice fretless bass work and intricate synthesizer
programming that strays frequently into the depths. Interestingly, composer Harry
Gregson-Williams makes an appearance with songwriter, musician, and producer
credits on the opening track.
Gregson-Williams résumé includes the score of several of the most recent
installments of Metal Gear Solid video game franchise and numerous film
scores including Kingdom of Heaven.
Peter Murphy’s most recent effort,
Unshattered, features some nice fretless bass work and intricate synthesizer
programming that strays frequently into the depths. Interestingly, composer Harry
Gregson-Williams makes an appearance with songwriter, musician, and producer
credits on the opening track.
Gregson-Williams résumé includes the score of several of the most recent
installments of Metal Gear Solid video game franchise and numerous film
scores including Kingdom of Heaven.
The Photon-8 provided a solid support for the album at the bottom end. The sonic spectrum that the subwoofer provided the bass output was balanced with full and realistic instrument timbres as well as excellent transparency through the crossover point. Acoustic control of the bottom end was also good through the Photon-8, which did a fine job of presenting the inner detail of bass instruments and providing crisp transient response. When asked to speak up, that control was well maintained while the sub provided the requisite room rumble.
Idle Flow opens the album with a tight, dynamic synthesized bass line that the Photon-8 followed along with no trouble with bass that was solid and transients that were crisp. Details inside the synthesized bass line were clear and the timbral characteristics of drums at the bottom end came through the subwoofer. On Piece of You, low synthesized rumble gives way to tightly rendered fretless bass that had good control, depth, and timbre through Photon-8. Here, the listener was clearly able to hear the musicians control and articulation of the strings of the bass guitar on the subwoofer. Slapped bass harmonics during one section came through clean and transparently through crossover point with the subwoofer. During Emergency Unit, the Photon-8 conveyed depth of the synthesized bass and provided clean transients. The bass part is flavored with augmented chord structures that showed off the subwoofer’s ability to convey sonic complexities well. As the song ends, the sub rumbles away. Deep drum ambience present in Thelma Sings to Little Nell was exposed by the Photon-8’s presentation. The drums, which image hard right, localizing almost behind my listening position, suffered no interference form the sub that again displayed excellent transparency. As the tortured Blinded Like Saul grinds away, the bass line the came through the Photon-8 with solidity and intact detail. The Photon-8 also conveyed the recorded bass drum ambience, keeping tight control that was well separated from the bass guitar. Breaking No One’s Heaven opens with coarse synthesized bass pulsating in the background. Here the Photon-8 displayed good separation and control while providing the necessary potency. Bass guitar was also suitably solid through the Photon-8 with clean transients at the chorus. The recording distorts as the song closes with deep transient components present, sliding around the bottom, that the Photon-8 handled well.
Photon-8 Measurements & Analysis
Measurements were performed using the Sample Champion program developed by Paolo Guidorzi of Purebits. The program is a Maximum Length Sequence (MLS) program that generates an impulse response in the time domain from this pseudorandom signal. Fast Fourier Transformation is applied to the impulse response to generate the system frequency response. The operating principle is the same as that of the well known MLSSA program.
Test samples were taken using 16 bit resolution with a 48 kHz sampling frequency. Fast Fourier Transformations were performed at 64K allowing for a frequency resolution of .73 Hz, which is more refined than even 1/24th octave resolution at the lowest octave; the A0 key on the piano has a fundamental frequency of 27.5 Hz.
All measurements of the driver were taken nearfield and were referenced to a simultaneous, independent SPL measurement taken at 1 meter from the subwoofer.
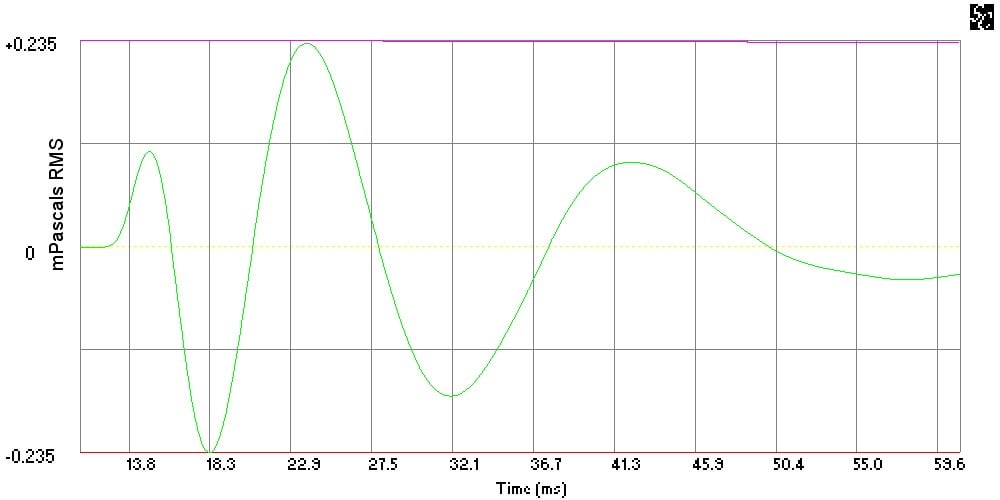
Figure 1: Nearfield Impulse Response
Figure 1 shows the impulse response of the Photon-8 subwoofer measured nearfield at an SPL of 80 dB at 1 meter.
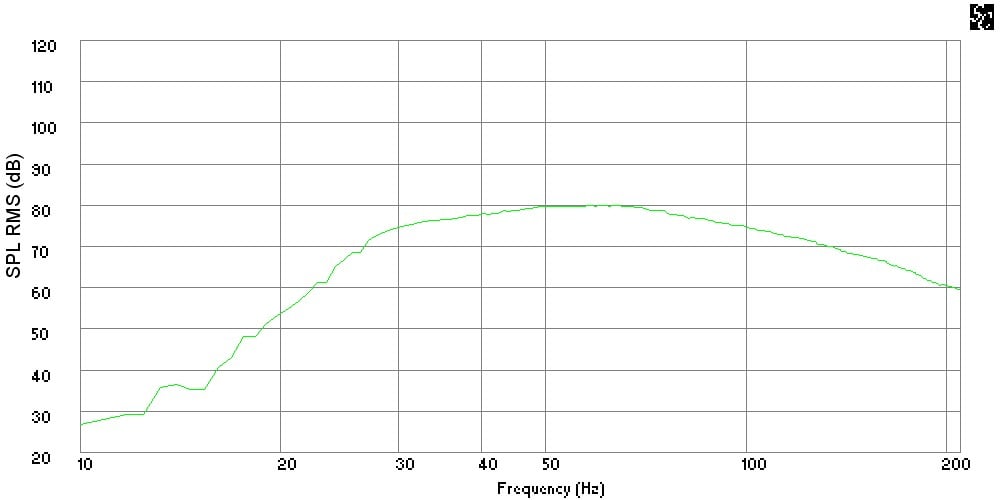
Figure 2: Nearfield Frequency Response
Figure 2 shows the nearfield frequency response of the Photon-8 at an SPL of 80 dB at 1 meter. The frequency response curve shows peak output in the 50 to 60 Hz range with some tapering of output below 50 Hz at approximately 6 dB/octave. Significant roll off of bass response begins around 27 Hz at an inflection point in the curve with an increased slope to approximately 45 dB/octave.
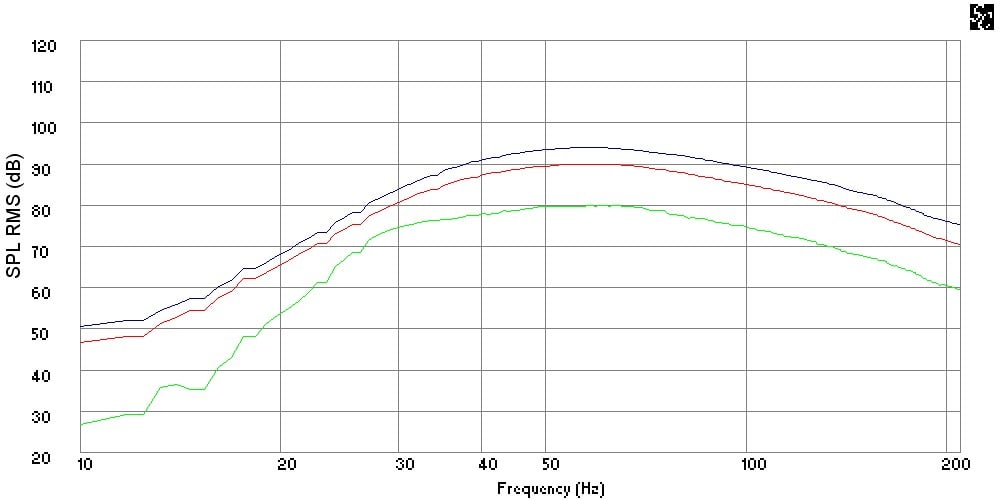
Figure 3: Nearfield Frequency Response at Various SPL
The curves in Figure 3 are overlays of the nearfield frequency response of the Photon-8 measured at various SPL. The green curve was measured at an SPL of 80 dB at 1 meter while the red curve is at 90 dB and the blue curve is at 94 dB SPL, both at 1 meter from the subwoofer. Maximum output at 94 dB at 1 meter, full gain set at subwoofer amplifier and 85% gain set at preamplifier. Further increases to the input gain did not increase the sound pressure output by the Photon-8 above this level, likely indicating the protection circuitry limit of the subwoofer.
Recommendations
When considering ultra compact subwoofers, the
expectation is that of maximum audio quality compromise to get something
discrete. Flabby or anemic bass from
small subs is the norm with low frequency roll off points that are too high to
be considered true subwoofers. Subs in
this size range usually come with HTiB systems, computer speakers, or are the bass
module with those cubed speaker systems.
They are certainly easy to hide, but ultimately disappoint anyone hoping
for actual LFE performance.
Despite its small size, the Photon-8 can output some unexpectedly deep bass at very respectable SPL levels while still maintaining a characteristically musical sound quality. The bass output was always solid, details present at bass frequencies in the recording were not buried under murk, and transient response was always clean and crisp.
While a sub woofer of this size does have physical limits whose effect can only be minimized with good engineering, it certainly will have little trouble outperforming many larger but lesser subwoofer designs. This sub can definitely add some tactile excitement at the bottom and over taxation of the Photon-8 is remarkably unobtrusive with very little that is audible to give away the distress. Sonically it performs as if it is larger than it is, never sounding small, inadequate, or underpowered.
The Photon-8 is a good subwoofer by any measure and an excellent subwoofer when taking into account its small size. If one is in the market for the smallest subwoofer possible but loathes the fact that small subs usually have some severe limitations on actually performing as subwoofers, the Photon-8 just might be the answer.
MSRP: $899
> Buy Now < @ Special Price
For more information, visit: http://www.chrysalisacoustics.com
The Score Card
The scoring below is based on each piece of equipment doing the duty it is designed for. The numbers are weighed heavily with respect to the individual cost of each unit, thus giving a rating roughly equal to:
Performance × Price Factor/Value = Rating
Audioholics.com note: The ratings indicated below are based on subjective listening and objective testing of the product in question. The rating scale is based on performance/value ratio. If you notice better performing products in future reviews that have lower numbers in certain areas, be aware that the value factor is most likely the culprit. Other Audioholics reviewers may rate products solely based on performance, and each reviewer has his/her own system for ratings.
Audioholics Rating Scale
 — Excellent
- — Very Good
- — Good
- — Fair
- — Poor
| Metric | Rating |
|---|---|
| Bass Extension | |
| Bass Accuracy | |
| Build Quality | |
| Fit and Finish | |
| Ergonomics & Usability | |
| Features | |
| Performance | |
| Value |
Professionally, David engineers building structures. He is also a musician and audio enthusiast. David gives his perspective about loudspeakers and complex audio topics from his mechanical engineering and HAA Certified Level I training.
View full profile