
JL Audio Fathom f112 Subwoofer Review
- Product Name: JL Audio Fathom f112 Subwoofer
- Manufacturer: JL Audio, Inc.
- Performance Rating:

- Value Rating:

- Review Date: October 31, 2006 09:25
- MSRP: $ 2200 - $2700
|
Frequency Response (+1/-3dB): 20-200 Hz Amplifier Topology: Class D switching Amplifier Power: 1500 W RMS (short term) Woofer: 12” (nominal) mineral filled polypropylene cone with a polyester foam surround Effective Piston Area: 84 sq inches Effective Displacement: 287 cu inches Maximum average SPL (in room): 117.6 dB |
Low Pass Crossover: 30-130 Hz variable at 12dB or 24 dB/octave Polarity/Phase: 0 or 180 deg/0 to 280 deg variable Dimensions (HxWxD): 18.00” x15.00” x 18.63” (Including feet) Weight (each): 115 lbs (net) Enclosure Type: Sealed enclosure. |
Pros
- Powerful sub capable of tactile bass.
- Detailed, precise low frequency output.
- Musical with excellent micro and macro dynamics.
- Superb build quality and finish.
- ARO feature will take the mud out of the listening experience.
- Heavy.
Cons
- Power switch located under grille.
- Automatic Room Correction (ARO) can be finicky to set.
- Gloss finish is easily smudged, requires frequent cleaning in the presence of little fingers.
- Heavy.
Fathom f112 Design and Construction
In engineering, there is always more than one solution to a problem. Each approach has its pros and cons as various factors are balanced that can not all be simultaneously achieved. Cost, quality, performance, and size are just the surface of all the decisions that must be made in the course of engineering a device to satisfy design requirements. Throw in subjectiveness of opinion, aesthetics, and preferences for décor in people’s homes and designing a device that still does its job well gets harder.
Devices that are intended to output bass have many contradictory requirements. To meet the audio demands, the drivers must be large, able to move the substantial volume of air for long wavelength bass signals, and the cabinets must be large, to tune the system to reach as low as possible. This also implies expensive, requiring sturdy cones capable of large movements, large driver motors to move the air, powerful amplification, and stiff cabinets to contain the movement.
Now try to do all this while keeping in mind: cost limits what one can afford to place in a home theater, often one or more occupants of the house does not want something big living in the corner, and if you can see it, will it look good with the couch and drapes? Function follows form?
As different manufacturers balance these constraints and take aim at the market, powered subwoofers have taken many forms. At one extreme are small and inexpensive devices with flimsy cabinets and undersized drivers whose performance leaves it open to debate if they actually fit an audio definition of a sub, but hey, they can be easily hidden. At the other extreme are giant brutes that command attention when they rattle the house, without care for what anyone thinks.
After nearly twenty years in the mobile audio business earning patents and awards, high end car audio manufacturer, JL Audio, has decided to step into the home arena. With the introduction of the Fathom and Gotham subwoofer lines, they have made clear their stance on subwoofer design.
JL Audio’s solution favors the latter category.
Design and
Construction
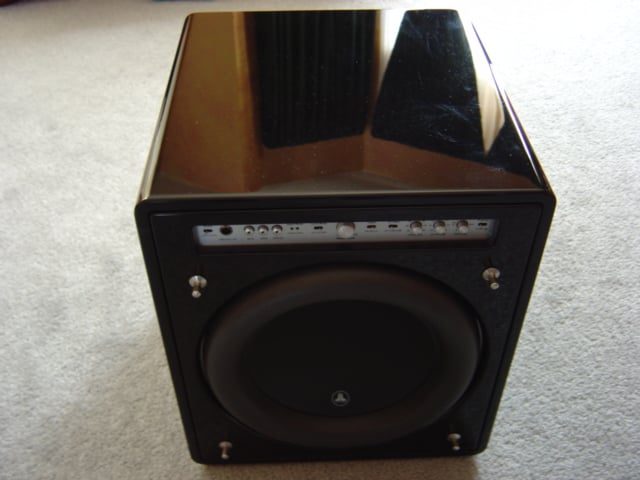
The JL Audio Fathom f112
is a moderate sized subwoofer but at 115 lbs, it is a fairly heavy one. The unit features a solid cabinet with
radiused corners that is well braced and about as inert as any sub I can think
of. The f112 is available in two
finishes, matte black and high gloss black that defines the pricing difference;
the review sample sported the latter finish.
The black cloth covered grille is formed of heavy thermoplastic mesh
with recesses for steel lugs, mounted to the cabinet, for attachment. The subwoofer sits on four large,
hemispherical rubber feet but has no option for carpet spikes. In some ways this is a moot point as the sub
is heavy enough that will it likely compress any underlying carpet and padding
to the sub flooring so it’s pretty much going to stay put.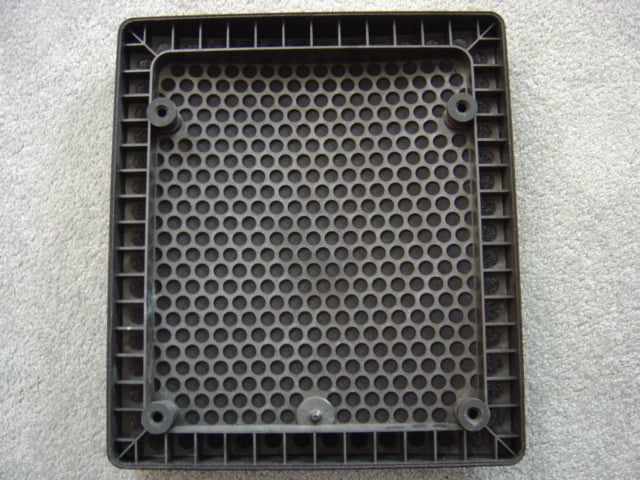
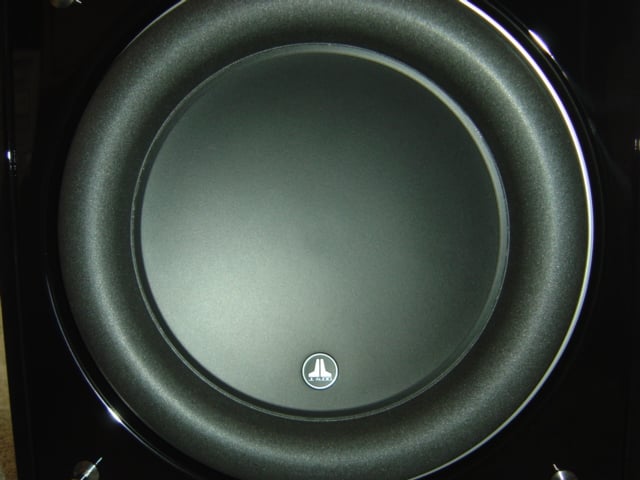
Of course, all the good stuff is under the grille and around back. The panel front sports most of the controls, set in a silver band above the driver with a musical instrument amplifier look: lever switches, knobs, and all. The 12 inch driver is hemispherical with an oversized foam surround that covers the mounting flange, which is recessed in a double layer front baffle. A JL logo badge adorns the bottom quadrant of the driver. All of this combines to give the f112 a rather serious look from the front.
Editorial Note on JL Audio Driver Surround Material
JL Audio uses a driver surround that is based on a multilayer polyester foam that considered environmentally resistant. Foam materials typically used for surrounds deteriorate from oxidation over time, requiring replacement to maintain the seal around the cone. After some discussion with design engineers, I learned that JL Audio has used this combination material and construction techniques successfully in mobile audio products dating back to the early nineties. The mobile version of the Fathom driver, the W7, has been in production since 2001 without problems where it withstands higher levels of user abuse and much harsher environments than are common in a home application. The engineers have also found that foam provides better support than rubbers with lower mass in high excursion applications.
I have included several links that give general environmental resistance information for various polymers:
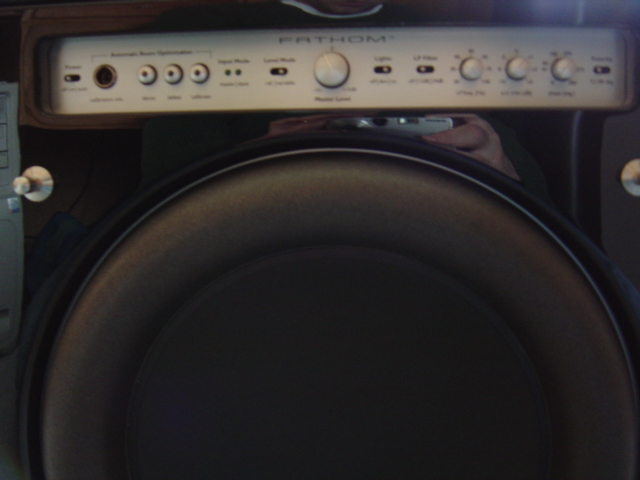
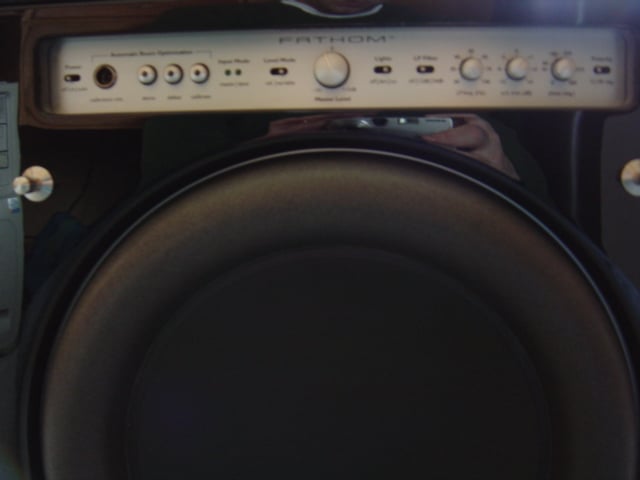 The front panel controls provide access to most of the subwoofer
settings. From left to right we have:
the power toggle switch, mini XLR input jack with three room correction push
buttons: demo/defeat/calibrate, master/slave indicator light, level mode
toggle, master level knob, toggle for lights off/dim/on, low pass toggle
off/-12/-24 dB, low pass frequency knob, low frequency trim knob, the phase
knob, and the polarity toggle for 0/180 degrees.
The front panel controls provide access to most of the subwoofer
settings. From left to right we have:
the power toggle switch, mini XLR input jack with three room correction push
buttons: demo/defeat/calibrate, master/slave indicator light, level mode
toggle, master level knob, toggle for lights off/dim/on, low pass toggle
off/-12/-24 dB, low pass frequency knob, low frequency trim knob, the phase
knob, and the polarity toggle for 0/180 degrees.
One of the few minor complaints that I had with this sub
is the power switch located under the grille.
For those of us who are more environmentally conscious,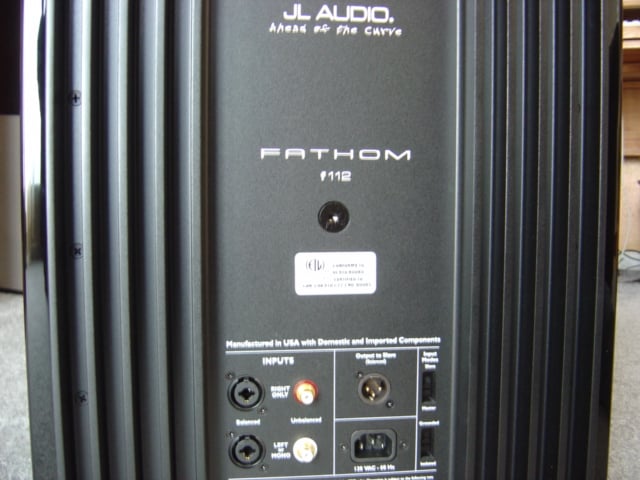 it forced me to
have to pull the grille off every time I wanted turn the sub on or off. Yes, standby mode is lower power consumption,
but it is still wasted power so I prefer to turn my gear off when not in use.
it forced me to
have to pull the grille off every time I wanted turn the sub on or off. Yes, standby mode is lower power consumption,
but it is still wasted power so I prefer to turn my gear off when not in use.
Around the back of the
unit is a black mounting plate cast with full height heat sinks to either side
that surround connection terminals located at the bottom, center. Connection options include balanced and
unbalanced stereo/mono inputs as well as a balanced mono output for connection
to additional Fathom subs. This
connection allows additional subs to be chained together in a master/slave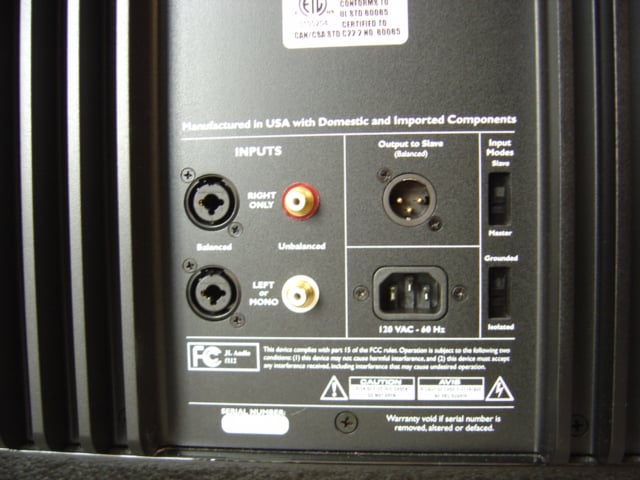 configuration to control all of the settings for the connected subs through one
master setting. The sub is supplied with
a heavy gauge detachable power cord that inputs below the balanced output. To the side of the outputs are two switches:
one to set the sub master/slave option and the other to set the sub as
grounded/isolated when using the unbalanced inputs. The purpose of the grounded/isolated switch is
to provide a fix for any possible ground loop problems between equipment from
sundry manufacturers. When the switch is
set to isolated, the RCA ground is disconnected and optical isolation is
engaged. If the sub hums, set the switch
to the other position; as stated in the manual, the correct position is the one
without hum.
configuration to control all of the settings for the connected subs through one
master setting. The sub is supplied with
a heavy gauge detachable power cord that inputs below the balanced output. To the side of the outputs are two switches:
one to set the sub master/slave option and the other to set the sub as
grounded/isolated when using the unbalanced inputs. The purpose of the grounded/isolated switch is
to provide a fix for any possible ground loop problems between equipment from
sundry manufacturers. When the switch is
set to isolated, the RCA ground is disconnected and optical isolation is
engaged. If the sub hums, set the switch
to the other position; as stated in the manual, the correct position is the one
without hum.
Exposed banks of large heat sinks are a hallmark of hardcore audiophile amplifiers, many of which use them to dissipate the substantial heat generated from class A and A/B operation. These sinks may be overkill for the much more efficient class D amplifier that the sub uses, but if thermally coupled to the voice coil/motor assembly, they might insure extra dissipation for the large excursion driver. When I spoke with JL Audio’s engineers, they did indeed acknowledge the heat sink’s thermal dissipation capacity was considerably in excess of typical designs, by intent. The sinks are meant to keep the amplifier completely cool and unstressed under full load in any installation, including built in types.
Editorial Note on Class D Amplifiers
Class D have traditionally been the amplifiers of choice for subwoofers where high efficiency provides high output wattages and limited frequency response sees demand roll off before any complications arise from these amplifiers when used for full range audio. Amplifiers of this sort are based on a concept called pulse width modulation (PWM) that allows the output transistors to operate as true switches in only an on/off state, greatly increasing efficiency. The down side is that these amplifiers can generate EMI/RF that affects audible sound quality and they have to operate at a frequency significantly above the audio signal. PS Audio, with whom I have some familiarity, has engineered a number of successful, well regarded full range PWM designs such as the HCA-2, which operated at a frequency of 500 kHz to make sure trouble was away form audibility.
For more reading on class D amplifiers and PWM use the following links:
- Switching Amplifiers: The Technology and the Issues
- en.wikipedia.org Pulse-width_modulation
- en.wikipedia.org PWM_amplifier
- sound.westhost.com pwm
JL Audio requested that the f112 not be disassembled for internal pictures. According to the manufacturer, special care has been exercised during assembly to make sure that the integrity of the seals is adequate for the internal pressures developed by the f112. Internal pictures were provided by JL Audio that consists of promotional shots of the internals for the larger f113 including a very nice exploded view as well as shots of the f112 during assembly. Other than a slight difference in size and electrical ratings, such as the larger driver and transformer, the two models of subwoofers are identical.
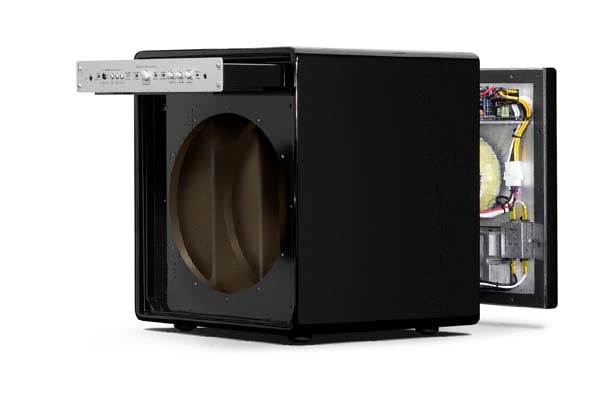 Inside the cabinet, the construction is of ¾” MDF
with substantial internal bracing and support rings for the driver. The preamplifier/signal processing and
amplifier circuitry is housed at in a separate chamber from the driver at the
top of the unit. The substantial driver
frame is thick cast aluminum and supports a motor structure built around a 7½”
diameter by 2½” thick magnet. A large
tordial transformer is mounted to the center of the back plate with an Allan
head screw. The amplifier is mounted
above the transformer where one can see a bank of five large output capacitors
to supply reserve power.
Inside the cabinet, the construction is of ¾” MDF
with substantial internal bracing and support rings for the driver. The preamplifier/signal processing and
amplifier circuitry is housed at in a separate chamber from the driver at the
top of the unit. The substantial driver
frame is thick cast aluminum and supports a motor structure built around a 7½”
diameter by 2½” thick magnet. A large
tordial transformer is mounted to the center of the back plate with an Allan
head screw. The amplifier is mounted
above the transformer where one can see a bank of five large output capacitors
to supply reserve power.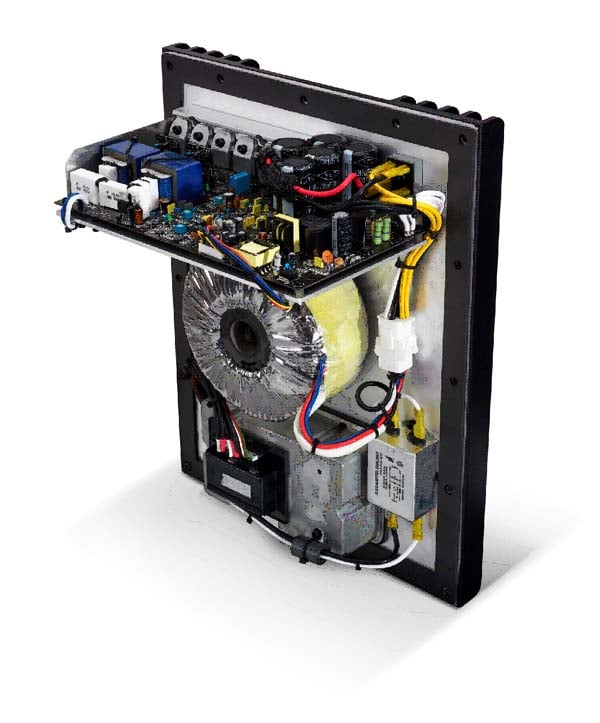
The Fathom subwoofer series is equipped with a host
of signal processing features. In
addition to the standard 0/180 degree polarity switch, phase can be set over a
continuous range from 0 to 280 degrees.
The low pass filter can be set to bypass, -12dB/octave Butterworth, or
–24dB/octave Linkwitz-Riley filter slopes with a variable crossover point from
30-130 Hz to provide flexibility when blending speakers. Gain can be set at a fixed reference or
variable from mute to +15dB. The
controls also include an extreme low frequency trim (ELF) with a –12dB to +3dB
range at 25 Hz to allow additional control over any troublesome room boundary
gain that might prevent flat frequency response. Lastly, there is an automatic single band
parametric equalizer function. Called
Automatic Room Correction (ARO), this feature can be used to eliminate the
largest room mode peak at the listening position. The ARO uses a high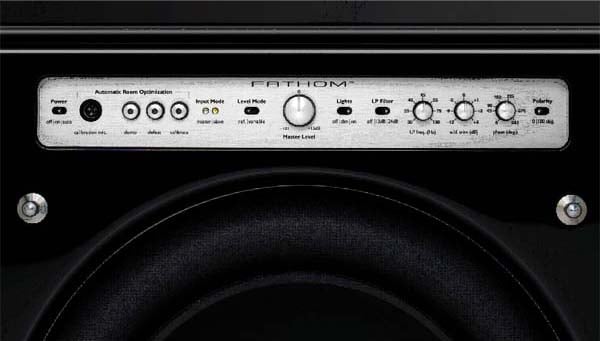 quality analogue
equalizer circuit to avoid cumulative error from redigitization and uses a DSP
controller that curve fits to the room response from an extensive library of
filter functions.
quality analogue
equalizer circuit to avoid cumulative error from redigitization and uses a DSP
controller that curve fits to the room response from an extensive library of
filter functions.
JL Audio lays claim to extensive R&D, testing, and high
tech manufacturing efforts for their driver designs. Extensive analytical simulation is performed
using a combination of software developed in house and the commercially
available Cosmos finite element software package. Rigorous prototyping and physical testing is
also performed to select the correct materials to meet design goals. Evaluating material alternates, advanced
construction techniques with stringent tolerances, and even testing product
durability under simulated aging are all part of the development process.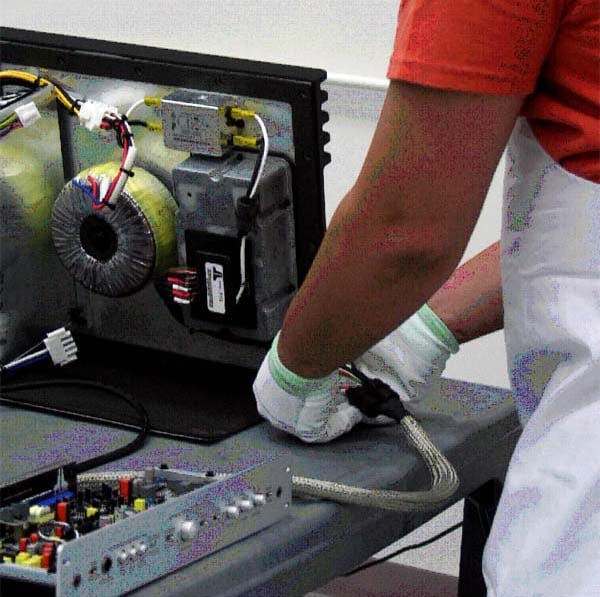
Amplifier designs for each product are highly optimized for the impedance curve of the system. To allow these amplifiers to develop the substantial output power quoted within the limits of typical home wiring, JL Audio looked at the demand trends from various source material. Home theater use for movie LFE finds extreme peaks at intervals that occur over relatively short time periods while music tends to a more sustained demand but rarely with the intensity of LFE. Using these observations, JL Audio tuned the current draw of the amplifier section with the real world dynamic demands from typical source material.
Research into high excursion driver behavior has lead to
designs said to be dynamically stable and capable of linear displacement in
excess of 3 inches. The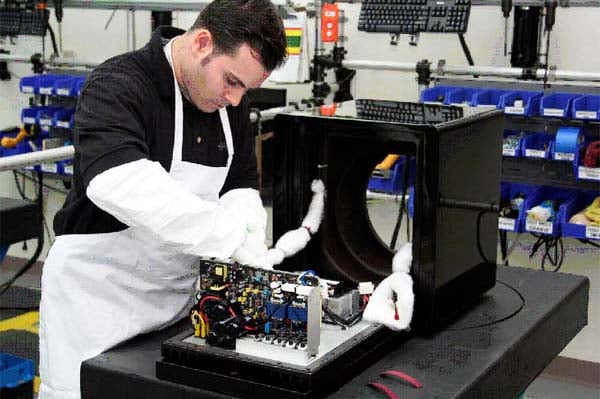 design
methodology applied to the Fathom subs has been to engineer a system, driver,
cabinet, and amplifier, etcetera that can develop the full excursion
envelope. This research has earned quite
a few U.S.
patents, with many of these technologies applied to the Fathom sub designs.
design
methodology applied to the Fathom subs has been to engineer a system, driver,
cabinet, and amplifier, etcetera that can develop the full excursion
envelope. This research has earned quite
a few U.S.
patents, with many of these technologies applied to the Fathom sub designs.
Innovations in electrical design include:
The Fathom amplifier section
consists of a pair of class D switching amplifiers that use a patented feedback
method (#6,441,685). The amplifiers used in the f112 are said to
be capable of unclipped output voltages equivalent to 1500 watts at 3 ohm
nominal impedance when compared to an equivalent loudspeaker.
Dynamic Motor Analysis (DMA):
proprietary optimization system used to improve the dynamic behavior of JL
Audio’s motor designs. The methodology
is used to design drivers that provide linear motor force at high excursions
and to stabilize the gap magnetic field over a wide power range. 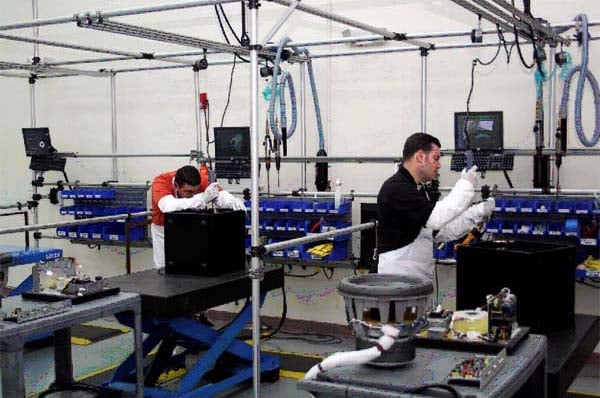
Mechanical
design innovations include:
W-Cone (#6,496,590):
a unit body cone assembly said to produce drivers with a high stiffness to mass
ratio and improved torsional rigidity for high excursion voice coil alignment.
The Floating Cone Attach
Method (#6,501,844):
a manufacturing technique that is said to maintain proper surround geometry in
assembling the driver for improved dynamic alignment.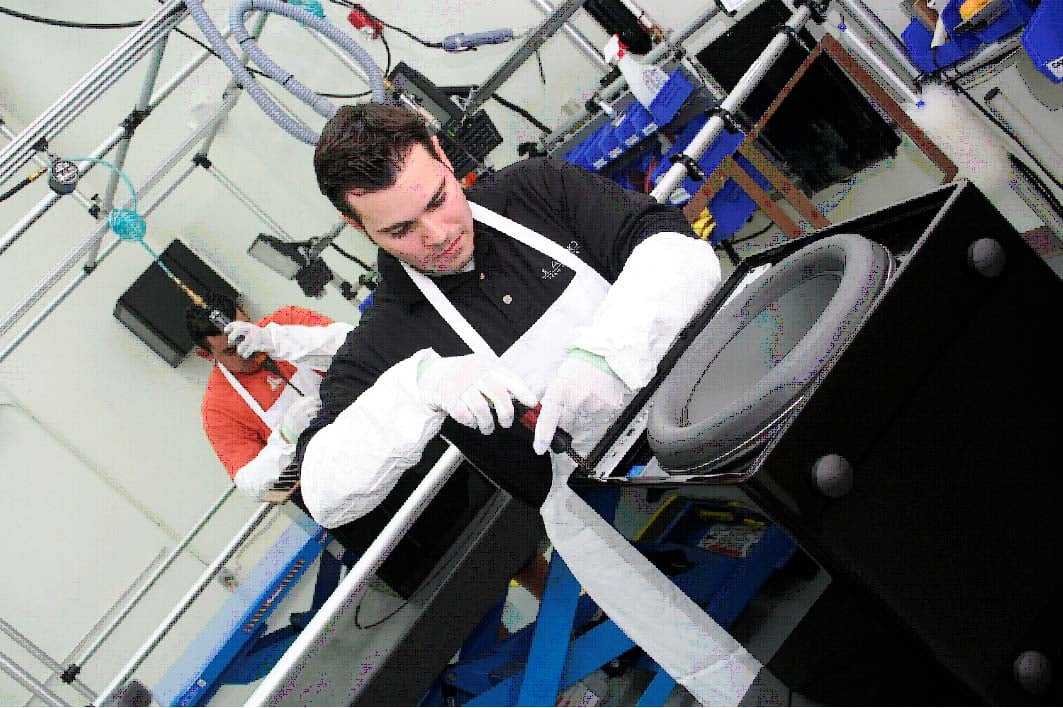
Plateau-Reinforced Spider Attachment (#6,118,884): derived JL Audio’s VRC technology that provides stress relief to the spider under high driver excursion.
Over-Roll Surround (#5,687,247 and #5,949,898): a method for attaching the surround to the outside of the mounting flange to allow a large surround roll required for high excursion movements without sacrificing radiating cone surface.
Clamp ring (#6,568,503):
a fitting used to connect the over-roll surround to the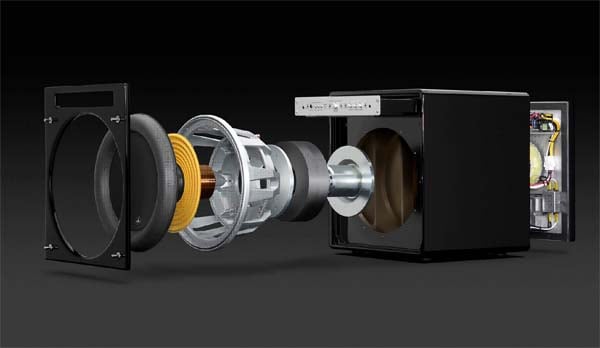 frame.
Thermal design improvements include:Radially Cross-Drilled Pole Piece (#6,243,479): directs airflow across the voice coil for improved power handling.
The drivers also employ what JL Audio terms Elevated Cooling Technology (#6,219,431 and #6,229,902): slots placed directly above the voice coil top plate allow additional airflow to minimize compression and enhance power handling.
System Setup
The Fathom f112 arrived well packaged in double boxes. The outer box has injection molded feet bolted to the bottom with machine screws to protect the package and perhaps even provide some degree of shock absorption. Opening to the inner box reveals a warning:
Whoa! Freeze! Read!
Don’t get all excited about unpacking the new sub, follow the directions to get the sub in place, right side up, and avoid becoming herniated.
Inside, the f112 is double wrapped in standard plastic and a black cloth cover. The kit includes instructions, the power cord, the AOR testing microphone, a mini XLR cable, and white gloves.
This sub is heavy, which is both good and bad. The good points all relate to audio performance, heavy implies such things as: powerful amplifier, substantial motor structure, and stiff cabinets. With improved performance, typically all these items add to the weight. The bad is simply the fact that proper positioning for optimum room acoustics will require one to move this brute, oh the pain and the pleasure.
The ARO feature is simple enough to use: set up the microphone at the listening position and press a button. The sub then sweeps through a series of pure tones and test tones until one of two things happens: calibration is complete or the sub level needs to be adjusted and the procedure restarted. If the level needs to be adjusted, the calibrate button will blink at about 1 Hz for a required increase or at about 3 Hz if the level is too high to complete the test. Test volume is a bit finicky and I had to rerun the test several times until I got the level right, fairly tight to 3 o’clock on the master level. At that volume level using pure tones, buzzing objects panned around the room as resonance was found for every object in turn. Once completed, however, I found the midbass a bit less bloated than without the calibration.
Being an engineer, I felt inclined to ask the designers why the ARO feature was made completely automatic without any user override. The answer was fairly straight forward: the feature is meant to be easy to use for consumers, which avoids mistakes that might cause poorer sound. The designers feel if extra control were required, such users would be better served with a dedicated multi parametric equalizer unit.
Listening Evaluation
I listened to the f112 using my A/V setup with multi-channel and stereo source material; there are several reasons for this, not the least of which is that this brute is heavy and unaccommodating to multi-room rearrangement. I also found my review focusing more on movies where extreme low bass is deliberately more prevalent.
In the home theater context, I found using this sub on familiar material quite engaging and revealing. This is not to say that I heard many things that I did not before, but not quite in this way. I use a pair of 650 watt Infinity CSW10 subs that are designed to force deep bass out of relatively small drivers and cabinets, a compromise with maximum sound pressure output. Specifications are down to 22Hz before roll off, but both together do not quite have the wattage of the f112 or the excursion capabilities so I found the delivery from the f112 was a bit more robust. While these subs are capable of shaking the room below 30Hz, they could not keep up with the intensity of the f112.
One other item of note, I also immediately noticed the switch from a dual sub setup to a single sub. This is no fault of the Fathom sub itself, but a room acoustics issue. Use of multiple subwoofers allows modal problems in room response to be smoothed out by cancellation. Strategic placement of the subs relative to walls and the listening position can be used to nullify the worst dips and peaks in the room modes at the listening position as well as increase total bass output. This is also a distinct advantage over equalization, which can only trim the peaks, not fill dips. My own experience with running multiple subs has been a stark improvement with smoother frequency response, improved detail, and increased depth at the bottom beyond what a single well placed sub can muster.
I am including several links where this topic is discussed in greater detail and also an excel based room mode calculation spreadsheet:
For information on the pros and cons of various schemes to wire multiple subs together visit:
I did do some A/B comparisons and I found that the majority of what I was hearing with the f112 was also present on my subs, but had less substance and clarity. The f112 could draw out some of the quieter sonic elements whose presence had not attracted my attention previously and was able to more cleanly separate impulsive content within the LFE channel.
Editorial Comment on Loudspeaker Resolution
Let me go into more detail about what I heard using the f112 to render movie sound effects. The explanation is twofold.
The explanation, in part, lies with headroom. The extra wattage and high excursion capabilities provided by the f112 extended dynamic range, which in turns leads to a perceived enhancement of detail. At the dynamic peaks, the amplifier is not struggling with extremes while trampling on the subtleties; better command of the cone forces it to be where it must to capture additional sounds. This is precisely the purpose of high wattage; the goal is not just to play the audio louder until it is as compressed as with lesser subs.
The other part requires one to consider the nature of events that the LFE channel is attempting to mimic; they are sounds that have some distinct differences from music. Explosion, collapses, gunfire, and the like are collections of impulsive sounds that often have anharmonic, aperiodic, discontinuous, and random relations. While music does contain impulsive transients, they do not occur with the same density as with sound effects and are often less erratic, allowing brief steady state motion. A quarter note at A4 with a tempo of 60 lasts a mere second but will undergo 440 vibrations, with integer harmonics, in that second, effectively becoming steady state within that rhythmic period. Other notes that may occur simultaneously have a rhythmic and harmonic relation even if the sound is musically dissonant because of the way scales are constructed: octaves are geometric progressions whereas harmonics are an arithmetic series.
A loudspeaker, by nature, is a harmonic oscillator whose movement is a continuous function. With impulsive sounds, a low resolution speaker may find that it is unable to move quickly between erratic, discontinuous transients, truncating maxima and minima while distorting the shape of the wave form. This is a subtle form of localized compression that will make sound effects resemble more of an amorphous sonic blob.
With the f112, I was able to better hear separation between individual impulsive pressure changes and with greater dynamic range than I have heard with my gear and considerably more detail than with a lot of other gear.
For those whose familiarity is with subs of a more modest wattage and frequency response, this becomes an entirely different matter. This is a potent subwoofer fully capable of plumbing the sonic depths to extract sounds that are typically beyond the reach of many devices called subwoofers. It will also rattle things in the walls whose very existence was hitherto unknown. When the f112 was asked to speak up, I occasionally was treated to the sound of my fireplace, various objects around the room, and when in the adjacent room, the walls flexing, clattering pictures and shelves.
Here I digress into my perception of differences in the way audio is practiced by home and mobile enthusiasts. My observation of the common mobile practitioner, identified by amorphous booms that seem to segue one into another from behind at the stoplight, are summarized in the following equation: loud + rattles = good. This antithesis of audio purity leads to overdriven amps with high Q drivers and cabinets for the purpose of making more bass than is present in the recording. Body panel buzzes that occur as the car is rattled apart from the inside are a bonus because more (any) bass and the ability to force objects to make rattling sounds is good. Proper ownership of the f112 will require consideration of the listening environment and acoustics to limit those sorts of unseemly sounds. The good news is that the JL Audio design does not pander to hardware shortcomings cited above, it’s up to the user to secure items in the house.
On movie scores and dedicated music programming, I found the f112 equally potent but more importantly, very musical. This gorilla can not only thrash around the mosh pit, it can turn a minuet. It is powerful yet nimble, able to dance its way through delicate acoustic instruments while cavorting about demanding LFE transients without losing step. Micro and macro dynamics were both well handled by the f112: acoustic jazz and orchestral scores were treated with respect and not given a black eye.
The Lord of the Rings: The Fellowship of the Ring

As I have said on other occasions, this movie is an excellent audio reference. Using DTS, the sound quality of the recorded score is lush, full, and nuanced with considerable low frequency content to test musicality of any sub; and the LFE is as demanding as any movie. It is easy to hear how a good sub not only pounds out special effects, but also frames out a score with a foundation that serves to contrast and enhance all the subtleties present in the midrange and treble.
Here is case in point for my earlier statement about A/B
comparison with my subs to verify if something new was musically present or if
the f112 was just better at separating out and drawing attention to subtlety
and details in the score while controlling LFE at full intensity. I found my attention drawn to many sounds at
the bottom I had not noticed before.
The f112 presented the LFE as potent with deep, clean
transients with well separated resolution of the impulses, while the orchestra
score sounded open and dynamic with enhanced naturalness in the depth of the
low strings, winds, and percussion.
Horse hooves, fireworks, thunder, volcanism, floods, and water falls
were dynamic with detail and tactile depth, rendered cleanly to the very bottom
with this sub. The rumble of battle and
impacts during the ‘Last Alliance’ was rendered tight and deep by the f112 with
shifting bass transients. Sauron’s
release from physical form physically passed through the room. Sauron’s voice, chanting spells through the
ring, had enhanced depth and clarity.
Scenes where Frodo succumbs and enters the netherworld were potent and
dynamic and the appearance of the Eye at Bree and Amon Hen were earthshaking. Quiet scenes, such as Bilbo’s introduction of
Hobiton, illustrated the richness added to the score, while various scenes with
the wraiths in pursuit, including weather top, were even more musically
taut. Isengard in 5/4, with orcs busy
forging weapons of war, demonstrated the f112’s ability to maintain a clean
bottom for the percussion and low brass, while controlling the LFE rumblings
with precision.
Serenity

An enjoyable movie, Serenity features good quality sound effects that will test the mettle of a sub. From rocket engines engaged in atmospheric flight, developing thrust for escape velocity from planetary gravitational wells, to vehicle reentry and landing, there is much demanded from any sub. All of the semiautomatic gun fire and explosions are bonus.
Throughout this film, the f112 delivered intense sound effects while cleanly rendering the music score. During the various ship maneuver scenes, I saw the JL driver move the better part of the 3” excursion claimed and maintain composure, delivering tight, well defined bass. Low instruments had a rich, musical bottom and instrumental transients at the lowest frequencies were crisp.
Serenity opens with an intense bass transient as the camera sweeps from an Earth under bombardment as a sky full of spacecraft flee. The f112 went cleanly through, shifting to distant explosions, to rocket propelled flybys. After an extended intro, comes the first planetary landing. Full thrust rattled my fireplace, but the f112, despite substantial excursion, remained clean. A tense passage through Reaver space showcased the Fathoms ability with subtle LFE and natural support for the low strings. The liftoff from the planet Miranda was again an intense experience, rattling doors and walls in my house, while the f112’s cone moved a substantial amount without audible complaint. The final battle in this movie is destruction galore, featuring battle in space, atmosphere, and on the ground. The f112 dynamically rendered the barrage of ship explosions, engine flybys, collisions, EMP pulses, atmospheric turbulence, and crash landings with aplomb. On the ground, the f112 continued dishing out the intensity; bursts of automatic gunfire were satisfyingly staccato with visibly precise driver movement, explosions were clean, as was the deep rumble of machinery. The f112’s performance was capped off with the closing score: low strings were tight, percussion was deep with layers and texture, and the f112 conveyed the recorded ambiance to the bottom.
Porcupine
Tree: Arriving Somewhere (DTS)

I had the good fortune to have been present at the concert on the first of the two recording dates at the Park West in Chicago, so I have some additional perspective when using this DVD as a reviewing tool: I know what the sound was like when it was recorded. The recording does a good job of maintaining the quality of the live sound, though, as with most concert recordings, the direct sound was likely pulled from the sound board and then mixed with additional live microphone feeds to include the sound of the hall and crowd noise in a controlled way. The audio clarity is good and the impact of the bass and percussion is intact enough that with the right equipment, some of it can be pulled back out and brought to life during reproduction.
Obviously, even a brute like the f112 does not have the raw wattage of all the stacks at a live rock concert, but there were times at the show when the bass would pound one in the chest and the f112 got it. No, not as intense, but it was there, as it was in the show. Again, my subs can do this also, but with less intensity. Less capable subwoofers will just circle to avoid this effect altogether. The louder I went, the better the f112 sounded, bass guitar was meaty, double bass drum bursts were tight and the various drum types, low toms and bass drum, always sounded realistic.
‘Open Car’ shook the room with the f112 opening the concert with the bass character presented as I remembered. Bass guitar during the bridge rumbled the room and the double bass drum arrived in staccato bursts during the solo. Meaty bass guitar in ‘Hate Song’ moved rattled around the room and during the bridge, the f112 conveyed the chest-vibrating bottom that actually resonated the couch cushions as well. The f112 conveyed varied percussion with a natural sound to the lowest frequencies during ‘Don’t Hate Me’ and the moving bass line during the solo maintained timbral stability as it transitioned between the sub and the mains. ‘The Start of Something Beautiful’ opens with synthesized bass that was full and combined cleanly with the bass guitar as it segued in. With ‘Halo’, the f112 carried off the meaty bass guitar while staccato double bass drum bursts popped full and tight, during the solo and at the end.
Talk Talk: Laughing Stock
The final album from Talk Talk is the musical culmination to a journey of transformation, from derivative ‘80’s synth-pop that landed the first record deal to experimental composition ending that same deal. This commercially unappreciated album is in many ways a modern masterpiece. The organic song structures and arrangements do not adhere to any conventional form and the content draws from ambient, jazz, modern chamber orchestra, and avant-garde. Spare, desolate, melancholy, sublime, layered, textured, intense, acerbic all describe these fluid compositions at different points. Quiet, intricate motifs drift into dissonant, atonal string and wind arrangements or are occasionally punctuated with grinding guitar feedback.
I found the f112 contributing to the overall sense of space this music creates. Separation and clarity of the bass instruments were the beneficiaries of well controlled micro dynamics. Double bass was articulate and detailed, subtle transitions with electronics were audible, low winds were natural, and the loosely tuned bass drum head retained its character. Throughout, the f112 was delicate and smooth while still rumbling the room when required.
‘Myrrhman’ opens to solo guitar with heavy tremolo, moving smoothly between the f112 and the mains. Plucked acoustic bass was simultaneously robust yet light and detailed and the occasional percussion was natural. Bowed acoustic bass shifted from note to note smoothly with depth and warmth as the piece closed. Double bass was rendered light and articulate yet full on ‘Ascension Day’ and the bass drum popped nicely with the f112 cleanly conveying timbral characteristics. The f112 handled room rumbling electric bass on ‘After the Flood’ while still reproducing the performer’s delicate articulations where inside the notes, elliptical crescendos and decrescendos were audible. Vibrato in the low solo guitar opening ‘Taphead’ again seamlessly transitioned the crossover point. The f112 displayed excellent micro dynamics when, towards the middle of the piece, the wind instruments form a shifting tone cluster while a bowed double bass moves in and out of the background, segueing into a subtle rhythm with room rumbling depth that was still delicately aloft, separated. The light, articulate double bass and percussion throughout ‘New Grass’ was detailed and deep with the Fathom, all the delicate timbres reproduced. Finally, on ‘Runeii’, the low solo guitar part was supported by the f112’s delicately rendered double bass.
Dave Holland Big Band: What Goes Around

To get a handle on what the Fathom would do to the sound of delicate acoustic instruments, I once again turned to this excellent recording by this excellent musician. A sub that reproduces explosions well is nice, but the sound is faked. It is intimate familiarity with live acoustic music where one can tell what is right or wrong with audio reproduction. Dave Holland’s ability to walk, run, and dance over the neck his double bass showed the f112 again in fine form.
The Fathom’s reproduction of the double bass was tight, articulate, and full. Transitions between the sub and mains were seamless across bass runs with stable timbre and natural sounding reproduction. The percussion presentation by the f112 was tight with a nice kick. The sub was musical, reproducing a contiguous whole with these charts.
The up tempo ‘Triple Dance’ saw the f112 providing the bottom of a moving bass line that was light but solid. Low brass, bass, and drums sounded natural and unstrained. Followed by ‘Blues for CM’ which slows things down, the f112 did well handling the slower walking bass line. The Fathom was able to cleanly render the Holland’s articulations and the baritone sax part was solid and natural with this sub. ‘Shadow Dance’ opens to a bass solo where, using the f112, I was able to hear flavors of body vibrations in the instrument. Sound from the f112 was clean and well integrated across the sub and mains; fundamentals in the double bass were detailed and articulate while still reproduced with a rich sound, all the delicacies were present. The f112 provided punch for the drumming, particularly the solo, while remaining light and still providing distinct timbral characteristics of various drums.
Nelhybel: Trittico; Albeniz: Feastday
in Seville; Dello Joio: Variations on
a Mediaeval Tune; Grieg: Funeral
March for Rikard Nordraak; Giannini: Symphony
No. 3 for winds
Dallas Wind Symphony, Fredrick Fennel (Reference Recordings)
These performances, dating back to 1992, feature the Dallas Wind Symphony conducted by Fredrick Fennell, were recorded using a prototype device that subsequently became HDCD. Fennell’s credentials include founding the Eastman Wind Ensemble and establishing wind ensembles as a serious medium that now prospers at educational institutions across the United States. Represented are a range of compositions, both transcriptions as well as original wind compositions, which are very well recorded.
Editorial Comment on Subsonics
One of subtleties of audio reproduction is the ability to capture sounds that occur beyond the range of human hearing. Current psychoacoustics thinking suggests that the presence of ultrasonics, while inaudible themselves, are necessary for natural audio reproduction because of the wave interaction with audible frequencies. High sample rate recordings and speakers with ultrasonic frequency responses are available but this also can be extended to subsonics whose presence at real performances is lost on many systems. For low frequencies, phase interactions between audible bass and subsonics will affect the perception of the audible sound. Spend time in an orchestra hall; low frequency pressure changes that are not audible as continuous sound are present. The notes themselves may settle into steady state vibration, but sudden instrumental entrances, heavy articulation, and percussion will generate impulsive pressure changes that propagate as waves. Well recorded music, particularly in a large hall will have this type of sonic information.
With the Fathom, this dynamic recording was both potent and natural. Hall ambience abounded at the bottom end giving a sense of space and depth to the recording. Careful listening of f112 with this recording revealed that the sub was reproducing concert hall subsonics present in the recording. They were subtle, a closely located ear could hear them discreetly, but their presence enhanced the lifelike qualities of the recording. At all times, the Fathom kept instruments at the bottom clean and well separated, maintaining detail at various dynamic levels without jumbling the bass. Quiet movements had an accurate, natural timbral quality and the more aggressive sections were deep, dynamic, and potent without the f112 drawing undue attention. It just went about its business of making music.
‘Trittico’ is comprised of two movements of bombast surrounding a more sublime second movement. The concert bass drum used for the allegro maestoso and allegro marcato rumbled the hall with a deep resonance that was neither more nor less tight and clean than the drum itself. Trombones, tubas, bassoons, and the like had a well supported and defined bottom end. The adagio rich with low brass that was well blended and the tympani had defined low end detail with the f112. ‘Feast Day in Seville’ builds slowly; hall ambience in the percussion and low winds was well supported at the bottom by the f112, culminating in several fanfares, each more glorious than the previous. Here the Fathom portrayed the low brass with depth, as potent and lush, while maintaining clarity in the lowest frequencies of the chord structures. Closing with ‘Symphony No. 3’ the f112 handled dynamic swells between fanfares in the allegro energico seamlessly with the mains. Low brass and percussion were rendered solid and deep. The adagio was warm, exposed tubas were natural in character and the delicate tympani part was precise. Interaction between high and low instruments in the allegretto was natural and smooth across the f112 and the mains. Closing with the bombast of the allegro con brio, the f112 delivered room rumbling intensity but was able to reproduce tubas, trombones, euphoniums, and percussion with distinct separation and clarity.
Fathom f112 Measurements
Measurements were performed using the Sample Champion program developed by Paolo Guidorzi of Purebits. The program is a Maximum Length Sequence (MLS) program that can generate an impulse response from this pseudorandom signal. The Fast Fourier Transformation is applied to the impulse response to generate the system frequency response. The operating principle is the same as that of the well known MLSSA program.Test samples were taken using 16 bit resolution with a 48 kHz sampling frequency. Fast Fourier Transformations were performed at 64K allowing for a frequency resolution of .73 Hz, which is more refined than even 1/24th octave resolution at the lowest octave; the A0 key on the piano has a fundamental frequency of 27.5 Hz.
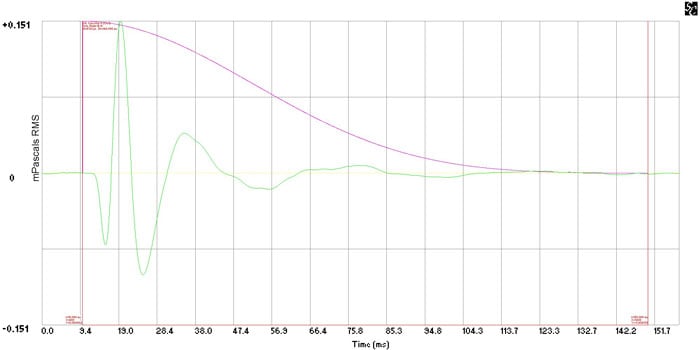
Figure 1: Impulse response.
Figure 1 is the subwoofer’s impulse response. The basic shape of the curve is typical of low frequency driver; here we see a fairly smooth curve that decays within a few cycles indicating good damping characteristics.
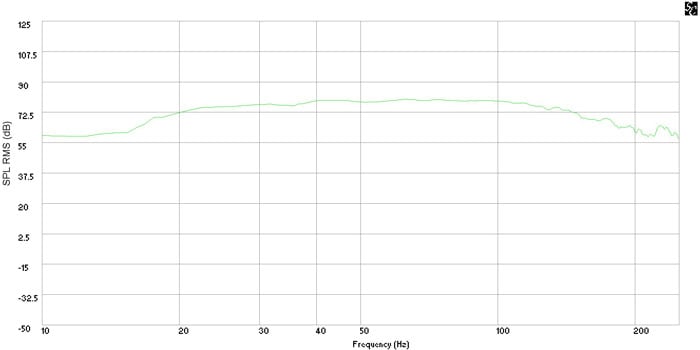
Figure 2: Frequency response.
Figure 2 shows the nearfield frequency response for a sound pressure level of 80 dB when measured at 1 meter. Significant roll off starts to occur around 21 to 22 Hz based on this measurement, which is within reasonable measurement tolerance of the published specifications.
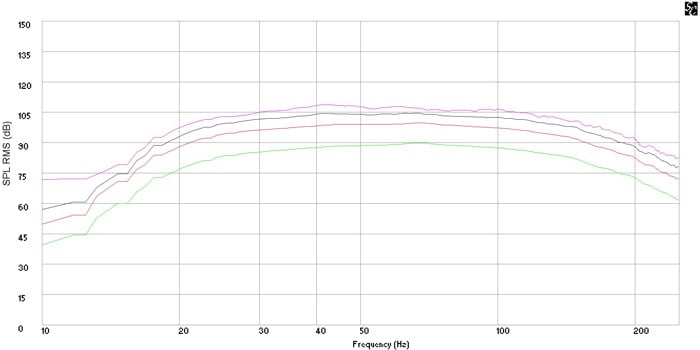
Figure 3: Power compression curves.
Figure 3 shows frequency response at various SPL levels at 1 meter. Measurements were taken nearfield with peak sound pressures of 90, 100, 105, and 109 dB when measured at 1 meter from the sub. Analysis of these curves must include some understanding of measurement and instrumentation limitations. Due to environmental conditions prevailing in a Chicago winter, ground plane measurements were precluded as a possibility and due to the high output capabilities of this sub, nearfield measurement of max SPL caused clipping of the microphone preamp as volume is increased.
Tests I performed indicate that the sub can get between 105 and 109 dB at 1 meter before compression using a wide band frequency input such as an MLS signal. Consideration of measurement accuracy at high SPL must be tempered with understanding that MLS testing is sensitive to any nonlinearity in the measurement, including from test gear. The microphone preamp indicated clipping at 109 dB under the maximum gain adjustment I could make, so it is very likely that the f112 can actually get higher than indicated by these measurements.
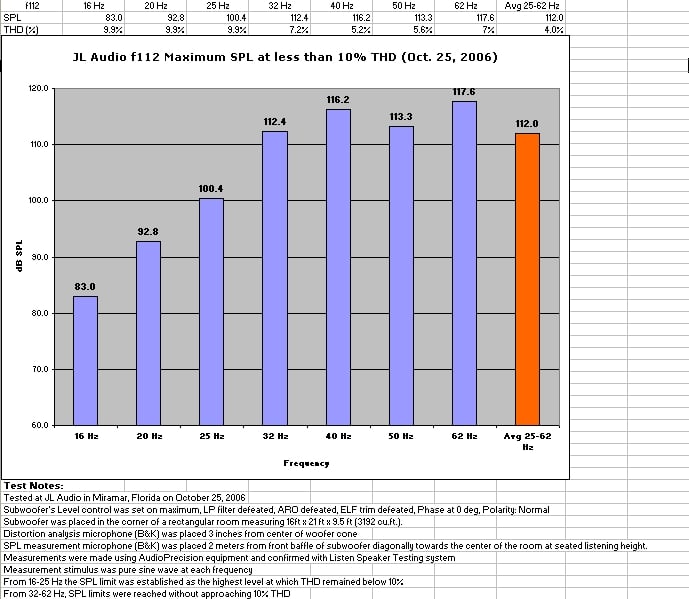
Figure 4: Maximum in room SPL at 2 meters by frequency.
Figure 4 was provided by JL Audio with a reported maximum rms SPL output of over 117 dB for a single frequency, a 62 Hz sine wave, and 112 dB averaged over a range between 25 and 62 Hz with THD between 5.2 to 9.9% for various frequencies, in room at 2 meters.
For real world input signals, such as music, the frequency content will be somewhere between these two limits and correspondingly, the SPL output will also be between these two bounds. Either way, SPL that exceeds 109 dB is a substantial amount of output.
Fathom f112 Conclusion
The JL Audio has produced a very serious subwoofer in the Fathom f112, the smallest sibling in their home audio line. Considering that fact, its big brothers must be dead serious. This is a powerful sub capable of prodigious deep bass output. Make no mistake; if the reader has loose objects in the house, this sub will locate them and point them out. Also, be prepared to find interior partition walls complaining into adjacent rooms. For the best possible listening experience, find all loose items and secure them.
This is a well-built subwoofer with a solid cabinet and a high quality finish. For those who select the gloss finish, it is easily smudged, but that is the nature of the finish, not a shortcoming of this particular manufacturer. The cabinet is well braced and solid, which will keep it from making music of its own to the detriment of the reproduction.
The Fathom f112 subwoofer represents a significant challenge to companies traditionally associated with high end home theater subwoofers. It is certainly not hacked gear translated from car to home. The reader will be hard pressed to find a sub that can belt out more clean low end output unless they turn to the bigger JL Audio subs.
Is the Fathom a good value? It depends on how one looks at things. At $2700 a sub, it is roughly 10 times the cost of common HTiB and 50 times the cost of the cheapest. Products in this price range are not really intended as bang for the buck. On the other hand, considering the prices of other top end subwoofers, I believe this sub will perform well against more expensive competition so in that sense, it can be considered a value.
For those who have not experienced a subwoofer capable of generating bass to the limits of human hearing, one with substantial output capabilities down into the subsonic range, do so. It can be argued that a subwoofer without significant capability below 30Hz is no subwoofer at all, but merely another woofer. It is not uncommon for tower loudspeakers to play down to 30Hz, and there are high-end speakers can make it lower, albeit with some compression at high SPL.
Another word of advice for those who are pondering budgeting for a LFE actuator to accompany a sub, do not compromise on the subwoofer to accommodate the cost of an LFE actuator. When planning, consider this: sound quality will suffer from performance lost in the sub and tactile output comes with the kind of sub that can hit the deepest bass. If consideration of an actuator is neighbor driven, structure borne sound transmission will likely invalidate this as an argument. There are sounds in movies that cannot be heard, or felt, with a +30 Hz sub. If you can afford quality in both devices, that’s nice, if not, focus on the sub. Even better yet, spend the LFE actuator budget on a second sub. It will kill some room modes and increase the total output, both of which will boost LFE rumble. The JL Audio Fathom subwoofers should be on the short list.
I am pleased to say, the f112 will be making a home in my reference system. It makes for a fine benchmark against which other high performance subwoofers will be judged.
JL Audio Inc.
10369 North
Commerce Parkway
Miramar, FL
33025-3962
USA
Telephone: (954) 443-1100
Fax: (954) 443-1111 (general)
Fax: (954) 443-1108 (tech support)
The Score Card
The scoring below is based on each piece of equipment doing the duty it is designed for. The numbers are weighed heavily with respect to the individual cost of each unit, thus giving a rating roughly equal to:
Performance × Price Factor/Value = Rating
Audioholics.com note: The ratings indicated below are based on subjective listening and objective testing of the product in question. The rating scale is based on performance/value ratio. If you notice better performing products in future reviews that have lower numbers in certain areas, be aware that the value factor is most likely the culprit. Other Audioholics reviewers may rate products solely based on performance, and each reviewer has his/her own system for ratings.
Audioholics Rating Scale
 — Excellent
- — Very Good
- — Good
- — Fair
- — Poor
| Metric | Rating |
|---|---|
| Bass Extension | |
| Bass Accuracy | |
| Build Quality | |
| Fit and Finish | |
| Ergonomics & Usability | |
| Features | |
| Performance | |
| Value |
Professionally, David engineers building structures. He is also a musician and audio enthusiast. David gives his perspective about loudspeakers and complex audio topics from his mechanical engineering and HAA Certified Level I training.
View full profile