
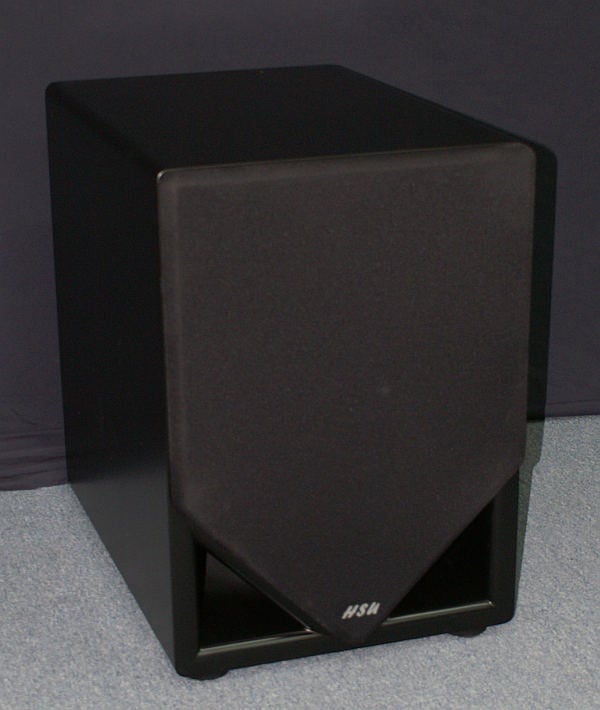
HSU VTF-15H Subwoofer Review Supplemental
This article is an addendum to our original research and testing of the Hsu Research VTF-15H subwoofer. One of the statements we have read online since publication of the original review, is about our failure to use the sub with a bass management system, which can cause it to sound muddy if the internal crossover was bypassed. Well, we were silent on the issue, but in point of fact during my listening tests with the Hsu VTF-15H, I did in fact use a DSP based loudspeaker management system, the Xilica XP-4080. (http://www.xilica.com/?c=78&cat=2&id=5) This is a $1200 system meant for professional use, and I have one in my laboratory. I failed to mention its use because frankly it is overkill for a $1000 subwoofer. For the record, when I bypassed the Hsu's internal low pass filter, which is limited to a top cutoff frequency of 90 Hz, I used the DSP system and varied the crossover point up as high as 120 Hz. I listened to the Hsu with the crossover set as both a third and fourth order (18 or 24 db/octave) low pass. My complaints from my listening tests with the Hsu were in NO WAY based on its high frequency performance which I found excellent for a subwoofer. It was based on the poor damping near 30 Hz which is evident at or near maximum output levels of the system. NO BASS MANGAGMENT SYSTEM can cure that ill, it can only limit the output of the Hsu sub to its linear maximums.
Because many of the shootout entrants have multiple controls allowing multiple settings which can result in a nearly infinite number of potential results to be fairly and accurately measured, each shootout entrant was given instructions to send me ONE SET of settings which I would use for CEA testing to determine the maximum output of the subwoofer. Dr Hsu was there in person for testing, and was able to tell me himself which settings we would use for our test. Despite that fact, we have received considerable criticism for failing to test the alternate mode of the subwoofer, stuffing one of the ports with a provided foam plug. This foam plug will lower the tuning substantially and at the cost of maximum output at higher frequencies. We have read and heard that this extended mode offers great advantages.
So, because of the numerous requests by both our readers and readers on the AVS Forum, to review and perform additional testing on the HSU VTF-15H subwoofer, we did this. Not only did we perform more CEA 2010 standard maximum short burst SPL tests, we repeated the CEA tests with the supplied unit three additional times. First repeat test measured the result with a single burst. The second round of testing was performed as per the first except using 8 bursts, repeated at one second intervals and averaged by computer to lower the “random noise” floor. This method improves the signal to noise ratio in order to gather more reliable results in the event random noise like that generated by passing trucks is entering the measurement space and interfering with the SPL results. Finally, a third test was run later in the test day, after the ambient temperature increased. Prior to the third test, the microphone was re-calibrated at this new temperature and humidity. (The morning was cold and damp, and the afternoon, sunny and mild).
In the morning the amp was cold, and in the afternoon, it had been on (without playing signals) and had become warmer. The same tests were once again performed at this higher temperature and lower humidity (both of which can cause variations in the pressure and microphone performance.) All four sets of results are shown at the end of this article, followed by a short summary for those of you who want to get right to the max SPL numbers without reading through the many steps on the way which helped to lead us to our conclusions.
In the current CEA 2010 standard, the majority of systems with ports on the bottom will appear to have more output at the lowest frequencies (where the port takes over from the woofer) relative to the frequencies over which the woofer is the primary or sole radiator producing acoustic power for the sole and simple reason that the mike will be closer to the port, than the center of the speaker. In plain English, the current standard should cause the curves to tilt, in favor of greater output in the region where the port contribution is highest. (Which is almost always the lowest frequency in the range of the system). This is not a situation where manufacturers, always fighting to get lower and lower frequency performance in smaller and smaller boxes, are likely to be standing in line to complain about for what we had hoped, were quite obvious reasons. (Till we started reading the blogs that is). We addressed this issue in our Audioholics 2010 Subwoofer Shootout Measurements overview document but it apparantly escaped the attention of some readers. In the near future we will be addressing CEA directly in hopes of improving this standard.
Unfortunately, the CEA standard does not presently take into account these orientation issues, and since the measurements we have received from Hsu Research have some discrepancies relative to ours, we reran the tests with the ports on the bottom as per the CEA standard as well as Hsu Researches current practices (I base this statement on the agreement between curves they submitted, and those we generated independently, not from personal knowledge). We were hopeful that any discrepancy between our findings and that of Hsu Research would become obvious by additional measurements.
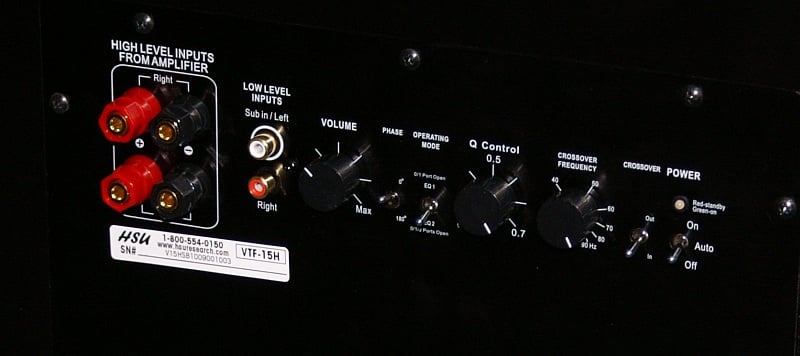
Before proceding we felt it necessary to point out that the HSU VTF-15H has two switch positions on the amplifier back panel called "EQ 1" and "EQ 2", respectively. EQ 1 essentially runs the sub fullrange while "EQ2" employs a 30Hz second order HPF filter for better mechanical protection of the subwoofer driver. HSU recommends running "EQ"2 with both ports open for maximum output while they recommend running the sub in EQ1 for 1 or both ports plugged for maximum extension mode. In this report, we test both positions and show their respective tradeoffs associated.
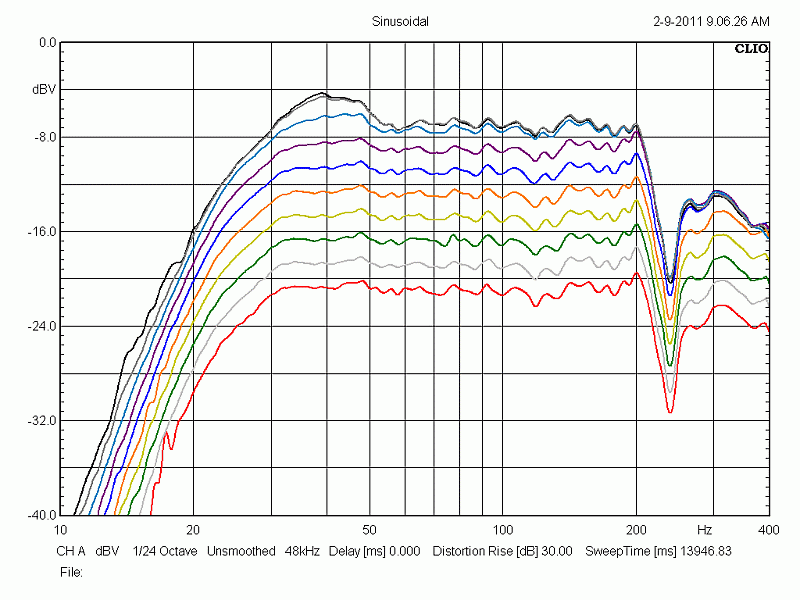
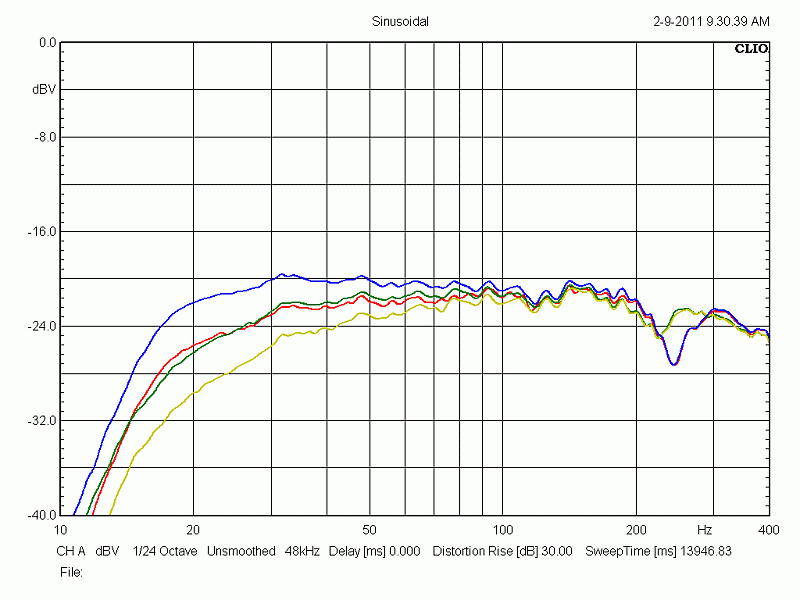
The first curve (below) was taken in November 2010. In comparison to the second curve, it shows some slight differences due to the side (horizontal) vs standing (vertical) orientation.
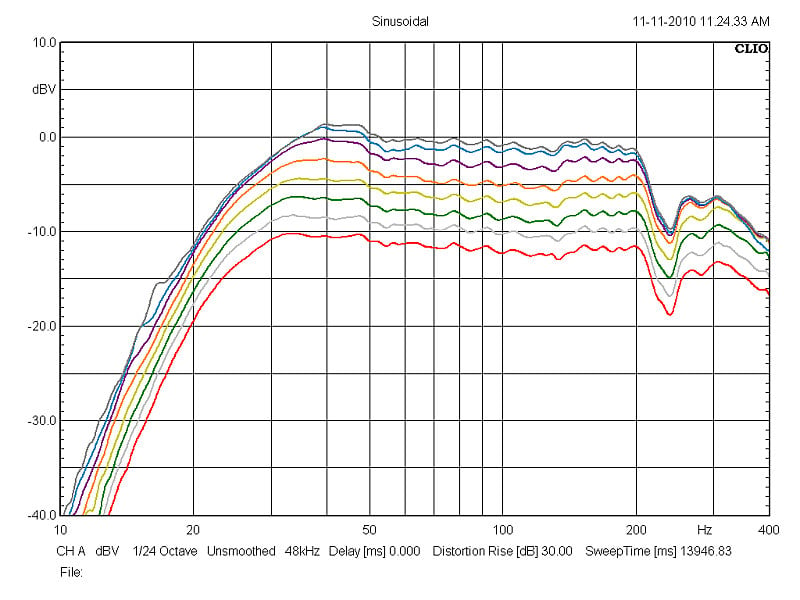
Original November Measurement Displayed with 40db dynamic range, EQ2
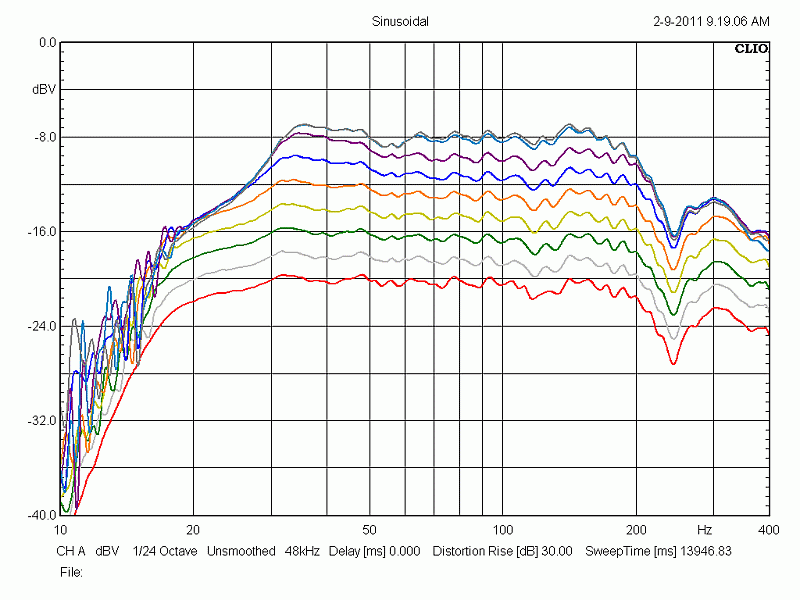
HSU Research's argument after our original review of the VTF-15H published was that due to their port shape and location, placing the sub on the side would put their product at a disadvantage so we decided to see what kind of merit there was in the argument, and expanded our testing at great expense of time and effort. In the retest, we placed their sub upright. The curve taken under the same conditions save for box orientation is shown below.
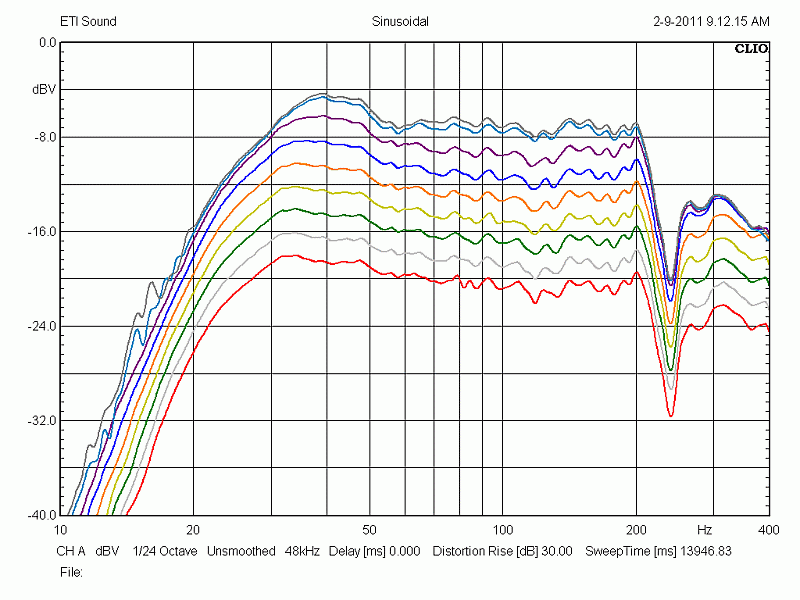
Same system, same location, same measurement equipment, Normal Box Orientation
(Meaning ports at the bottom nearer the mike than the woofer) & “Q” = 0.7 & EQ2
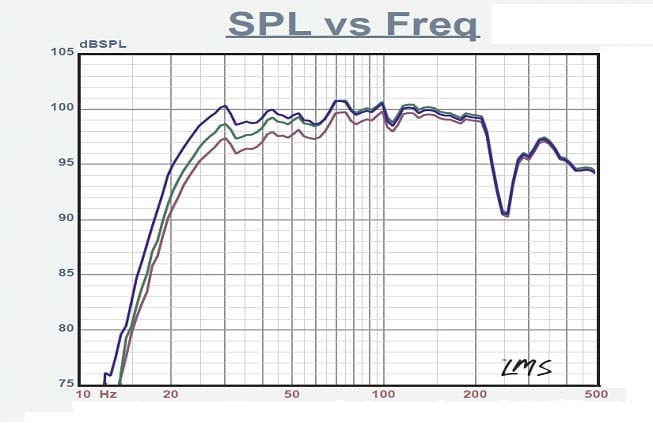
HSU supplied Graph of the VTF-15H showing the effects of rotating
the “Q” control knob on frequency response – Note 10db notch at 250 Hz
The more choppy appearance of the Hsu curve is likely a result of two things. First, the dynamic range shown is less, 35 not 40 db as the Clio curves are. Second, the number of points used to generate the curve is likely a small fraction of those gathered by Clio, which smooths the data to 1/24th octave precision, about 8 times what the human ear is capable of. The most salient feature we see in the second and third curve is the increase in the depth of the notch due to out of phase information from the speaker and port at about the 250 Hz mark. With the ports on the bottom closer to the microphone, (changing both the phase and amplitude relationship between the port and woofer) the depth of the notch at low level inputs, where the system is linear, has increased from about 6db (side orientation) to 10 db (normal box orientation).
What is curious of course, is the difference in the low end. While my measurements show it rising, in the Hsu Research measurements, it is not.
In both instances, the Q control was set to 0.7, (Implying the filter it controls is set to the “maximally flat” position) and the High Pass switch (which for some reason is labeled “operating mode”) was set to “EQ2” position, which I had supposed works best when both ports are open since these are the settings Dr. Hsu recommended I use for acquiring data during his November visit. (Later measurements will show this is the WRONG setting for both ports open). Still, all in all, this is pretty good agreement, especially with regard to the point at which the system rolls off. (Of all the entrants, Dr Hsu was the only one present for testing, and this is not surprising as he is located in our neighboring county and personally delivered the VTF-15H to my laboratory.)
HSU VTF-15H Subwoofer Review Supplemental Cont.
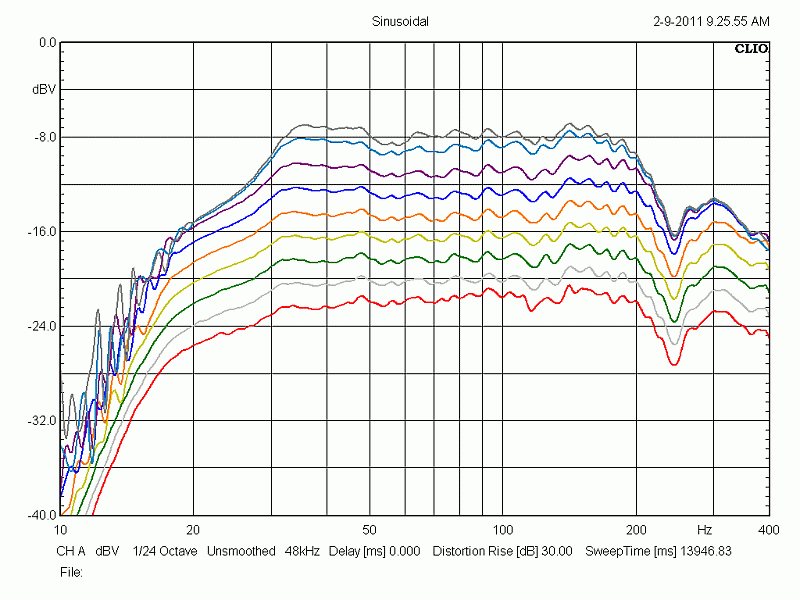
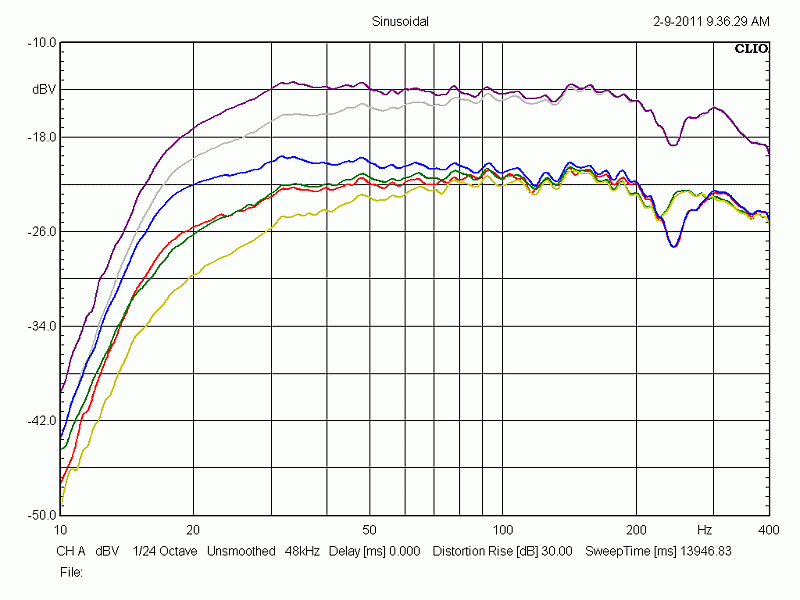
So far so good. As far as getting repeatable data, there does not seem to be any significant errors in my data. Now to repeat the measurement with the Q control set to the opposite end, 0.3. (Maximum damping). (See below)
Same as previous conditions (EQ2), except the “Q” control is set to “0.3” (Maximum damping)
Well, this curve is certainly flatter than the first one, and when driven at low levels (red curve) it again, does not roll off till about 30 Hz. At very high input levels, where the system is running out of power or excursion or both (Top gray curves) we can see a hump caused either by a lack of current available from the amp, or perhaps the loss of BL that occurs when the VC leaves the gap. Seems to me this system was designed expressly to allow for the higher roll-off of 30 Hz, perfectly suitable for music in 99% of the time, and with the Q control set to minimum, at the ground plane it looks perfectly flat!
Time to see what happens when the system is set to a lower tuning using the available triangular shaped port plug. Let's see....
One port Plugged, EQ1 position & Q Control = 0.7 (flat)
As is clear from the red curve, the system is now in an extended mode. What is also clear is that the maximum output relative to the both port open modes has been compromised between 20 and 30 Hz. The reality is, there is far more music from 30 to 40 than there is from 20 to 30 Hz, and it is a heck of a lot easier to reproduce at high SPL's. To make matters worse of course, we see all this choppy response going on below 20 Hz? Is it ambient or background noise? No. How can I tell? If it were ambient/background noise, it would be worst at the red curve, and least objectionable at the top gray curve, because the more output the sub makes, the less influence ambient/background noise will have on our measurement. What was happening (and I could clearly hear this, as I was sitting outside with a clear path between the measurement rack, and the sub) was there were loud mechanical noises being produced by the subwoofer in trying to reproduce very high levels of signal below 20 Hz. (Notice with the lowest drive voltage, the red curve is free from this effect.) There is another reason why this is happening. With the EQ set to position 1, the roll-off of the subsonic filter is changed to allow much more LF output to reach the speaker terminals. It appears that one set of controls is for making great curves for sales, while the other set is a more realistic setting and cutoff to allow this product to produce more than adequate low end, (30 Hz cutoff) for the vast majority of music. Because plugging the second port reduces the cutoff frequency while increasing the damping of the system, using the "Q" control allows you to make the system response flat by raising the filter "Q" setting to 0.7. This might also explain Dr Hsu's preference for me to use EQ2, with the higher order high pass filter in circuit, so as not to reveal a driver bottoming issue.
What does the system look like with the same 1 port plugged and EQ 1, but the Q set to 0.3 (Maximum damping)? Lets see....
Same Settings as Above (EQ1) test except for the Q control set to Maximum Damping (0.3)
As we can see with the higher damping used, there is less stress on the system below 20 Hz, so those 16Hz pipes, are less likely to cause the woofer to go into distress, but even with the very limited steady state power available from the BASH amplifier, (350 Watts) it was more than enough to cause the woofer to overload when driven below 20 and above 10 Hz. Essentially, although we can force this woofer to have a flatter curve to a lower frequency, we simply can't make it move more air than it is capable of. In other words, the maximum output at very low frequencies is displacement related as well as power related. At maximum power, this woofer, even with the one port plugged STILL ROLLS OFF AT 30-35 Hz due to output limitations.
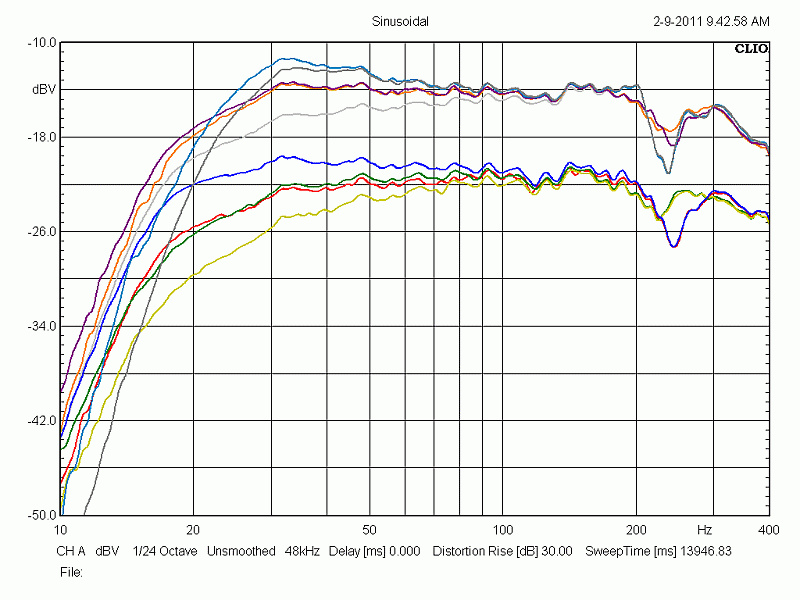
As we previously saw from the HSU supplied graph varying Q for the VTF-15H the range of control of the “Q” switch goes all the way from the minimum usable frequencies up to 200 Hz. My measurement (below) agrees, and shows the effect of the Q control from minimum damping (red) to maximum damping (blue).
Range of available control from the “Q” knob, 0.7 (blue) to 0.3 (Red) with 1 Port Blocked, EQ1
If we are to calculate the value of the frequency at a given “Q” the formula is simple, although not well known. Response in dB = 20 Log Q. So, for 0.7 at the cutoff frequency (Fc) response is -3.1 db. For Q = 0.3 the response is -10.5 db. One would suspect then, the resultant difference to be about 7 db. Best as I can tell, the difference is only about 4 db. (Total dynamic range of this curve is 20 db, and each small tick mark represents 0.8 db.) Perhaps Hsu Research can shed some light on the choice of markings used on this amplifier.
HSU VTF-15H Subwoofer Review Supplemental Cont2.
OK, well, what about plugging both ports? Is there an advantage to be had there? Well, it seems in the audiophile community, this debate has been going on since I was born (1957) and still rages on today. Perhaps this is as simple as different folks are sensitive to different things, but despite the vast majority of products released for consumption in the past 25 years being vented not sealed, it seems that sealed still has a lot of fans. Let's take a look....
Blue and Red (1 port sealed & Q control varied from 0.7 to 0.3)
Green and Yellow (Both ports sealed & Q control varied from 0.7 to 0.3)
It seems the only advantage we have from this approach is the anti-phase from the ports is almost entirely gone (suggesting some small amount of air still leaking through the ports). Below 100 Hz, however, the lack of porting has caused this low Q driver to have a droopy response which cannot be completely corrected by the Q control of the amplifier.
Well then, what about the difference between side mounting measurements and normal (port on the bottom) orientation measurements? Surely putting the sub on the side might introduce a difference which is more visible with one port plugged than both ports open. After all, the system rolls off higher with the EQ switch set to position “2”, recommended for the both ports open mode. What if we turn the sub back down on its side and look between 20 and 30 Hz? See below....
Blue Curve becomes the top (purple) curve & Red curve becomes
the Gray curve when the sub is turned back onto its side
(Level adjustment for clarity of viewing only)
Well, it sure does look like putting the microphone closer to the ports heightens their contribution relative to the woofer, now farther away based on the quicker roll-off we see in the top two curves compared to the normal orientation blue and red curves. Maybe that top port is contributing nothing at all to the output as has been suggested. Well, lets do a comparison then. Let's take the plug out of the top port (purple curve) and put it in the bottom port. Then, we will remove both plugs, and look at the output with the EQ switch in both position 1 and 2. Lets see below.....
A Whole bunch of stuff, all explained in the paragraph below. Read on.
What we can tell about the port contribution difference is seen by comparing the orange to the purple curve above. The orange curve is the ground plane measurement with the bottom port plugged, and the purple curve is the ground plane measurement with the top port plugged. (Remember the box is on its side for both of these measurements, meaning the port is closer to the mike in the purple curve because the orange curve shows the output of the system on the ground with the top port, which is off the ground open, and the bottom port on the ground, nearer the microphone.) The actual difference appears to be about 0.8db at 20 Hz, and less above that frequency.
As you can tell from BOTH the notch depth at 250 Hz, as well as the bump near 30 Hz, the top two curves are made from the same drive voltage (see them overlay each other in the 100 to 200 Hz range) these curves were taken with BOTH ports open. The difference between the top most curve (lets call this color Aqua) and the gray one just below it, is the quicker roll-off provided by the positioning of the “operating mode” switch at EQ2 (0/1/2 ports open). The aqua curve was taken with the operating mode switch in postion EQ1, while the gray curve is taken with the switch in position EQ2. My use of this switch in position EQ2, based on the silkscreen on the amplifier panel suggesting that was the appropriate EQ for both ports open seemed then and now to be a logical choice. I would suggest that this “operating mode” switch position is as much a determinant in the final curve as is the port configuration or the “Q” control.
It is important to remember when viewing these curves, that this is representative of the subwoofer performance in the long term, and not with a very short duration pulse. The Clio sweep used is 14 seconds in duration, and is a log sweep from 400 Hz to 10 Hz. That means by the time the amp is at 100 Hz, the maximum output is stabilized, and the amp has reached its limitation. If Hsu is claiming the amplifier is capable of 350 watts continuous, but 1400 peak, we are wondering a few different things. First of all, how long is that 1400 watt peak, when the maximum power consumption of the amplifier is 430 watts (the fuse blows when pulling more than 600 watts, so presumably the amp might blow before the fuse does). Also, if the speaker is already running out of excursion just below 40 Hz (as evidenced by the bump suggesting the BL of the speaker is dropping from the voice coil leaving the gap), why would you want to put 1400 watts into this speaker? I would think at that point, it would have already bottomed, and possibly beat itself to death based on the mechanical noises it made below 20 Hz. Of course, I have only been designing powered subs for 23 years now. I certainly don't know everything. Maybe there is marketing value in the 1400 watt claim. Not being a marketing expert, I will leave that to the readers to decide.
HSU VTF-15H CEA Test Results
The original Audioholics 2010 Subwoofer Shootout Measurements procedure differ slightly from the CEA 2010 standard, because as we have explained here, in order to get a more even contribution at the relatively close microphone distance of 1 meter from the ports (typically located on the bottom of the cabinet), and the woofer (usually above the ports), it is best to place the microphone at a distance equal from all acoustic radiators (woofers, ports and passives all). To accomplish this, we laid the cabinet on its side to acquire measurement data when the ports and cabinet are both mounted on the front baffle of the system. We also place the mike, not with respect to the geometric center of the cabinet, but with respect to the acoustic center of the cabinet, which we estimate as halfway between vertical lines running through the ports and driver. These procedures are to produce the most accurate results, with the smallest possible errors due to differences in distance from the microphone location to the radiating elements (port(s) and speaker(s). This method was not only applied to the Hsu system measured, but ALL THE SYSTEMS with front mounted driver and ports. CEA 2010 also includes agreed upon methods for measuring systems with the driver and vent (or passive) mounted on the side surfaces, and we have pointed out to CEA (unofficially) these agreed upon configurations puts those type of systems (for example side firing systems) at a disadvantage when measuring maximum SPL by placing the acoustic centers of the radiators (speakers and ports or passive radiators) FARTHER away from the specified location of the ground plane microphone relative to front mounted systems. Placing the microphone farther away from the acoustic center would give those systems with front mounted elements an advantage in the test for scoring the highest SPL numbers. Because most listener are considerably farther from the system than the 1 Meter distance used for measurement, this is a measurable difference not likely to be heard in a real listening environment. Again, this point covered in graphic detail here.
After spending an hour listening to a salesman pitch his factory where I was conducting the subwoofer tests (always a joy to be sure) I went back outside and discovered the Hsu subwoofer was still in one piece not having been run over by a truck. (This was truly my lucky day).
Seeing said trucks go rolling over where my $600 microphone was laying some 30 seconds after removing it, I have made a habit of taking it out of the sun, and way over to the edge of the building where the equipment rack is located so it does not heat up in the sun.
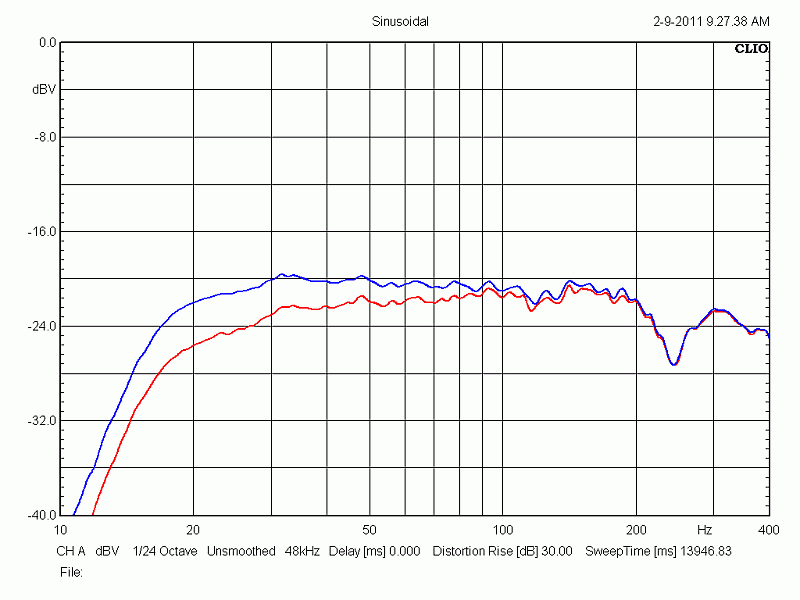
That said, the Hsu subwoofer was now in the beautiful southern California midday weather, and the ambient temperature had increased by perhaps 10 degrees F, while the humidity dropped substantially. My first order of business was to take another curve without having made any changes at all to the equipment settings. I returned the mike to its rightful place 39.37 inches directly in front of the cabinet (grille was off, so the measure was taken to plane of the baffle board, not the grille, and laid the microphone down on the ground. Below is the resultant curve...
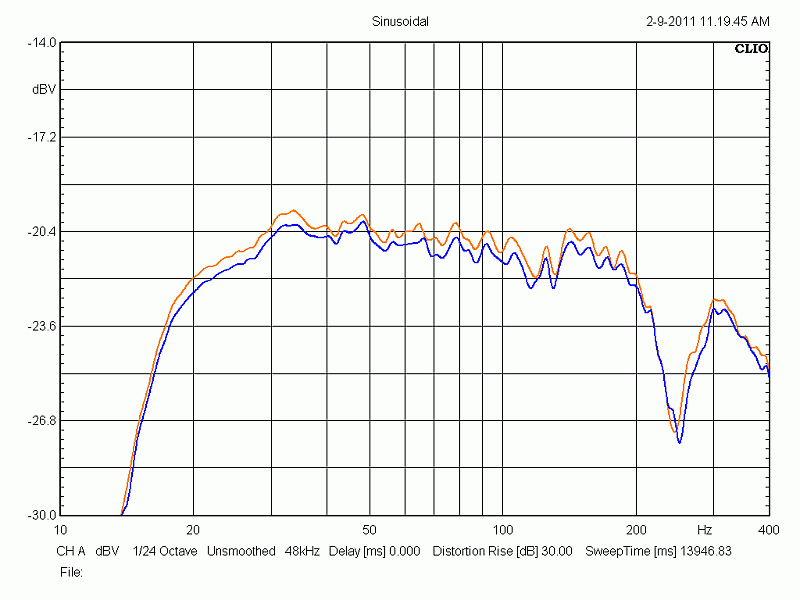
Same Drive voltage into the amplifier – 1 hour later, weather changed amp was warmer
Orange curve at around 10 AM - Blue Curve around 11 AM
Clearly the change in the temperature of the weather and the amplifier had caused a shift in the gain of the amplifier. This does not appear to be speaker related at all, or the difference between the curves would not be frequency independent.
My next step was to repeat the CEA testing, but this time with the CEA standard orientation, vertical orientation (ports on the bottom). The program allows one to gather the data one sample at a time, or once one has discovered the “maximum” drive you can employ before failing the test, to run the signal several times and gather an average. Since it appeared that in some cases, a drive voltage resulting in a failure of the speaker with a single pulse, actually passed the test when an average of 8 pulses were used, both methods were employed to make every effort to find agreement with the higher SPL numbers Hsu Research was claiming. For sake of reference, below is the table from the original data presented.
| Hsu Research VTF-15H | CEA Test Performance |
| Frequency | Maximum Peak SPL @ 1 Meter |
| 20 Hz | 109.9 dB |
| 25 Hz | 115.8 dB |
| 32 Hz | 119.0 dB |
| 40 Hz | 121.7 dB |
| 50 Hz | 121.7 dB |
| 63 Hz | 121.6 dB |
Max SPL Output Data of the Hsu Research VTF-15H Subwoofer
Data taken November 11th, 2010
box orientation: horizontal
It is worth noting again, the data above was taken with the cabinet on its side, and both ports open. As per Dr. Hsu's instructions, the Q was set to 0.7 and the EQ was set to position 2, which raises the frequency of the subsonic filter and boosts the gain and available output in the 30 Hz region at the expense of a very small amount of bass in the 20 Hz region. Below are for completeness the distortion curves for the above data as originally shown in the first Hsu VTF-15H review.
Hsu Research VTF-15H CEA-2010 Distortion Test Results
The retest data below was taken with the cabinet upright, and one port blocked. The Q control was still set to 0.7, and the EQ was set to position 1, recommended for 1 port blocked. In this orientation, the microphone is closer to the ports, and further away from the woofer. The amplifier is also now warm, and has been on (without playing) for about 1.5 hours prior to re-testing.
| Hsu Research VTF-15H | CEA Test Performance | Change in Performance re: 11-11-10 Data |
| Frequency | Maximum Peak SPL @ 1 Meter | |
| 20 Hz | 111.1 dB | + 1.2 dB |
| 25 Hz | 113.8 dB | - 2.0 dB |
| 32 Hz | 117.6 dB | - 1.4 dB |
| 40 Hz | 119.4 dB | - 2.3 dB |
| 50 Hz | 119.5 dB | - 2.2 dB |
| 63 Hz | 119.7 dB | - 1.9 dB |
First retest of Hsu VTF-15H February 9th, 2011 (1) Pulse Maximum
Box orientation: vertical
Below is the concurrent distortion data, collected as before, except for cabinet orientation.
Distortion data for first retest of Hsu VTF-15H February 9th, 2011
(1) Pulse Maximum - Box orientation: vertical
So far the theory that putting the mike closer to the ports, lowering the tuning, and taking the extension over the maximum output seems to be coming at a pretty high price. How much of this is due to the amplifier loses power with an increase in temperature versus a change in the weather is not possible for me to say without further additional testing under a multitude of conditions. Below are the results with the same test conditions save for the program being set to run (8) pulses (1) second apart so as to improve the signal to noise ratio of the measurement.
| Hsu Research VTF-15H | CEA Test Performance | Change in Performance re: 11-11-10 Data |
| Frequency | Maximum Peak SPL @ 1 Meter | |
| 20 Hz | 111.1 dB | + 1.2 dB |
| 25 Hz | 113.6 dB | - 2.2 dB |
| 32 Hz | 117.5 dB | - 1.5 dB |
| 40 Hz | 119.4 dB | - 2.3 dB |
| 50 Hz | 119.4 dB | - 2.3 dB |
| 63 Hz | 119.6 dB | - 1.3 dB |
Second retest of Hsu VTF-15H February 9th, 2011 (8) Pulses averaged
Box orientation: vertical
Distortion data for second retest of Hsu VTF-15H February 9th, 2011
(8) Pulses averaged - Box orientation: vertical
The final test phase was done after mike re-calibration, and seems to improve the output by approximately 0.5 to 0.6 db regardless of frequency relative to the second test, done with the prior calibration.
| Hsu Research VTF-15H | CEA Test Performance | Change in Performance re: 11-11-10 Data |
| Frequency | Maximum Peak SPL @ 1 Meter | |
| 20 Hz | 111.6 dB | + 1.7 dB |
| 25 Hz | 114.4 dB | - 1.4 dB |
| 32 Hz | 118.0 dB | - 1.0 dB |
| 40 Hz | 120.0 dB | - 1.7 dB |
| 50 Hz | 120.0 dB | - 1.7 dB |
| 63 Hz | 120.3 dB | - 2.0 dB |
Third retest of Hsu VTF-15H February 9th, 2011 – mike re-calibrated & (8) Pulses averaged
Box orientation: vertical
Distortion data for third retest of Hsu VTF-15H February 9th, 2011
mike re-calibrated & (8) Pulses averaged - Box orientation: vertical
Despite the small improvement seen at 20 Hz, as expected, the cost was in sensitivity at all the higher frequencies. There is nothing new or noteworthy here. This is basic loudspeaker physics 101. That the data is different, and also less than it was in the original test comes as no surprise to this author. That the test results are only repeatable within about 1 db is completely in keeping with my experience using the CEA test program. The consistency of this data is very good, and all the numbers agree with what is to be expected from systems of this size and power.
HSU VTF-15H Subwoofer Review Supplemental Conclusion
 What became clear during the second round of testing is that despite the modest amount of power available from the BASH amplifier, the HSU subwoofer is not up to the task of handling low frequencies below 20 Hz, many of which are present in recordings despite it being a really bad idea. Using the subwoofer in the extended mode is creating the risk of having this speaker self destruct if the operating mode switch is left in position EQ1 and the sub is driven at very high output levels. Anyone with access to a simple function generator and BNC to RCA adaptor can discover this in a few minutes time. Hsu Research, as well as all subwoofer manufacturers, is well aware of the value of a flat curve going down to 20 Hz in the market. What is not well known is that unless you are capable of sufficient dynamic range at that frequency, having the extension will come at the loss of dynamic range (as our measurements bear out) and/or an increase in distortion.
If the end user is looking for a well designed sub which is capable of playing down to 20 Hz, the Hsu will do so, but with very limited output and in my opinion as a designer of powered subwoofers for more than 23 years, this is not the best use of this system. In our opinion, the best use of this subwoofer is with the Q control set to 0.3, both ports open, the EQ control (also called “operating mode”) set to “EQ2” ONLY. As we stated in our first review, this subwoofer has output limitations below 30 Hz at high SPL. For that purpose, there are better alternatives than the Hsu Research VTF-15H, but at a higher price.
If your primary intent is listening with music, then a 30 Hz cutoff will be, as I have said before, more than adequate 99% of the time.
HSU Research's argument after our original review published was that due to their port shape and location, placing the sub on the side (horizontal orientation) would put their products low frequency output at a disadvantage. We therefore decided to see what kind of merit was in this argument, and expanded our testing at great expense of time and effort. Since the whole cabinet is only 18 inches wide, with the port centers only about 13 inches apart, if the port frequency is 22 Hz (a wavelength of 51.2 feet in length), this would represent only about 1.27 degrees of phase shift between the two ports at the microphone location. Since we are so close to the cabinet, calculating the difference in SPL from these close distances is a bit tricky, (this close to the box, inverse square law will not apply) . If the mike is at the center of the cabinet, and the acoustic center of the port is about 3 inches behind the front of the cabinet, then the distance from the mike to the first port's acoustic center is about 44 inches. (Remember, the port has depth, reaching into the cabinet). The distance to the second port would be around 52 – 53 inches away, or a difference of 8 to 9 inches. According to the CEA standard if that second port were a reflecting surface, it would have to be about 422 inches away so as not to interfere with the direct sound from the sub for a 22 Hz signal. A fair assumption given the placement of the ports, is that either should have the same output when measured from the same distance. The port above the ground is another sound source around 8.5 inches away, almost perfectly in phase with the other port, yet we are being asked by Hsu Research to believe its contribution is negligible! The very small difference shown in the orange and purple curves relative to the difference between the blue and green or red and yellow curves (showing a single port vs both blocked) makes the assertion that the port off the ground does not substantially contribute to the sound, is, to be kind, less than plausible. It is in no way supported by any of my measurements.
Now regardless of the math or science involved, there will be those who feel that we are being unfair. Let me reiterate the facts surrounding these events. Several entrants came into the shootout. Some of them did poorly. One threatened a lawsuit, then went away. Two realized the products were not competitive, and went away. ALL the entrants were given the courtesy of a review of the data prior to its publication. What happened next was a less than complete set of facts was placed before the court of public opinion by Hsu Research in an effort to avoid any grade less than A+. It is almost ironic as we had already declared the Hsu subwoofer to be the best value of the entire batch. Yet, no criticism would be accepted as that might result in a loss of income, no matter how small.
This is why it is so very difficult to go online and find honest and complete reviews that are not pure pablum. Entrants will threaten to withhold ad dollars, making business difficult or impossible for the honest reviewers who give criticism as well as praise in an effort to be fair to both the reader and the reviewed. I contend as a contributing writer that Audioholics is doing a fantastic job of trying to be fair and even handed. Our data and reviews are peer reviewed by folks of exceptional ability and we present this data with both great pride and confidence.
It is our hope companies don't take our criticism of their products we review as a threat, and take a stance that anyone having anything critical to say about their products is either incompetent or dishonest. We are neither. If we have to take a bullet every once in a while to keep our integrity, we will do it for the love of music, and what we do. We respect our readers as well as our entrants who submit their products for review, and do not want to level any criticism unfairly. We are hopeful this article will be helpful in convincing our readers that was our goal, and that we have achieved it fairly. Our opinion of this product remains unchanged and if used within its design limitations, the VTF-15H offers the best bang for the buck in affordable subwoofers that we have tested to date.