
Elemental Designs eQ.2 Parametric Equalizer Review
- Product Name: Elemental Designs eQ.2 Parametric Equalizer
- Manufacturer: Elemental Designs
- Performance Rating:

- Value Rating:
- Review Date: July 22, 2009 23:21
- MSRP: $ 85 w/ A7S $100 w/o A7S
EQ Type: Two band parametric
Frequency Bands: Continuous variable 10Hz - 50Hz, 50Hz - 100Hz
Band Width (Q): 0.3 - 3.0 Octaves
Level Adjustment: -15dB/+15dB
Subsonic Filter: Continuous variable 5Hz – 30Hz at 12 dB/octave w/ bypass
Phase Adjustment: Continuous variable 0 - 180 degrees
Dimensions: (HxWxD): 2.25" x 9.00" x 5.063"
Pros
- Inexpensive parametric equalization
- Does the job it is intended to do
Cons
- Manual tuning and measurement not for novices
- Limited precision due to physically small knobs
Introduction
 The last several
years have seen an increase of the number of options for room equalization at
bass frequencies available to consumers.
Options vary widely in type, functionality, ease of use, and cost. From single band parametric analog
equalization to full range digital room correction (DRC), separate units to
those built into subwoofers and receivers, fully manual to fully automated, and
relatively inexpensive to not so inexpensive.
The last several
years have seen an increase of the number of options for room equalization at
bass frequencies available to consumers.
Options vary widely in type, functionality, ease of use, and cost. From single band parametric analog
equalization to full range digital room correction (DRC), separate units to
those built into subwoofers and receivers, fully manual to fully automated, and
relatively inexpensive to not so inexpensive.
However one goes about it, the intention of equalization is to flatten out frequency response problems brought about by room acoustics, preferably without causing other problems. Fixed band graphic equalizers, popular several decades ago, have since fallen out of vogue and were never very popular with audiophiles who disliked the phase problems inherent in mid and high frequency analog equalization. Modern DRC methods avoid the phase coherency problems with digital manipulation, but good old analog equalization still has a place at the bottom of the frequency spectrum where imaging will not get screwed to fix frequency problems.
Following up on my A7S-450 review, I was asked to review an external parametric equalizer that Elemental Designs (eD, which again, I disown the acronym but will use it for the sake of brevity) sells alongside its subwoofers. The unit, the eQ.2, can be purchased separately or as a bundle with one of eD’s subwoofers at a slightly reduced price. At a price of no more than $100, the eQ.2 can provide two bands of bass equalization for a budget. Now let’s see what that means to the potential consumer.
Design and Construction
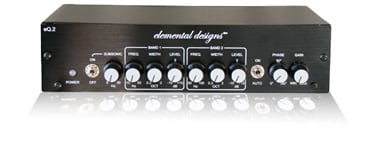
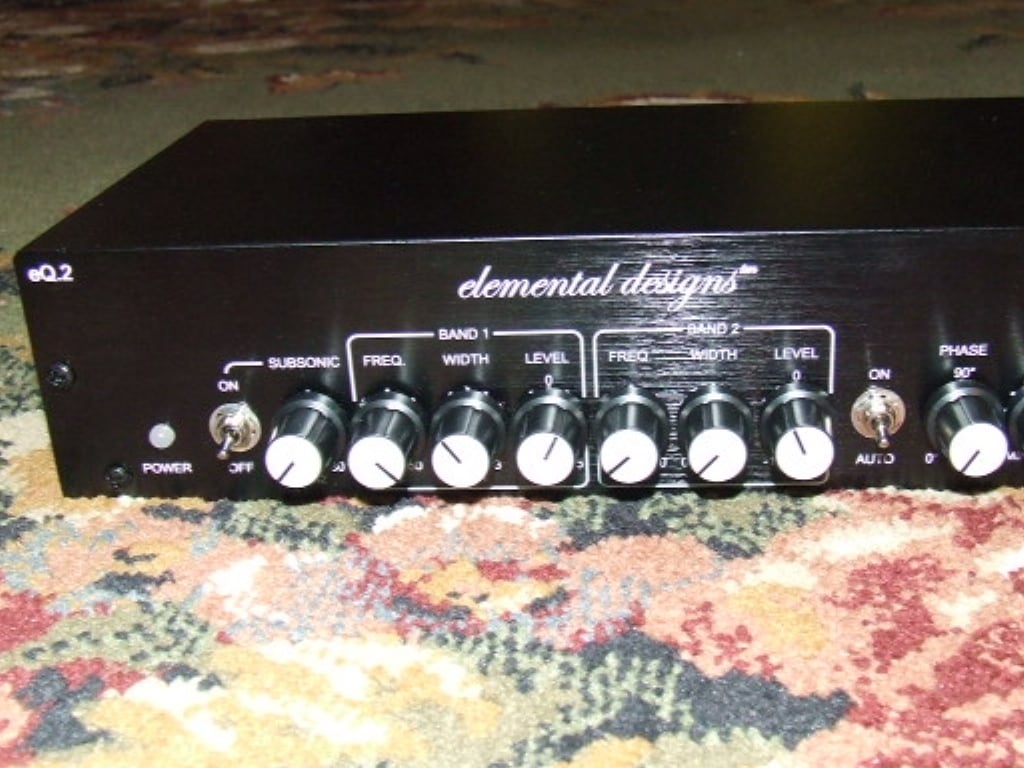
The eQ.2 is a small standalone equalization unit that at approximately 2 ¼” x 9” x 5” is not standard rack width, meaning it will have to sit atop the stack on its little rubber feet, that is unless one owns an even smaller piece. Available only in black, the unit is basic in appearance with a housing that is constructed of light gage steel and is relatively solid for this price range.
The front face of the eQ.2 is predictable adorned with controls. From left to right we have the power indicator LED, a subsonic filter toggle switch with a high pass frequency knob, band one and band two equalizer controls at three knobs apiece, an auto/on toggle switch, a knob for setting phase, and a knob for setting gain.
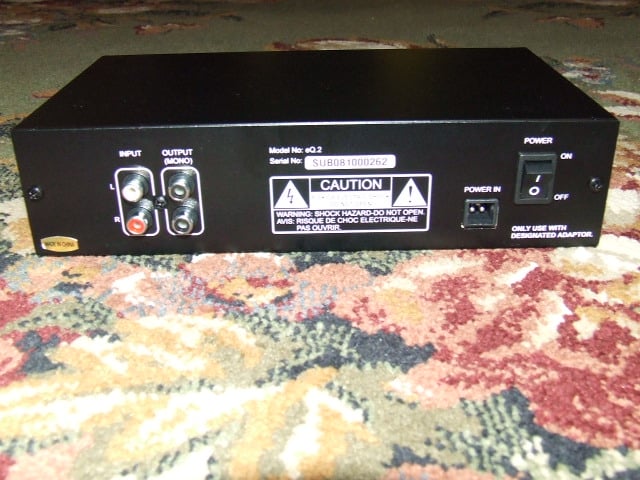 I/O is at the rear of the eQ.2 and features an RCA-type two channel stereo in and an RCA-type two channel monaural out connections. Two go in but only one comes out which allows
for combinations of one or two subwoofers in a stereo rig or dual subwoofers in
a multi-channel rig and with
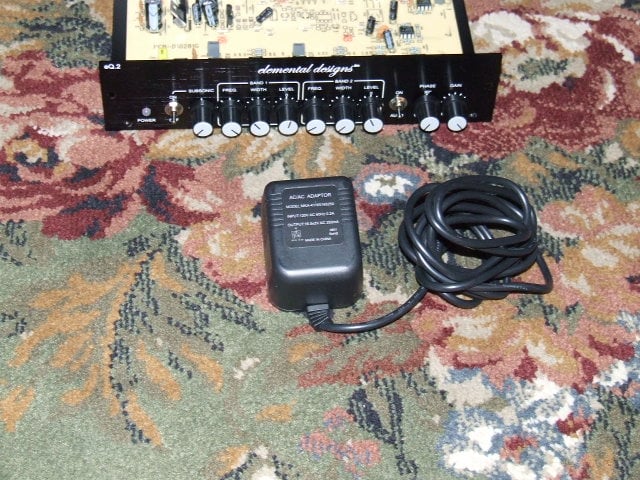
LFE. Power is controlled with a rocker
switch and power input is provided by a three lead detachable power chord from
a corded external AC/AC transformer, i.e. a wall wart. Note, I said AC/AC converter; 0.2A at 120 VAC,
60 Hz goes in and 0.25A x 2 at 16.5VAC, 60 Hz comes out.
I/O is at the rear of the eQ.2 and features an RCA-type two channel stereo in and an RCA-type two channel monaural out connections. Two go in but only one comes out which allows
for combinations of one or two subwoofers in a stereo rig or dual subwoofers in
a multi-channel rig and with
LFE. Power is controlled with a rocker
switch and power input is provided by a three lead detachable power chord from
a corded external AC/AC transformer, i.e. a wall wart. Note, I said AC/AC converter; 0.2A at 120 VAC,
60 Hz goes in and 0.25A x 2 at 16.5VAC, 60 Hz comes out.
 As for the
control functionality ranges, the subsonic filter is adjustable from 5 Hz to 30
Hz with a slope of 12 dB/octave, and if used, the setting depends on the
frequency extension characteristics of the subwoofer with which the eQ.2 it is
mated. It is intended to cut off
frequencies that are significantly below the subs roll off point that the sub
may still try to reproduce but which can add distortion from staining too
far. Phase on the eQ.2 is adjustable
from 0 to 180 degrees and should be set in conjunction with the phase settings
on the accompanying subwoofer. Really,
only one or the other should be used, but the eQ.2 may be the preferable place
to set the phase if the sub only has a 0/180 toggle, in which case, set the sub
to zero and make the fine-tuned adjustments at the eQ.2. Gain is adjustable from min to max, which is
a bit vague without knowing the gain structure the eQ.2 can develop.
As for the
control functionality ranges, the subsonic filter is adjustable from 5 Hz to 30
Hz with a slope of 12 dB/octave, and if used, the setting depends on the
frequency extension characteristics of the subwoofer with which the eQ.2 it is
mated. It is intended to cut off
frequencies that are significantly below the subs roll off point that the sub
may still try to reproduce but which can add distortion from staining too
far. Phase on the eQ.2 is adjustable
from 0 to 180 degrees and should be set in conjunction with the phase settings
on the accompanying subwoofer. Really,
only one or the other should be used, but the eQ.2 may be the preferable place
to set the phase if the sub only has a 0/180 toggle, in which case, set the sub
to zero and make the fine-tuned adjustments at the eQ.2. Gain is adjustable from min to max, which is
a bit vague without knowing the gain structure the eQ.2 can develop.
The three knobs for each band are for frequency, width/Q, and level with continuously variable settings for each. EQ band one has an adjustable center frequency range from 10 Hz to 50 Hz while band two ranges is from 50 Hz to 100 Hz. Both bands have band width adjustable from 0.3 octaves to 3.0 octaves and level settings of +/–15 dB.
 The practical
equalizer level range is –15 dB to 0 dB to cut room peaks. Because of the nature of room acoustics and
the standing waves that a device like the eQ.2 is intended to correct, positive
gain at a bass frequency dip is a sinkhole for power so there really is no need
for the 0 dB to +15 dB level range. The
standing waves that cause the dips do so by canceling each other out and no
amount of power to increase numbers of the same magnitude with opposite sign will
stop the result from equaling zero. I
suppose one could appropriate either of the bands to function as an ad hoc bass
control at a frequency away from negative nodes, but that seems contrary to the
purpose of this type of device, and as such, is not recommended.
The practical
equalizer level range is –15 dB to 0 dB to cut room peaks. Because of the nature of room acoustics and
the standing waves that a device like the eQ.2 is intended to correct, positive
gain at a bass frequency dip is a sinkhole for power so there really is no need
for the 0 dB to +15 dB level range. The
standing waves that cause the dips do so by canceling each other out and no
amount of power to increase numbers of the same magnitude with opposite sign will
stop the result from equaling zero. I
suppose one could appropriate either of the bands to function as an ad hoc bass
control at a frequency away from negative nodes, but that seems contrary to the
purpose of this type of device, and as such, is not recommended.
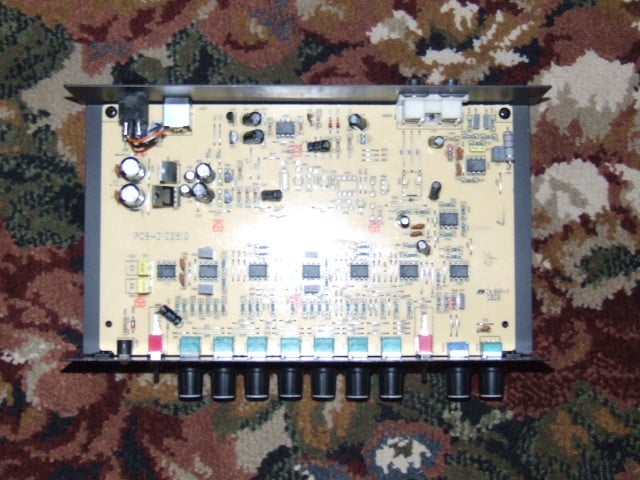
Two screws, front and back each, hold the single piece top/sides on to the eQ.2. The internals of the unit, once the cover is off, reveal a simple and orderly circuit board bolted to the metal base of the chassis. Capacitors buffer power input and signal connections and a row of IC chips follow the knobs and switches across the front of the eQ.2.
System Setup and Testing
Physical setup of the eD eQ.2 is the easy part. Find a suitable location for the units and reroute the direct preamplifier/receiver subwoofer outputs to the eQ.2 inputs. With an additional cable per subwoofer, route the eQ.2 outputs to the subwoofers. That’s simple enough.
The first steps after wiring the eQ.2 into the system is to turn it on and calibrate it to set the phase and gain on the device. Run a full range signal through your system to set the phase that produces the maximum bass output with the mains. Next run the pre/pro/receiver calibration test signals to match the gain with the eQ.2 in line with the subs relative to the rest of the system. These steps are best done with a SPL meter, but can be done by ear if one so desires.
To actually make use of the device in any meaningful way will require some additional hardware and/or software. There are three ways this can be done:
- With proper equipment such as a Realtime Analyzer (RTA)
- With an SPL meter and some graph paper
- By ear/guessing
The most effective way will require either a hardware based real time analyzer (RTA), which is expensive, or a computer loaded with a software based RTA and a microphone; very likely less expensive than the hardware RTA assuming a computer is available.
Editorial Note about TrueRTA and Sample Champion RTA Analyzers
There are a number of reasonably priced software packages available for purchase and two programs that I am familiar with are TrueRTA and Sample Champion. TrueRTA is the simpler and cheaper of the two, providing the functionality of hardware RTA without the cost. Sample Champion is a Maximum Length Sequence (MLS) program, similar to the professional MLSSA program. The same results are achievable, but the user has to be familiar with some of the more technical aspects of digital audio measurement, including selecting bit rates, sampling ranges, and data windowing methods, but the more advanced user will also find more functionality available than with TrueRTA. The TrueRTA web site make recommendations for inexpensive test microphones and microphone preamplifiers that can be purchased at many music stores while the Sample Champion site provides equipment sale with bundle discounts when purchased with the software.
A bit more labor intensive and less precise involves an SPL meter, a test signal source such as an audio test CD, and single axis logarithmic graph paper. To utilize this method, set the system to a reasonable volume level on a full band signal, perhaps 80 to 90 dB for a good signal to ambient noise ratio, run through the test signal sweep, and plot SPL for each frequency. The limiting factor is the number of test frequencies available and likely will only show the most egregious problems, with the required interpolation obscuring anything going on in between. For those familiar with the Infinity RABOS system available on some of their subwoofers, the procedure should be familiar, minus the cool plastic setting calibration gage.
Last and definitely least, setting the device by ear, an option that may provide satisfactory results if the room acoustics problems are very obvious and one is a well trained listener, but not likely. What is more likely is that one will tune for bass preference, not accuracy, and can only be considered even remotely accurate and practical for those with perfect pitch.
Now, to actually set the eQ.2 equalizers bands, I obviously chose the first method, having both the programs and the gear available, but no matter how you take measurements, the next steps are the same. Select a suitable location to take measurements, most likely the primary listening location, and set the microphone at ear level at this location. For testing I turned the subsonic filter off, set the phase to 0 degrees, and adjusted the gain to the median setting of zero.
Take an initial measurement without the eQ.2 operational to generate a baseline for determining the best settings. The eQ.2 provides two bands of equalization, one above, one below 50 Hz, so identifying the biggest SPL peak in each frequency range is the basis of setting the device, and this is where the measurements come in.
Measurements
Using Sample Champion, measurements were taken at 16 bit resolution with a 48 kHz sampling frequency. Fast Fourier Transformations were performed at 64K resulting in an effective frequency resolution of 0.73 Hz, which is more refined than even 1/24th octave resolution at the lowest octave; the A0 key on the piano has a fundamental frequency of 27.5 Hz.
All measurements were taken at the primary listening position at approximate ear level and referenced to a simultaneous, independent SPL measurement taken at 1 meter from the subwoofer. For these measurements, the eQ.2 was coupled with the eD A7S-450 subwoofer with the subwoofer’s low pass filter and the 25Hz bass boost defeated.
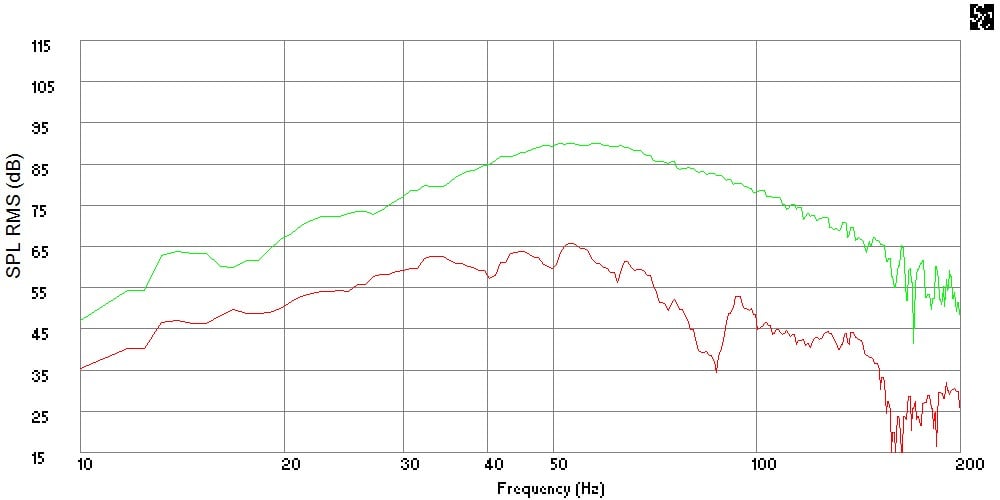
Figure 1: Nearfield vs. In Room Frequency Response, without EQ
Figure 1 shows the nearfield frequency response of the A7S-450 subwoofer measured nearfield at an SPL of 90 dB at 1 meter (green curve) compared to an unequalized in room measurement (red curve) that is then used as the baseline for setting the eQ.2.
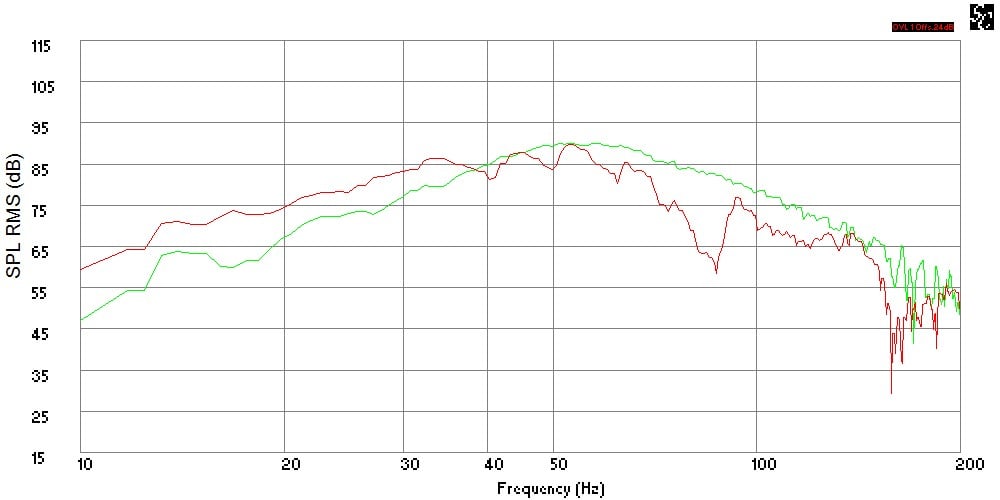
Figure 2: Nearfield vs. In Room Frequency Response, Level Matched, without EQ
Figure 2 is the same plot as the previous figure with the in room response adjusted to the peak of the nearfield curve to illustrate differences. Note the somewhat flattened response above 60 Hz and extended bass output below 30 Hz in room compared to the near field response.
Using the baseline measurement, I identified the worst peaks above and below 50Hz; considering the highest peaks near 45 Hz at 64 dB and 55 Hz at 65.5 dB relative to the levels near 34 Hz and 64 Hz at approximately 62 dB, my first attempt at settings:
B1: 45 Hz, 0.3 octave width, and
a –2 dB level adjustment
B2: 55 Hz, 0.3 octave width, and
a –3 dB level adjustment
To determine the width setting for the eQ.2, observe that both peaks have peaks that are less than 10 Hz wide. Commonly, this setting is described with a parameter called Q that can be determined from dividing the frequency range by the center frequency, but the eQ.2 controls are marked with octave ratios. Knowing that each octave is a doubling of frequency, we can develop the following table based on the center frequencies and one half an octave above and below that center:
| Octave Below (Hz) | Center Frequency (Hz) | Octave Above (Hz) | Octave Spread (-1/2, +1/2) (Hz) | 1/3 Octave (-1/6, +1/6) (Hz) | One Octave (-1/2, +1/2) (Hz) | 3 Octaves (-1½, +1½) (Hz) |
| 22.5 | 45 | 90 | -11.25, +22.5DF=33.75 Q=0.75 | 41.25-52.5DF=11.25Q=0.25 | 33.75-67.5DF=33.75Q=0.75 | 11.25-112.5DF=101.25Q=2.25 |
| 27.5 | 55 | 110 | -13.75, +27.5 DF=41.25 Q=0.75 | 50.42-64.17 DF=13.75 Q=0.25 | 41.25-82.5 DF=41.25 Q=0.75 | 13.75-137.5 DF=123.75 Q=2.25 |
Similar information can be developed in this fashion for any center frequency. From this table, two things become evident, the one third octave setting is closest to our needs for this particular situation and that the three octave setting is not practical for use, as it effectively would blanket the entire bass frequency range. At 20 Hz and 30 Hz, it is a 45 Hz and 67.5 Hz spread, respectively, that could be useful, but by 40 Hz it is a 90 Hz frequency spread between 10 Hz to 100 Hz. This Q is the width of an entire typical LFE channel, which would allow one to truncate all of it; the bass that is.
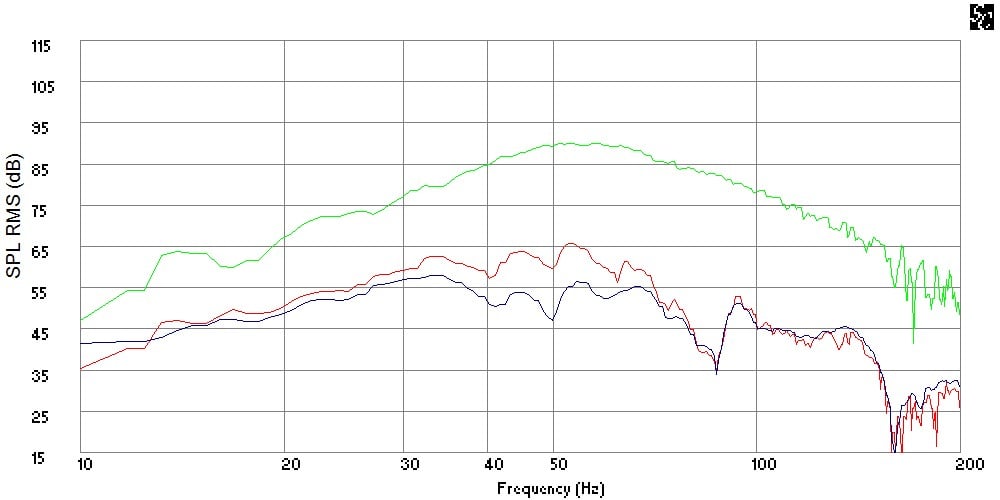
Figure 3: Nearfield vs. In Room Frequency Response, EQ Trial 1
Figure 3 represents my first attempt at making the intended settings (blue curve) relative to the unequalized (red curve) room response. This brings up another observation about usability. The small diameter knobs coupled with wide settings and limited markings makes for imprecise settings working by eye. It can be clearly seen that I overshot the level cut settings on the eQ.2. Also, some bleed over to adjacent frequencies is present due to limitations in the width (Q) setting.
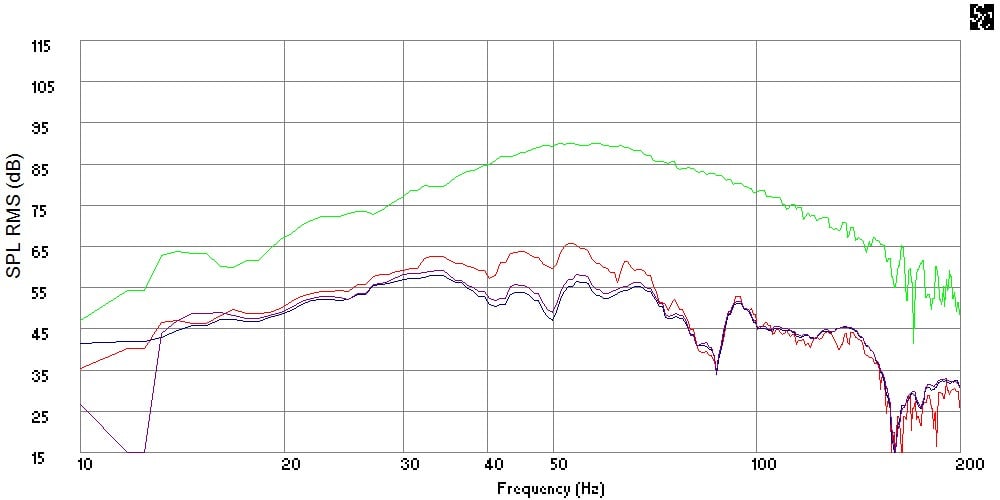
Figure 4: Nearfield vs. In Room Frequency Response, EQ Trial 2
Attempt number two (purple curve) and this time I am too delicate with adjusting the knobs to reduce the level cut at both of the equalizer center frequencies.
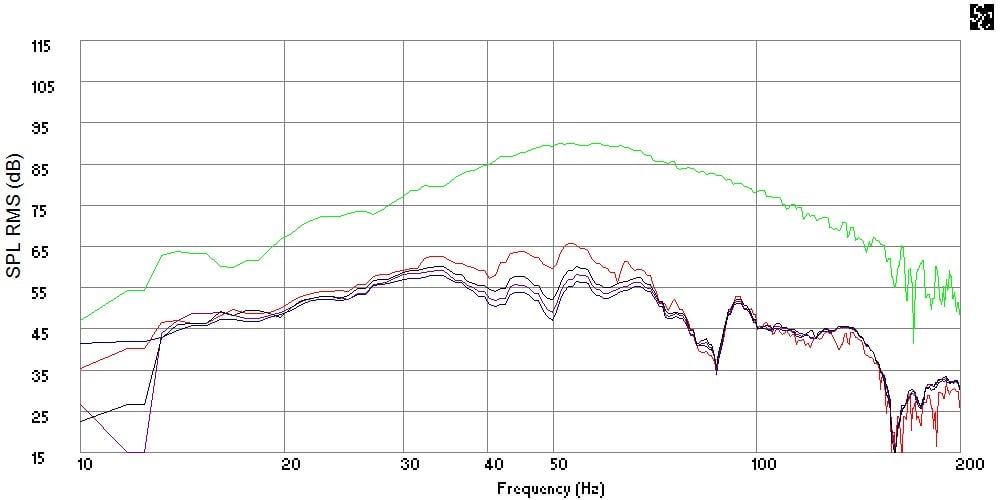
Figure 5: Nearfield vs. In Room Frequency Response, EQ Trial 3
Attempt number three (black curve) is closer to getting both level settings to where I want them. The 55 Hz peak is close to flat relative to 34 Hz, but the 45 Hz peak is still a bit low. To get all of this just right will obviously take a bit of fiddling with the knobs, but this will suffice for my purposes of illustrating use of the eQ.2.
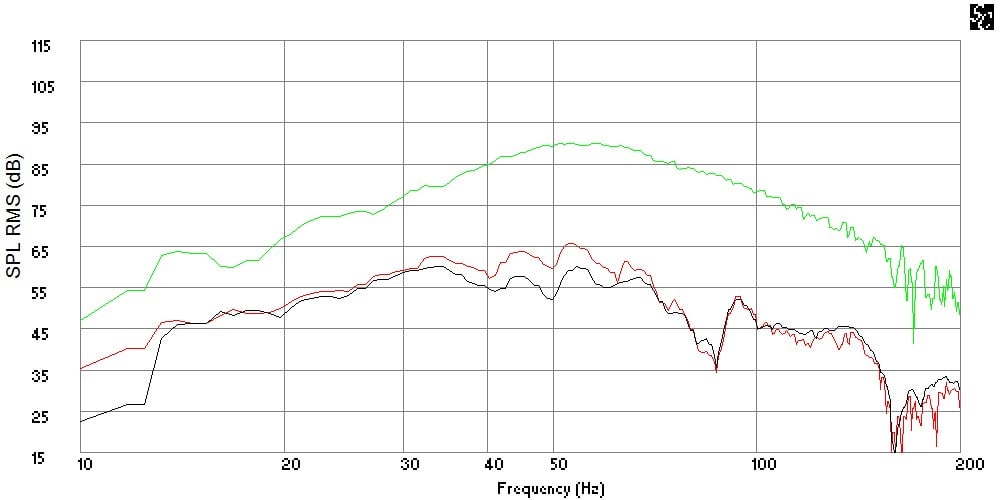
Figure 6: Nearfield vs. In Room Frequency Response, EQ Final
The final figure eliminates the first two trials, which more cleanly shows the initial (red curve) and final (black curve) state of in room response at the measurement location.
Usage and Recommendations for Improvement
As far as the eQ.2 performing, it worked as advertised, cutting levels at frequencies and over bandwidths as specified by the user. Where the eQ.2 could be a bit better in actual use is the small knobs coupled with wide ranges that make settings imprecise.
After determining what settings I needed to flatten my room bass response, I found it difficult to make those setting. Any setting between the control boundaries was by eye using tick marks that did not always correspond to the ranges in a simple, logical way.
Assuming linear behavior of the 7/16” knobs with a rotation range of about 300 degrees:
 Frequency
- Band 1 frequency range is 50-10 = 40Hz
- 5 intermediate tick marks, 6 spaces, each tick is 40/6 = +3.33Hz
- Band 2 frequency range 100-50 = 50Hz
- 5 intermediate tick marks, 6 spaces, each tick is 50/6 = +8.33Hz
Width
- 0.3-3.0 octaves = 2.7 octaves, 9 intermediate ticks
- 10 spaces, each tick is 2.7/10 = +0.27 octaves
- This puts the one octave setting at an unintuitive 10 o’clock position
Level
- +15-(-15)=30dB, 9 ticks, 10 spaces, each tick is +3dB
Slight adjustments in the rotation of the knobs would leave me overshooting or undershooting the desired setting value. The available rotation would be put to better use with wider angles for adjustments, for example with the width, using 1/6th (0.167) octaves to 1.0 octave over the same knob rotation to allow control that is more precise. Another way to improve the difficulty in making settings would come from simply using larger diameter knobs:
| Knob | Diameter | Circumference | Rotation | Rotation | Knob | Range | Rotation | Arc | Arc |
| Function | (in) | (in) | (deg) | Ratio | Range | Units | (in) | Rotation | Units |
| Band 1 | 0.4375 | 1.3744 | 300.0 | 0.833 | 40.0 | Hz | 1.145 | 0.029 | in/Hz |
| Band 2 | 0.4375 | 1.3744 | 300.0 | 0.833 | 50.0 | Hz | 1.145 | 0.023 | in/Hz |
| Width | 0.4375 | 1.3744 | 300.0 | 0.833 | 2.7 | Oct | 1.145 | 0.424 | in/Oct |
| Level | 0.4375 | 1.3744 | 300.0 | 0.833 | 30.0 | dB | 1.145 | 0.038 | in/dB |
The frequency knobs, for example are less than 1/32nd inch per Hz. Doubling the diameter to an inch at least gets us to 1/16th inch per Hz and at least onto a standard ruler.
On top of this, the tick marks themselves are actually hidden behind the knobs, in that they are arrayed around at the same outer radius as the knobs. So, one has to get in close with good lighting to actually see them to make adjustments using the marks; a potential problem if the eQ.2 is installed in a tight equipment rack or other out of the way location.
As to how the eQ.2 sounds, that really is a function of how well one’s tuning efforts work out. In my case, nipping some small humps above 40 Hz resulted in a perceived extension of bottom end bass output, improving low end extension. Considering that every 3 dB is a doubling of power, I effectively doubled the bass output in the lowest octaves, relative to the range I trimmed.
The difference I found is not a huge change but it is a noticeable improvement. Of course, bigger room mode problems will lend themselves to ever more dramatic acoustic improvements with the eQ.2 properly tuned, albeit with a need to increase the overall LFE output to rebalance the system. Remember, that flattening bass humps will lower the overall output across the frequency range, requiring some rebalancing of the subwoofers relative to the mains.
Conclusion
Even if one owns equipment with DRC like Audyssey built in, additional parametric equalizers in the bass range may still be beneficial. The various implementations Audyssey still have a limited number of equalization bands to spread across problems throughout the audio frequency spectrum. Freeing some of those bands to deal with phase sensitive mid and high frequency problems in the digital domain by adding a few bands of analog parametric equalization at low frequencies will allow Audyssey to concentrate on additional spatial and coherency room acoustics problems.
The eQ.2 represents a usable parametric EQ solution but with some caveats. The eQ.2 is inexpensive and functional, but it is bare bones basic. For someone on a tight budget or the DIY types, the eQ.2 will certainly do the trick. It will take a couple of measurements and a bit of trial and error with the knobs to get the settings just right, but it can be done. If adequate tools to take measurements with are not readily available, it is unlikely that any real progress can be made at taming unruly bass frequencies, and may actually produce less than satisfactory results that make the situation worse. This is not a solution for someone who expects to press a button and have results.
I can recommend the eQ.2, but only if one knows what they are getting into.
Elemental Designs
1618 N. 15th
Ave. E.
Newton,
IA 50208
(641) 792-2501
http://www.elementaldesigns.com
The Score Card
The scoring below is based on each piece of equipment doing the duty it is designed for. The numbers are weighed heavily with respect to the individual cost of each unit, thus giving a rating roughly equal to:
Performance × Price Factor/Value = Rating
Audioholics.com note: The ratings indicated below are based on subjective listening and objective testing of the product in question. The rating scale is based on performance/value ratio. If you notice better performing products in future reviews that have lower numbers in certain areas, be aware that the value factor is most likely the culprit. Other Audioholics reviewers may rate products solely based on performance, and each reviewer has his/her own system for ratings.
Audioholics Rating Scale
 — Excellent
- — Very Good
- — Good
- — Fair
- — Poor
| Metric | Rating |
|---|---|
| Build Quality | |
| Fit and Finish | |
| Ergonomics & Usability | |
| Features | |
| Performance | |
| Value |
Professionally, David engineers building structures. He is also a musician and audio enthusiast. David gives his perspective about loudspeakers and complex audio topics from his mechanical engineering and HAA Certified Level I training.
View full profile