
AV123 Rocket UFW-10 Subwoofer Review
Rocket UFW-10
- Product Name: UFW-10
- Manufacturer: Rocket
- Distributor: AV123
- Performance Rating:

- Value Rating:

- Review Date: January 31, 2005 19:00
- MSRP: $ 599
Drive unit:
(1) 10" die-cast woofer w/ 2" voice coil and laminated, black anodized, aluminum/pulp composite cone
Power Handling:
Rated at 500 watts
Frequency Response:
Rated 25Hz -150Hz ±2 dB Measured 30Hz - 108Hz ±1.75dB
Features:
One-band, parametric EQ (freq, bandwidth and level), continuously variable 0º to 180º phase,
gain, and crossover adjustments (40Hz -150Hz), crossover disable option, LFE summed R/L input, balanced mono XLR input, auto-on/standby mode
Enclosure:
Rosewood veneer front, back and sides with high gloss, piano black top and bottom caps
18mm x 3" span brace from left to right side tied into top cap
Finishes available:
South American Rosewood or Bird's Eye Maple with Macassar Ebony, piano black end caps
Size:
13.125"W x 12.875"D x 13.4375"H
Product weight:
46 lbs. (20.91kg)
Shipping weight:
52 lbs. (23.64kg)
Pros
- Most beautiful cabinet finish ever seen in this price class
- Fine furniture appearance & small size = great WAF
- Excellent wideband low-bass response
- Powerful amp with flush, high-style controls
- Single-band parametric EQ for room-mode correction
- Impressive metal-pulp composite 10" cone
- Die cast woofer frame with beefy motor structure
Cons
- Bass can get loose at high volumes
- Proper EQ set-up requires extra equipment
- Pre-amp section overloads if input exceeds 500mV RMS causing low frequency response non-linearities.
- Subwoofer not magnetically shielded
Rocket UFW-10 First Impressions
Even though I'd heard ahead of time about the piano black lacquer and rosewood finish of the AV123 speakers (the other option is Birdseye Maple) I was not prepared for what awaited my eyes as I opened the UFW-10 subwoofer. At 52 pounds in the carton, the UFW-10 package seems quite heavy for its rather diminutive outside dimensions. To protect its products AV123 uses a double-box technique more commonly found in the pro-audio field for shipping amplified studio monitors.
Both the inner and outer cartons appear to be the equivalent of what we in the U.S. refer to as very heavy duty, 275 pound double-wall construction. What's more, there are none of the more traditional Styrofoam-based corner blocks or full Styrofoam end-caps either. Instead, AV123 has elected to use four, full-width, 5-layer, 1.375" rubberized-foam caps to cradle the UFW-10 within the double cartons. This type of rubberized-foam is usually seen in shipments of very expensive test equipment or with low quantity, very high-priced speaker systems.
On the top of the speaker was a plastic bag with the white cotton gloves I'd read about in other reviews. And the subwoofer itself was further cosseted in a white cotton drawstring bag! A first in my experience.
The double-boxing, with heavy-duty double-wall cardboard; the rubberized-foam end-caps, the cotton drawstring bag and gloves all add up to an extremely positive initial impression of this subwoofer. Should you decide to purchase this or other speaker products from AV123 please
allow me to make a couple of recommendations as to how to proceed next to keep the immaculately detailed cabinet you are about to see in as perfect condition as when it left the AV123 factory.
First, place the sub carton on a carpet, blanket or thick towel. Remove the rubberized foam end-caps from the top of the container, then loosen the drawstring on the cotton bag and push the bag down around the sides of the system. Now hold the subwoofer with your ungloved hand so the high gloss black top cap doesn't touch the inner cardboard box as you tilt the whole kit-n-caboodle over 180 degrees so the top of the subwoofer is resting up-side-down on your carpet. You've now felt the 46 pound net weight of the UFW-10 itself and it's perfectly positioned so you can screw the four hard-point feet into the brass inserts on the bottom high gloss black end-cap. Don't do this yet! Please read on...
Rocket UFW-10 Subwoofer Aesthetics
A point (yes it's a pun) to be made about AV123's foot design is that there is no choice for either rubber feet or hard points. It is hard points only. Also thoughtfully supplied are four nicely machined 23mm diameter x 3mm thick brass discs with center indentations which allow the wide-base brass-point feet to rest on a hardwood or tile floor without puncturing or scratching the floor material. The quality of these solid brass feet and extra wide width of the brass cabinet inserts on the bottom black lacquer end-cap imply attention to detail usually reserved only for speaker systems retailing for many times more than the UFW-10's $599 SRP.
Okay, on the subject of pointy feet, it's soapbox time. I've had an attitude about pointy feet for quite a while now and it has to do with two parameters:
- Precisely how the pointy foot physically attaches to the subwoofer cabinet and exerts leverage on its mating cabinet insert might be cause for concern.
- Sir Isaac Newton's first law of physics, "For every action there is an equal and opposite reaction." holds true especially well for subwoofers.
Let's think about this: a forward-facing subwoofer is at an exact 90º angle to pointy feet. Pointy feet are in essence a lever arm, maybe only the 1.75" or so as on the UFW-10 but a lever arm nonetheless. Imagine a 46 pound mass (downward force vector) in concert with a woofer cone's sideways moving mass (perpendicular force vector, a 90º difference); what can happen? What is the highest pressure point within this system?
The highest pressure point in the system would be wherever the highest pressure point always is when there is a lever arm present; at the end, or in this case the base, of the lever arm. The highest pressure point is at the brass insert-MDF (compressed wood) interface. This could mean that, given a woofer cone with enough mass, being driven by a powerful enough amplifier (the UFW-10 has both) that the brass insert could eventually wear down the MDF interface (crumbling the MDF particles) into which it has been inserted, leading eventually to a fairly loose insert.
This loosening of the brass insert-MDF interface can also be accomplished almost immediately during set-up. In moving this heavy sub, with the brass points screwed in, it is very easy to accidentally drag the sub's sharp points sideways, exerting a huge amount of force at a 90º angle around the area of the insert. This can cause an immediate crumbling of the MDF wood surrounding the brass insert. I did this dumbbell maneuver on one of the two UFW-10 subs under review and am relaying my experience so that you don't make the same mistake.
Bottom line on the spikes: it's a good idea to wait until you've done all the moving around and positioning of your sub or subs before you put on the pointy feet. As an alternative to the pointy feet I would recommend using a piece of the rubber drawer liner material that is sold in hardware stores underneath a footless sub. This material will keep the sub in place whether on a hardwood floor or on carpet.
After performing single-band parametric system calibration you can determine whether or not you want to add the pointy feet or stay with the rubber drawer material interface. Thoughts on options:
- If you need to isolate the sub's sounds from transmission to a room below a tiny bit then use the spikes.
- If you're piecing through carpet, use the spikes.
- On hardwood floors my recommendation would be to stay with rubber drawer liner. Though the supplied hardwood floor-saving brass discs are also an option you'll probably need a second person to help in positioning them so as not to put the aforementioned sideways force on the brass inserts.
Personally, I believe that the more rigidly a subwoofer is held in place, by its own weight or otherwise, the "tighter" the formation of the low bass fundamental frequencies will become. Think action...woofer cone; clamp reaction...brass discs' tendency to slide on hardwood.
UFW-10: Beautifully Compact
Visually, the UFW-10 is the most elegantly executed, beautiful subwoofer I've seen. At 13.125"W x 12.875"D x 13.4375"H this sub is small, really small. The high gloss black top and bottom caps must have (I'm guessing here) over twenty coats of high gloss polyurethane lacquer. And there was not a single paint blemish to be found on any of the four surfaces of the two subs under review.
The rosewood veneer on the review samples is simply stunning. All four corners are gently rounded and close inspection reveals that the left and right side panels use 6.5" wide (!) book-matched rosewood flitches. The front and back panels are blended and finish-sanded so well into the side panels that only very close inspection reveals that this cabinet is not made from a continuous piece of rosewood veneer. The last time I saw rosewood finished this well or even offered in a loudspeaker cabinet for that matter was back in the early eighties when the $64,000 Infinity IRS system was available. Good company indeed.
Rocket UFW-10 Build Quality
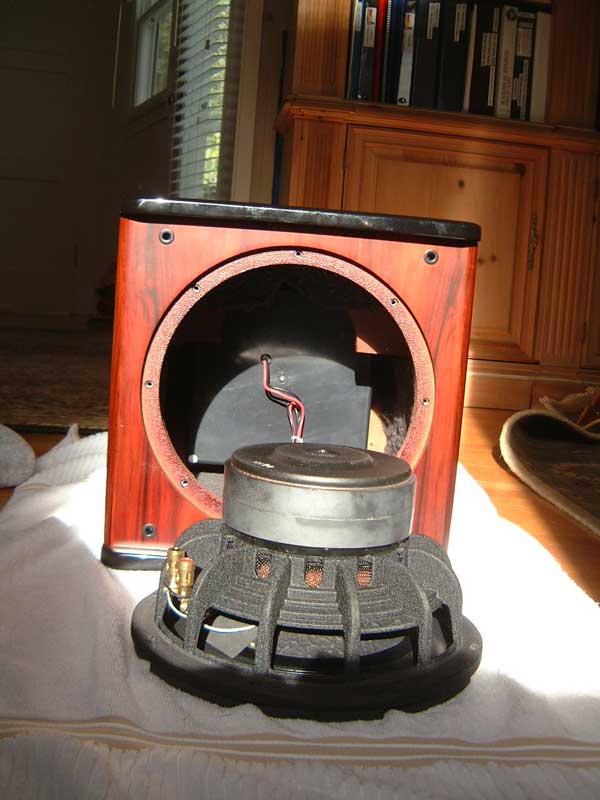 The UFW-10's 13 pound woofer is built within a
heavily ribbed die-cast aluminum frame. It is secured to the MDF enclosure utilizing 8 machine
screws clamping into steel T-nut-style inserts. Note that the woofer has a double-stack magnet
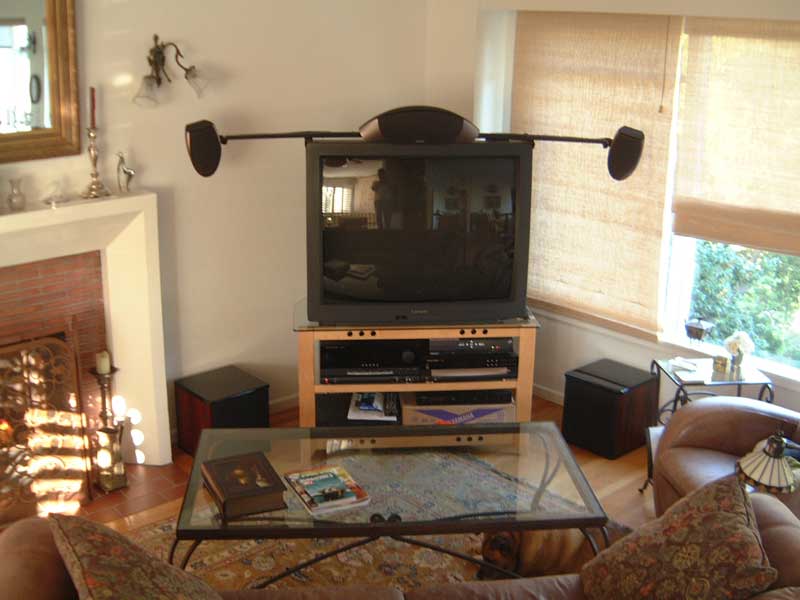
structure but no shielding so caution would be advised in placing this sub close to a CRT (tube
TV).
The UFW-10's 13 pound woofer is built within a
heavily ribbed die-cast aluminum frame. It is secured to the MDF enclosure utilizing 8 machine
screws clamping into steel T-nut-style inserts. Note that the woofer has a double-stack magnet
structure but no shielding so caution would be advised in placing this sub close to a CRT (tube
TV).
The woofer cone of this sub is a hybrid sandwich of a black-anodized aluminum, single-dish diaphragm bonded at the back to a heavy pulp substrate. This clever and expensive construction gives the non-bending "perfect piston" performance of metal while the pulp substrate damps any high frequency ringing effects of aluminum. At the same time the combination of the two materials adds substantially to the moving mass of the system which usually allows for better low end performance.
The cabinet's front baffle is just under an inch in thickness measuring 22mm (0.86"). The rest of the five surfaces appear to be closer to 18mm (0.70"). There is also an 18mm top-mounted side-to-side brace. Structurally a good idea given the pressure generated in this sealed-enclosure subwoofer.
The Amplifier Module
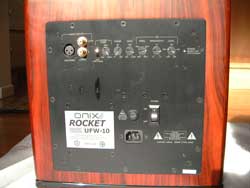 The amplifier module is a self-contained unit utilizing a
solid feeling plastic rear enclosure. This enclosure keeps the air pressure inside the cabinet from
transmitting air noise through portions of the amplifier plate such as the female RCA connectors. In
many less well-built HTIB subwoofers I've seen the plastic rear enclosure used on sub-amps is
sometimes too thin-walled or not heavily braced. This can cause an "oil-canning" wherein the whole
plastic surface acts like a diaphragm, pushing whistling air out an RCA hole. This is not the case
with the USW-10's plastic enclosure. It appears very well braced and solidly made. Pressing hard, I
couldn't get the large plastic back wall of the sub to budge at all.
The amplifier module is a self-contained unit utilizing a
solid feeling plastic rear enclosure. This enclosure keeps the air pressure inside the cabinet from
transmitting air noise through portions of the amplifier plate such as the female RCA connectors. In
many less well-built HTIB subwoofers I've seen the plastic rear enclosure used on sub-amps is
sometimes too thin-walled or not heavily braced. This can cause an "oil-canning" wherein the whole
plastic surface acts like a diaphragm, pushing whistling air out an RCA hole. This is not the case
with the USW-10's plastic enclosure. It appears very well braced and solidly made. Pressing hard, I
couldn't get the large plastic back wall of the sub to budge at all.
Finally, the two sidewalls and top and bottom inside the enclosure are lined with 1/4" felt batting. Given the extremely long wavelengths of the frequencies subwoofers are meant to produce it is still curious to me when I see any type of insulation included in a subwoofer. I do know though that it seems equally odd to Chinese assembly-line workers who make many types of (full-range) speakers, all of which could really use the insulation. So the inclusion of the felt material in this subwoofer may just be an attempt to not confuse the workers who make these several types of loudspeaker cabinets. Install insulation in all models and you know you've always made the correct choice.
The UFW-10 Under Test
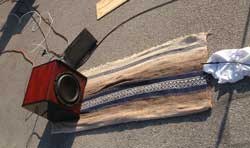 To get decently accurate measurements subwoofers need to be tested outdoors. I used the back
parking lot and the LMS (Loudspeaker Measurement System software program by LinearX) of Speaker City
USA in Burbank, California. Tested outside, subwoofers can be measured very accurately using the
ground plane measurement technique as seen in the photograph.
To get decently accurate measurements subwoofers need to be tested outdoors. I used the back
parking lot and the LMS (Loudspeaker Measurement System software program by LinearX) of Speaker City
USA in Burbank, California. Tested outside, subwoofers can be measured very accurately using the
ground plane measurement technique as seen in the photograph.
To protect the UFW-10's cabinet I placed a heavy blanket down on the asphalt. The AV123 sub was laid on its side on top of the blanket. One meter away the LMS microphone was placed on the other end of the blanket. Setting of the rear amplifier controls were as follows:
-
Input signal from LMS was plugged into the amp's XLR (marked LFE/mono) connector. (In addition to a pair of gold-plated RCA jacks, an XLR is a real rarity for a sub in this price range.)
-
Crossover switch set to "out" (LFE mode).
-
"Phase" rotary control set to 0 degrees.
-
"Gain" set to max clockwise rotation, marked as +15dB.
-
EQ (single band parametric equalizer section): the 3 controls were set as follows:
-
-
"Freq" > full clockwise, labeled as 80Hz.
-
"Bandwidth" > full clockwise bandwidth, labeled as 1.0.
-
"Level" > set to 12 o'clock position, labeled 0d
-
With the controls set as shown above I adjusted the LMS to input 1 volt to the UFW-10. The reading I got indicated that the either the sub's input was overloading or the transducer was compressing under power. So I reduced the voltage and tried again. As I reduced the voltage input levels the UFW-10's low frequency response began to extend lower and lower. At 500mV input this little marvel recorded a frequency response of 35Hz to 100Hz at 104dB SPL! From the curve I would guess that at least 3dB of equalization boost, centered right at 35Hz, has been dialed in. This is normal practice during a subwoofer's design stage. It is this EQ boost which allows such a small-cabinet 10" 500-watt sub to extend in frequency as low as it does.
For those who would like compare the performance of this sub with that of others in this price class, here's what to be aware of when reading some other manufacturer's literature.
-
Published figures almost never tell you how far down a sub (or any speaker system for that matter) can reach and still be truly "flat".
-
Speaker engineers usually consider the "F3" or three dB down point of full-range systems as being the maximum honest amount of dB-down.
-
In the case of or subwoofers it is the 6dB down figure that is utilized in the engineering lab if a competitor's sub is being evaluated. Minus 6dB is a stretch but gives the benefit of the doubt as to the audibility of such a frequency.
-
Many company's sales literature for both full range speakers and subwoofers will not quote a "-dB" or "__dB" down point when promoting a system's lowest hearable frequency . Almost always in this case of the lacking qualifying parameter the measurement has been taken at 10dB or more down. So the actual figure quoted is of little use. It is very difficult to hear a note at the frequency extremes which is 10dB or more down in level.
In the case of the UFW-10, we've already used the ground plane measurement method so we're seeing the 6dB "boost" that wouldn't be observed in a 4pi anechoic chamber measurement. This is an honest measurement. Place your own UFW-10 on a floor, away from walls, and this is the performance you can expect. If we drop another 4dB down from our 35Hz figure we can get to the 10dB down point which competitor's marketing specs may use. For the UFW-10 that -10dB point is around 29Hz. My take is that for a subwoofer of this very small size this is excellent performance indeed.
I had a sub quite similar in many respects to the UFW-10; the non-discontinued Infinity Interlude IL100S ($499 SRP). The Infinity was a ported design, a bit larger in overall dimensions and constructed of vinyl wood-grain-covered MDF. It had a 250-watt amp as opposed to the 500 watts claimed for the AV123 product. Like the UDW-10 I used for this test, the Infinity also had a manual set-up single-band parametric EQ but no set-up kit. If you are doing it for the first time these manual single-band parametric EQ versions of both subwoofers can be fairly time consuming to set up. And to do so accurately, without any test gear, is futile.
The owner's manual included with the UFW-10 is also available on theAV123 website. In it the manual set-up procedure is specified. It is recommended that the user have the ubiquitous Radio Shack analog SPL meter along with the bass test CD called "Basszone1" available through www.stryke.com. You'll also need to set up a frequency vs. SPL grid-chart so you can plot the subwoofer's response at intervals of 5Hz or less while you adjust the "Freq", "Bandwidth" and "Level" sections of the parametric EQ. Following AV123's instructions and methodically going through the set-up procedure for the first time can seem daunting. But from my point of view taking the time to get so intimately involved with the actual sound of different low frequency tones is an incredible learning experience. You're not only calibrating your sub, you're calibrating your ear/brain listening system at the same time! Suffice it to say that inclusion of this singularly effective room-mode compensation circuit in the UFW-10 potentially makes it one of the flattest, most accurate, in-room response subwoofers at the lowest price available.
Rocket UFW-10: Using Two Subwoofers
 I picked a subwoofer as the topic for my first loudspeaker review
because I firmly believe that without a lot of up-front attention given to a system's accurately
portrayed bottom end the very foundation of both music and movies is stripped of its requisite emotive
impact. Avid Audioholics will have read "
Loudspe
a
kers: When is Enough Good
Enough
"
Part
1
wherein I told of my first tri-amplified reference speaker, the one-off Marantz Imperial 9 which
had two 10" woofers, equalized dead flat in-room to 30Hz, in each of two stereo full-range speakers
(four 10" woofers total).
I picked a subwoofer as the topic for my first loudspeaker review
because I firmly believe that without a lot of up-front attention given to a system's accurately
portrayed bottom end the very foundation of both music and movies is stripped of its requisite emotive
impact. Avid Audioholics will have read "
Loudspe
a
kers: When is Enough Good
Enough
"
Part
1
wherein I told of my first tri-amplified reference speaker, the one-off Marantz Imperial 9 which
had two 10" woofers, equalized dead flat in-room to 30Hz, in each of two stereo full-range speakers
(four 10" woofers total).
From that first experience with great bass, I've always remembered the most obvious of credos; that to get clean accurate low bass you need a lot of well controlled piston area (the woofers' usable working area) driven by a lot of clean amplifier power. Make the box smaller, and the power requirements to put out the same SPLs can start to go up almost exponentially.
This need for vastly increased power is especially true in the lowest 20Hz - 40Hz octave of music. Now add the fact that to produce a 20Hz note the woofer must move 4 times further than to produce a 40Hz note and it should become obvious that setting a low end requirement of 20Hz is imposing a very stringent and perhaps unnecessary requirement on your .1 system.
My target low frequency response, to keep a subwoofer reasonably sized and priced, has always been flat to -1 or -2dB at 30Hz. I look at the situation from a viewpoint of size, for unobtrusiveness, versus real-world performance capability. While it may be true that the lowest note on an organ is 16.4Hz, given the choice I'm betting most significant others wouldn't accept a subwoofer at least twice the size as the UFW-10 just for a few scant moments of musical ecstasy when E. Power Biggs hits that open stop 16Hz organ note. Similarly, for the 5% of sound effects that actually reach lower than 30Hz in more than 1 or 2% of all movies, I don't see the attraction either.
My point of reference is and always has been to be able to accurately reproduce the lowest notes on the piano, the harp, the contrabassoon, and the rare five-string electric bass, all of which are closer to 32Hz. Bottom line, I believe a system flat to 30Hz with a -6dB point of 25-27Hz allows the best trade-off in size vs. performance vs. cost.
Small Box with single-band, parametric EQ + Your HT Space = Articulated Bass
 Let's assess what we're asking of
AV123's UFW-10; a single 10" transducer in a sealed enclosure with less than one cubic foot internal
volume. We know it can hit a very respectable 104dB at 1 meter while maintaining a relatively flat 35Hz
to 100Hz frequency response. If we put it up against a wall we have the potential of gaining another
6dB from the wall's reinforcement. This is starting to look pretty good from a pure numbers standpoint
but don't hold onto that (theoretical110dB) number just yet.
Let's assess what we're asking of
AV123's UFW-10; a single 10" transducer in a sealed enclosure with less than one cubic foot internal
volume. We know it can hit a very respectable 104dB at 1 meter while maintaining a relatively flat 35Hz
to 100Hz frequency response. If we put it up against a wall we have the potential of gaining another
6dB from the wall's reinforcement. This is starting to look pretty good from a pure numbers standpoint
but don't hold onto that (theoretical110dB) number just yet.
We haven't yet added your home theater room or listening space into the equation. We realize from our forums that the numbers of home theater or music listening spaces which are actually in an easy-to-optimize rectangular box of a room are truly in the minority. The most common home theater room scenario from our readers seems about equally divided between either a rectangular room with the furniture forced up against a wall or a great room, completely open to the kitchen/dining area. And it seems with these to examples that the ceiling is either very high or, in the case of the rectangular room one wall might be missing completely.
The bottom line with the home theater room scenarios above is that very few conform to a 2000 cubic foot or 3000 cubic foot standard which THX and most others in the professional design community use as a design parameter. Consequently, we Audioholics are almost always trying to get a single, underpowered 8" or 10" subwoofer to perform some kind of SPL miracle in a room that is much too large.
Once past the issue of "Will it play loud enough?" (to give the music its essential foundation) the last and most important piece to the bass puzzle is to know how to listen for and appreciate the elusive quality of bass articulation. Of all the parts of the musical spectrum I believe bass quality is the easiest to recognize once you have it. Until recently though an in-depth analysis of the problem with bass quality in home theaters has almost always been glossed-over in most all subwoofer reviews. Why....?
It's a question of the haves (as in those few subwoofers having some form of parametric equalization) versus the have-nots. In one of the last issues of the now defunct Audio magazine a manual set-up, 1/20th octave, single-band parametric equalizer was first introduced by Infinity in their flagship Prelude system subwoofer module. At the time of that article the $6K to $9K Intermezzo and Prelude systems where the only subs with single band parametric EQs.
Most manufacturers still aren't hip to the overwhelming benefits that come along with this capability. And it's understandable why. Infinity's sales department didn't see huge leaps in subwoofer sales with their single-band EQ system because:
- It came out first in very high priced systems and
- When it did come out at lower price points it was found that the salesmen within Infinity's dealer base would almost never take the time to set the sub up optimally. And who can blame them? Sound rooms were always being rearranged and demo samples sold so there wasn't a whole lot of reason to spend 1 1/2 or 2 hours setting a sub up properly in the first place.
So here we are today, faced with a stunningly beautiful subwoofer, that, because of its single-band parametric EQ can be placed anywhere in the room you or the significant other decide, (except, of course, a null). It's priced well and it's flat response bass capabilities just await music and bass lovin' Audioholics who are willing to put in a couple hours up front to get clean, flat, low end like they've never experienced.
Also noteworthy from AV123 is that they listen and pay close attention to us at Audioholics. When AV123 heard that I wanted to use two of their subs for my first full length speaker review they immediately put a two-fer deal up on their site. Buy one UFW-10 at the normal retail of $599 or two for the bundled price of $999!
Rocket UFW-10 Calibration and Dual Setup
Okay, time to set-up for the flattest bass response at the listening position. We're trying for the highest overall SPL using the least amplifier power. Subwoofers need lots of spare power available.
If your HT set-up is in a living room corner like mine and you're starting with a single UFW-10, placing the sub into that corner can give you a potential of as much as an 18dB gain. This is free low frequency boost! (Qualification time: 18dB is the maximum theoretical gain that can be achieved when going from a 4pi anechoic chamber environment, which is like suspending a speaker in a spherical space, to a room corner which is basically a 1/8th pi environment)
Note that since this AV123 sub has the single-band parametric room-mode correction the dire warnings we've all read regarding corner placement of a sub go right out the window. Yes, corner placement does get you a lot of free gain but it will also typically generate a pretty good-sized room-mode bump. With the built-in single-band parametric EQ, however, the room mode will be tamed as the bass energy is more uniformly re-distributed across the low frequency spectrum during the calibration procedure described in AV123's Owner's Manual. You'll now be able to hear, perhaps for the first time, smooth, delineated, bass.
If your system set-up falls into the more common flat front wall placement, a single or even double subs at the one third point of the wall on either side of the center channel should also work well. Wall placement can give a 12dB boost in frequency though, like corner placement, in the real world the gains are usually less than the theoretical 12dB and 18dB maximums.
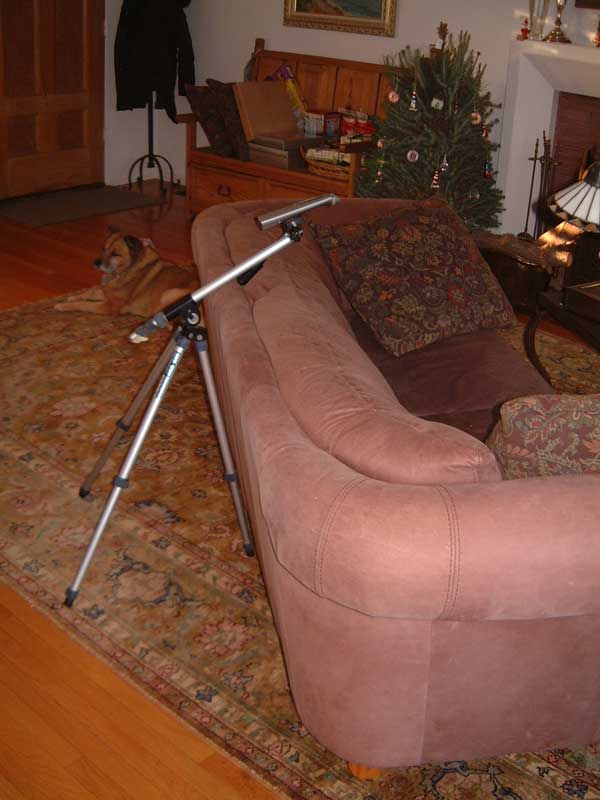
One critical step is to mount the Radio Shack meter on a tripod and situate it at exactly your ear level in the primary listening position. And pay attention to the dB correction values given for the Radio Shack meter in the instructions. The strength of a room mode at your listening position does not mean you can skip the tripod and just lay the RS meter on your sofa. The measurement won't work as well. So take the time to help the set-up procedure work correctly and you'll be rewarded with tight, tuneful and well differentiated bass! When you hear a really well recorded DVD such as "Heat Wave" from the "Standing in the Shadows of Motown" disc you'll be absolutely amazed that you put up with that one note bass for so long!
Rating Speaker System Performance
I'm going to divide the five star rating system Audioholics has been using for their electronics and loudspeaker reviews so far into half or quarter stars. I do this for several reasons:
- The five star systems we've used at Audioholics tend to bunch all manufacturer's products toward the top four to five stars, even when using half stars. In the case of electronics, with audible differences so small as to be unnoticeable between, say, the sound of a $1000 receiver and a $2000 receiver, this rating system makes a lot of sense. After all, a receiver's measurable frequency response differences are on the order of tenths of a dB at most. A loudspeaker on the other hand can have huge differences in frequency response. It is these differences which are most notable in some very low priced systems. And hopefully less audible with a measurements-based speaker manufacturer who strives to put out the most musical and accurate speaker at each given price point.
- In listening double-blind in Harman's Multichannel Listening Lab we used a 10 point system. Using the10 point system was useful in that we trained listeners could place a speaker system in a hierarchy of sorts that rewarded higher points for speaker systems which actually performed in a manner superior to other systems. (i.e. Smooth, measurably flat frequency response.)
- As Sean Olive noted in his AES paper which described the scores of trained versus untrained listeners, trained listeners as a group would tend to score lower performing speaker systems toward the bottom of the range (0 to 3.5 or 0 to 1.75 stars) while good performing speaker systems would score toward the middle of the range (3.5 to 7.5, 1.75 stars to 3.75 stars). This left the top performing systems, usually the most well engineered (and costly) to post scores of 7.5 (3.75 stars) and above.
- In the case of subwoofers I have a pair that I currently use in my home theater which I plan to use as my "references". As a pair, in my home theater, I would give these two systems, calibrated with their single-band parametric equalizers specifically to my listening position, a cumulative score of 8.0 or 4 stars. Very, very good but still room for improvement. (More subs or a more refined system to better integrate the subs/listening space could edge the score higher.)
- Regarding subwoofers, and contrary to the generalized pronouncements within the audio community which says that once the bass is flat it should all sound the same, I will disagree. And I will explain my reasons for disagreement in this and subsequent subwoofer reviews.
My first reference subwoofer is the ( now discontinued) Infinity Intermezzo 1.2 12" acoustic suspension sub with the R.A.B.O.S. single-band parametric EQ and 850 watts dynamic power (originally $1800). The second sub is the currently available Infinity Beta CSW-10 10" acoustic suspension sub with R.A.B.O.S. and 650 watts dynamic power ($1000). The Intermezzo 1.2 is mounted in the corner behind my Sanus equipment rack atop which sits my 40" Mitsubishi TV. As measured and plotted manually, this sub has a virtually flat ±1dB, 20Hz to 80Hz frequency response, at the listening position 10' away. The CSW-10 is mounted behind the listening position and 8' from the listening position.
Since I would be using one or two front mounted UFW-10's for this listening comparison it was decided to leave the CSW-10 unplugged and to compare the single or dual CSW-10's to the single, reference Intermezzo 1.2. Here's what I found out during initial calibration of both the single and dual UFW-10 subs:
- Using the removable, IEC three-conductor (grounded) 14-gauge power cord that came with my review samples resulted in a 60Hz buzz on my system. Installing a $0.50 gray, two-conductor "cheater plug" made the buzz go away. Since there are no UL, CSA, or other approval ratings on the back of amp plate I would guess that by selling the UFW-10 with a UL-approved three-conductor power cord AV123 is saving thousands of dollars in certifications and passing the savings on to the consumer.
- Setting up a single UFW-10 sub to the left of the Sanus rack and using the Room Adaptive Bass Optimization System (R.A.B.O.S.) accessory kit that comes with some Infinity subs I was able to get the AV123 sub within ±2.5dB from 35Hz to 100Hz. I was able to achieve virtually the same ±2.5dB resolution and frequency response when I later set up the second UFW-10 sub symmetrically, to the right side of the Sanus rack.
- It is important to note that when setting up dual subs automatically with the newer S.O.S. UFW-10 version, that symmetry be maintained with your subs' placements with respect to room boundaries and the distances to your listening position. Going out of symmetry can give rise to slight phase differences in the arrival times of specific frequencies at your listening position. But since you run both subs in setup mode at the same, and it's done automatically, "pretty close to symmetry" is usually good enough.
Rocket UFW-10 Listening Tests
In the opening thirty seconds of "Standing in the Shadows of Motown" (in DTS) a single electric bass lays down some beautiful lines. Played at volume levels which hit 104dB at my listening position on my Radio Shack meter this half minute riff is quite revealing of a subwoofer's low frequency control.
My reference sub plays this segment back showing excellent delineation of each low note as the baseman moves skillfully up and down the scale. He could be in the room with his big Marshall amp behind him. The illusion is pretty convincing and the control of a very powerful amplifier over a highly damped 12" subwoofer is evident. Though an electric bass sounds loose by nature, in the hands of a skilled player the initial attack of the ~40Hz to 50Hz notes is what gives this instrument its transient snap. If this note sequence were put on a 'scope the amp's entire 850 watts might be seen to clip. This test is that difficult.
Playing back the same 30 second sequence over the pair of UFW-10 was surprising. Yes, there was a small loss of control as evidenced in the initial string plucks but unless one could A-B one system over the other it would be hard to say. Set-up against the front walls under both the left and right front speakers respectively the AV123 subs blended beautifully with the satellite speakers and were able to attain the same 104dB peaks with their extreme bottom frequencies remaining full and tuneful.
Unplugging and resetting the overall sub system level for one sub showed a bit more looseness on initial string plucks as the single system was now struggling to output the same SPL as two UFW-10s. That and the loss of 1/2 of the piston area shrunk the apparent size of the bass man a bit. Still though, considering that the voice-over in this opening sequence now registered a too-loud 92dB the single UFW-10 put on a heck of a performance.
"Heat Wave" on cut five of "...Shadows..." showcases two great musicians playing fast low-bass lines on drums and electric bass. It is here that the value of parametric EQ shines best. Both single and dual set-ups of the UFW-10s could clearly delineate the tonal differences between the two bass instruments. Both set-ups were also able to powerfully convey the low frequency syncopation happening between two musicians while the rest of the very large ensemble played instruments above the subwoofers' range. In my experience this wonderful low bass musical nuance seldom, if ever, is found in subwoofers in this price class. Correctly set-up, single-band parametric equalization is the reason.
Moving onto movies and sound effects, one of my standard references is the submarine adventure classic U-571. The depth charge scene spotlights the fact that explosions heard close- up do in fact have a very sharp leading-edge wallop which can be very difficult to reproduce.
The total envelope of a well recorded explosion has a leading edge lasting perhaps 10 milliseconds after which the sound continues to build yet becomes a bit more blunted sounding as upper bass harmonics enter. Finally the explosion sound-envelope closes as the harmonics take over adding a "fuller" more rounded sound to the overall effect.
On lesser systems in the UFW-10s price class, and without parametric equalization, it is usually only the sound of these harmonics which are heard and perceived as "the sound of the explosion". Listening to a single UFW-10 the explosive leading-edge transient is still in evidence while the dual UFW-10 set-up portrays the whole explosive picture more clearly and convincingly.
Rocket UFW10 Sub Curve Reading and Analysis
The curve shows the free-air, frequency response measurement (by ground-plane method) of the UFW10 Subwoofer with a 500 millivolt input. The single-band, parametric equalizer function was out of circuit. Average SPL is judged to be 104dB. Given a 104dB SPL average level the following observations/specifications can be assigned to the system's low-end response characteristic:
- Lowest frequency peak: 105.71dB SPL@ 36Hz
- Frequency at 104dB SPL average is 32.5Hz
- F3 or -3dB down point: 101dB @ 29.5Hz (You can still actually hear this.)
- F6 or -6dB down point: 98dB @ 27.5Hz (This is getting very hard to hear.)
- -10dB or 10dB down point: 95dB @ 26Hz (Most quoted number; for "spec" comparison only.)
The higher mid-bass frequency roll-off characteristic of subwoofers is quite important too. The UFW-10 sub has good, flat extension above 100Hz where it starts to roll off very gradually. A gradual roll-off such as this helps with the integration or "splice" as it's called between the subwoofer and the satellite speakers. A gradual roll-off as seen here usually indicates that a slight mid-bass EQ curve may have been applied electronically to alter the measured acoustic response as seen here.
A gradual roll-off like this is complementary when other software roll-offs will be applied to the system such as Dolby Digital or DTS. Specifications for the low pass characteristic:
- At 104B SPL average: 98Hz or 103.7dB SPL @ 100Hz
- -3dB or 101dB SPL @ 135Hz
- -6dB or 98dB SPL @ 228Hz
- -10dB or 94dB SPL @ 375Hz
This frequency response curve is fairly linear. A very tight (and honest) specification for frequency linearity would be 30Hz to 108Hz ±1.75dB.
Rocket UFW-10 Summary
With their wonderful combination of fine furniture appearance, well controlled low bass performance and the single-band, parametric EQ room correction circuitry, the UFW-10 is without peer in its price category. If I had a $1500 limit for my 5.1 system I would buy 2 UFW-10s for my foundation and then choose the satellites. AV123 has produced a winner!
The Score Card
The scoring below is based on each piece of equipment doing the duty it is designed for. The numbers are weighed heavily with respect to the individual cost of each unit, thus giving a rating roughly equal to:
Performance × Price Factor/Value = Rating
Audioholics.com note: The ratings indicated below are based on subjective listening and objective testing of the product in question. The rating scale is based on performance/value ratio. If you notice better performing products in future reviews that have lower numbers in certain areas, be aware that the value factor is most likely the culprit. Other Audioholics reviewers may rate products solely based on performance, and each reviewer has his/her own system for ratings.
Audioholics Rating Scale
 — Excellent
- — Very Good
- — Good
- — Fair
- — Poor
| Metric | Rating |
|---|---|
| Bass Extension | |
| Bass Accuracy | |
| Build Quality | |
| Fit and Finish | |
| Performance | |
| Value |