
Elemental Designs A7S-450 Subwoofer Review
- Product Name: Elemental Designs A7S-450 Subwoofer
- Manufacturer: Elemental Designs
- Performance Rating:

- Value Rating:
- Review Date: March 04, 2009 14:00
- MSRP: $ 775 - $860
- Enclosure: Front firing sealed enclosure
- Amplifier Type: n/a
- Amplifier Power (RMS @ 4ohms): 550/1300 Watts
- Amplifier S/N Ratio: > 90 dBA
- Bass Extension (+/-3dB): 22 Hz
- Woofer Nominal Diameter: 18 in
- Driver Excursion (+/-): 0.85 in
- Total Linear Displacement: 358.4 cubic in
- Motor Structure Diameter: 8.20 in
- Crossover Frequency: 50 Hz to 100 Hz
- Crossover type: Continuous variable low pass filter with bypass
- Crossover Slope: n/a
- Phase: 0 or 180 degrees
- Dimensions: (HxWxD): 22.25" x 22.25" x 22.25"
- Shipping Weight (lbs): 149 lbs.
Pros
- Potent subwoofer that won’t break the budget
- Surprisingly nuanced, musical presentation
Cons
- Industrial finish with minimal WAF
- Will not be easy to hide
- Large inrush may trip common household lines when powering up
Introduction
Iowa grown Elemental Designs has been quietly building its products and reputation from car audio roots at the University of Northern Iowa. Founded in 2002, the company history reads as a textbook entrepreneurial story arc, growing from car audio specialty manufacturing to home theater and an eye towards professional sound gear. As to the quiet growth, Elemental Designs lays claim to word of mouth from satisfied customers to move product rather than shouting through advertising.
Happy customers in lieu of advertising propaganda; what a great concept.
Low key advertising keeps costs low, allowing money to be ploughed back into manufacturing and R&D based capital expenditures as well as to pass savings back to customers. There is nothing worse than big advertising budget products where customers are saddled with the cost of procuring other customers for the company. Elemental builds subwoofers to order and delivers them direct to customers, alleviating the retail middleman, which also helps keep prices low.
Having little previous familiarity with Elemental Designs, my curiosity was peaked when Gene asked if I would like to review a 150 pound subwoofer. Being a glutton for punishment, I of course said yes.
Fortunately, for me, when this beast arrived, my wife made the UPS guy bring it into the house rather than leaving it in the garage for me to lift in as he suggested.
Design and Construction
 With an 18” driver and at 150 pounds it should be clear that the A7S-450
is a brute force solution to producing low end frequencies. There are bigger and heavier subs, but not
many.
With an 18” driver and at 150 pounds it should be clear that the A7S-450
is a brute force solution to producing low end frequencies. There are bigger and heavier subs, but not
many.
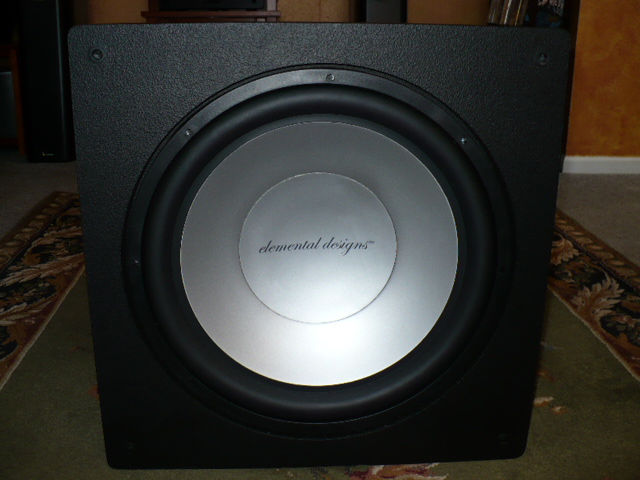
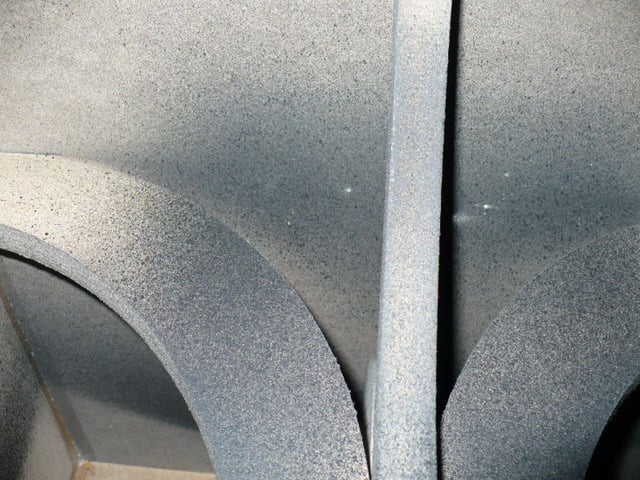
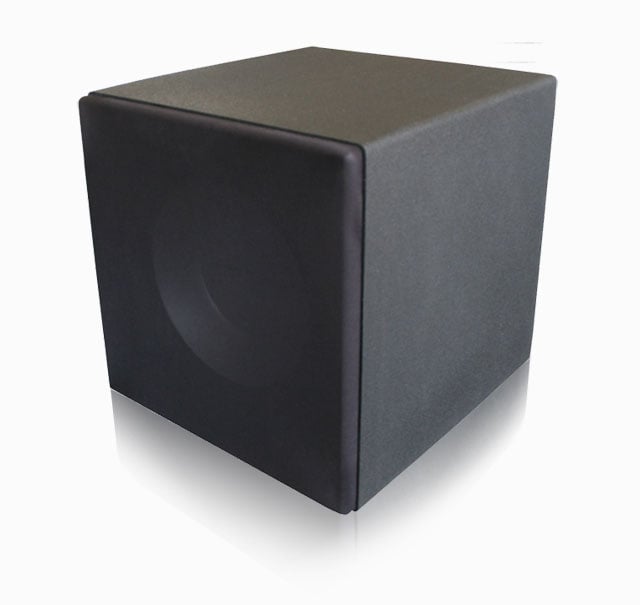
The review subwoofer came with a black finish and seems to be the only
color option available. Elemental
 Designs, eD, their nomenclature for short, states in the literature that the
cabinet finish is applied by a proprietary method, which produces a seamless,
rugged skin on the cabinet. This finish
is the definition of utilitarian: black, plasticy, and bumpy. To be completely honest, the finish looks
like it would be most at home in a guys dorm room or a frat house, a point
driven home by eD comments about the finish resisting beverage cans without
coasters and children. While the A7S-450
will not win any awards for architectural interiors/décor, if the potential for
damage to the finish is an issue in selecting a subwoofer, I am inclined to
believe eD when they claim that the finish will hold up well under abuse.
Designs, eD, their nomenclature for short, states in the literature that the
cabinet finish is applied by a proprietary method, which produces a seamless,
rugged skin on the cabinet. This finish
is the definition of utilitarian: black, plasticy, and bumpy. To be completely honest, the finish looks
like it would be most at home in a guys dorm room or a frat house, a point
driven home by eD comments about the finish resisting beverage cans without
coasters and children. While the A7S-450
will not win any awards for architectural interiors/décor, if the potential for
damage to the finish is an issue in selecting a subwoofer, I am inclined to
believe eD when they claim that the finish will hold up well under abuse.
Editorial Note on Cabinet Finish
According to eD, the rugged finish of my review sample has actually been discontinued and they have since then moved to a matte finish which is standard. This (previously upgrade charge) finish is now the only one shipped with this cabinet so the new units shipping are now little bit smoother looking.
 The cabinet is custom manufactured by eD on order using CAD based
designs and CAM
manufactured by CNC machine. In fact, eD claims to do 100% of their own design work, cutting work, paint work, and materials work in house in Iowa. As for exterior cabinet features, the A7S-450
cabinet features radiused corners and all of the components built into the
cabinet are mounted flush to that exterior.
The front firing driver is recessed an inch into the two inch thick
baffle, which also happens to be deep enough to accommodate the specified
driver excursion limit, providing it some protection.
The cabinet is custom manufactured by eD on order using CAD based
designs and CAM
manufactured by CNC machine. In fact, eD claims to do 100% of their own design work, cutting work, paint work, and materials work in house in Iowa. As for exterior cabinet features, the A7S-450
cabinet features radiused corners and all of the components built into the
cabinet are mounted flush to that exterior.
The front firing driver is recessed an inch into the two inch thick
baffle, which also happens to be deep enough to accommodate the specified
driver excursion limit, providing it some protection.
 The driver diaphragm material is not specified in any eD literature that
I found, but is likely coated polypropylene. The cone itself has a silvery appearance with
a large inverted dome dust cap with the company name scripted across it. The only point that I found to question the
quality of manufacture comes in with that logo which was not leveled across the
cap. It is likely that logo was applied
before the cap was secured to the rest of the cone. A minor point as I am sure very few
manufacturers make sure that dust caps are put on at any particular
orientation, but if the company name is scrawled across it, it does draw
attention to itself.
The driver diaphragm material is not specified in any eD literature that
I found, but is likely coated polypropylene. The cone itself has a silvery appearance with
a large inverted dome dust cap with the company name scripted across it. The only point that I found to question the
quality of manufacture comes in with that logo which was not leveled across the
cap. It is likely that logo was applied
before the cap was secured to the rest of the cone. A minor point as I am sure very few
manufacturers make sure that dust caps are put on at any particular
orientation, but if the company name is scrawled across it, it does draw
attention to itself.
 The A7S-450 offers a choice of rear plate amplifiers that are custom
manufactured for eD by a company called Keiga Electronics. The standard LT/550 produces 550 watts RMS
into a four ohm impedance load while an $85 upgrade to the LT/1300 provides
1300 watts RMS into a four ohm impedance load.
For the review, I was provided the more powerful LT/1300 amplifier
configuration. Considering the small
overall cost increase involved, spending the extra for the upgraded amplifier
is definitely recommended.
The A7S-450 offers a choice of rear plate amplifiers that are custom
manufactured for eD by a company called Keiga Electronics. The standard LT/550 produces 550 watts RMS
into a four ohm impedance load while an $85 upgrade to the LT/1300 provides
1300 watts RMS into a four ohm impedance load.
For the review, I was provided the more powerful LT/1300 amplifier
configuration. Considering the small
overall cost increase involved, spending the extra for the upgraded amplifier
is definitely recommended.
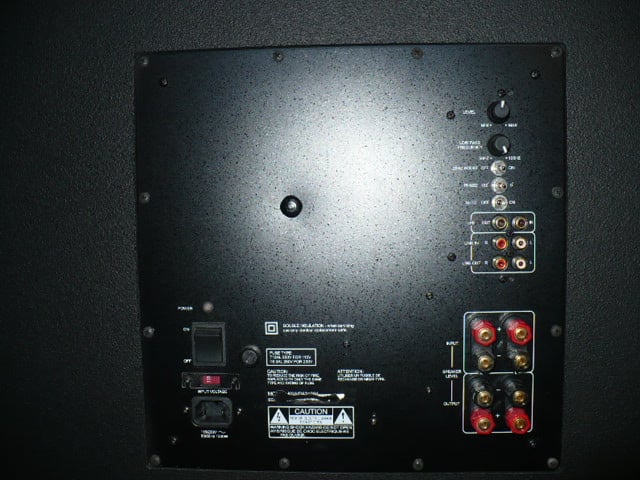
 Both the LT/550 and the LT/1300 amplifiers offer the requisite
continuous variable output level adjustment and low pass crossover, but for
some reason, the base LT/550 seems to provide a continuously variable phase
adjustment between 0 and 180 degrees, according to eD
Both the LT/550 and the LT/1300 amplifiers offer the requisite
continuous variable output level adjustment and low pass crossover, but for
some reason, the base LT/550 seems to provide a continuously variable phase
adjustment between 0 and 180 degrees, according to eD 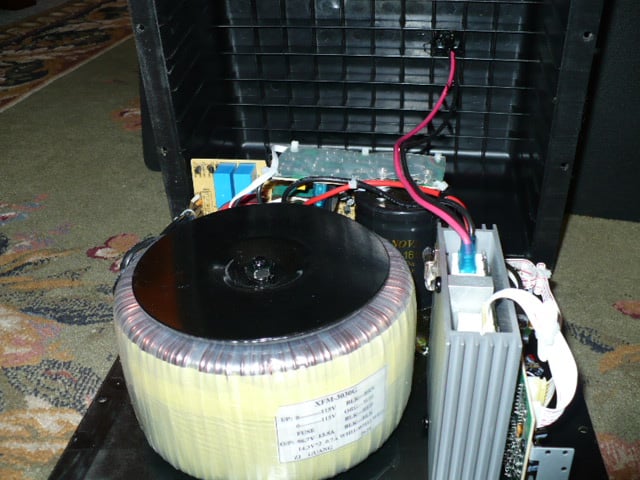 literature, while the
upgrade LT/1300 has a basic 0/180 degree toggle switch. The internal crossover
system for signal input is adjustable from 50 to 100 Hz, but I was unable to
find the crossover slope listed in eD literature for the A7S-450. The LT/1300 amplifier upgrade includes a
toggle to kick in a 25 Hz boost of unspecified magnitude. Both amplifiers feature an automatic on/off
function switch for power. The
amplifiers have speaker level, binding post input/outputs and stereo line level
input/outputs with a separate mono LFE input/output in lieu of a crossover
bypass switch. Power to the A7S-450
amplifier is provided through a detachable power chord and controlled by a
rocker switch with a user selectable 115/230 voltage switch located between the
two.
literature, while the
upgrade LT/1300 has a basic 0/180 degree toggle switch. The internal crossover
system for signal input is adjustable from 50 to 100 Hz, but I was unable to
find the crossover slope listed in eD literature for the A7S-450. The LT/1300 amplifier upgrade includes a
toggle to kick in a 25 Hz boost of unspecified magnitude. Both amplifiers feature an automatic on/off
function switch for power. The
amplifiers have speaker level, binding post input/outputs and stereo line level
input/outputs with a separate mono LFE input/output in lieu of a crossover
bypass switch. Power to the A7S-450
amplifier is provided through a detachable power chord and controlled by a
rocker switch with a user selectable 115/230 voltage switch located between the
two.
According to eD, the A7S-450 subwoofers use a driver design based on the
190v.2 car audio subwoofer driver. How
close the A7S-450 driver is to the 190v.2 is not entirely clear, if it is the
same driver put into a home application or if it is in fact actually modified
for home use in some way, but the eD website has quite a bit of useful
technical details on the car version of the driver. Thiele Small 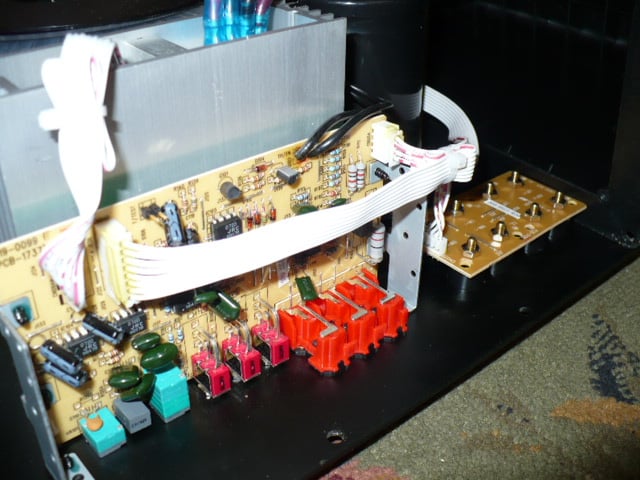 Parameters are provided for the
190v.2 along with a cross section of the driver including dimensions, various
recommended enclosure sizes for sealed and vented configurations at different
tunings, and even blue prints for those enclosures. With this information, playing with the
190v.2 can be as much fun for the do it your self home audio types as for the
car audio types.
Parameters are provided for the
190v.2 along with a cross section of the driver including dimensions, various
recommended enclosure sizes for sealed and vented configurations at different
tunings, and even blue prints for those enclosures. With this information, playing with the
190v.2 can be as much fun for the do it your self home audio types as for the
car audio types.
The total weight of the 190v.2 driver is listed as 42 lbs, nearly one third of the total system weight. The driver design is claimed to allow a linear cone displacement of +/-0.85 inches, generating a volumetric displacement of 0.10 cubic feet of air.
 The 190v.2 driver includes a number of beneficial design features and
methods that eD discusses in the literature.
According to eD, while the 190v.2 driver is said to be optimized for use
in small enclosures, it is said to also perform well in infinite baffle
configurations. Individual driver
component designs are evaluated using Finite Element Analysis methods by eD to
maximize driver linearity. The
suspension is designed to maximize linear displacement, featuring a specialized
surround design said to increase effective piston area and a spider design with
the center of mass pushed forward that eD claims increases efficiency and
linearity. The cone is constructed from
a seamless 2 piece poly design and the connection of the cone to the spider and
voice coil based on a proprietary assembly method, Zero Triple Joint Construction
that is said to eliminate problems associated with true triple joint
construction in high excursion drivers.
Ventilation is integrated into the cone system to force air into the
voice coil, reducing distortion and improving power handling. According to eD, the motor structure is said
to benefit from a proprietary Co-Linear design which eD claims effectively increases the magnetic field (B) in the gap by using a tighter gap tolerance. This allows them to use a smaller
diameter motor while retaining a high B. (IE. Get better small box performance
with the same mass).
The 190v.2 driver includes a number of beneficial design features and
methods that eD discusses in the literature.
According to eD, while the 190v.2 driver is said to be optimized for use
in small enclosures, it is said to also perform well in infinite baffle
configurations. Individual driver
component designs are evaluated using Finite Element Analysis methods by eD to
maximize driver linearity. The
suspension is designed to maximize linear displacement, featuring a specialized
surround design said to increase effective piston area and a spider design with
the center of mass pushed forward that eD claims increases efficiency and
linearity. The cone is constructed from
a seamless 2 piece poly design and the connection of the cone to the spider and
voice coil based on a proprietary assembly method, Zero Triple Joint Construction
that is said to eliminate problems associated with true triple joint
construction in high excursion drivers.
Ventilation is integrated into the cone system to force air into the
voice coil, reducing distortion and improving power handling. According to eD, the motor structure is said
to benefit from a proprietary Co-Linear design which eD claims effectively increases the magnetic field (B) in the gap by using a tighter gap tolerance. This allows them to use a smaller
diameter motor while retaining a high B. (IE. Get better small box performance
with the same mass).
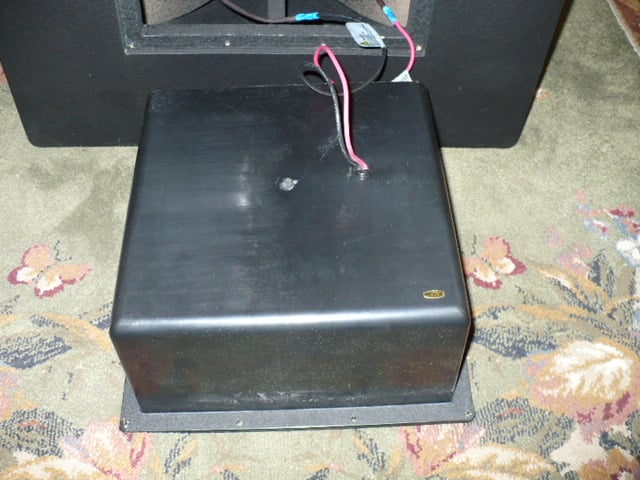
Accessories included with the A7S-450 are the detachable power cord and high quality machined metal carpet spikes for floor support. The spikes are solid metal and of good quality. For floor placement on surfaces other than carpeting, the carpet spikes can be used with the four small metal feet. The feet have rubber pads on the bottom and a davit on the top to accept the spikes. Compared to the spikes and considering the weight of the subwoofer, the metal for these feet seems rather thin to accept the stress concentrations from the spikes with out distortion and the thin rubber pads seem likely to compress to the point that the down turned metal lip on the feet could dig into the flooring below. So, use them with caution.
 To have a look inside the A7S-450, I removed the plate amplifier, which
is mounted to the cabinet by 12 wood screws.
Once inside, I found the cabinet constructed of heavier 1” MDF panels
rather than the more common and flimsy ¾”.
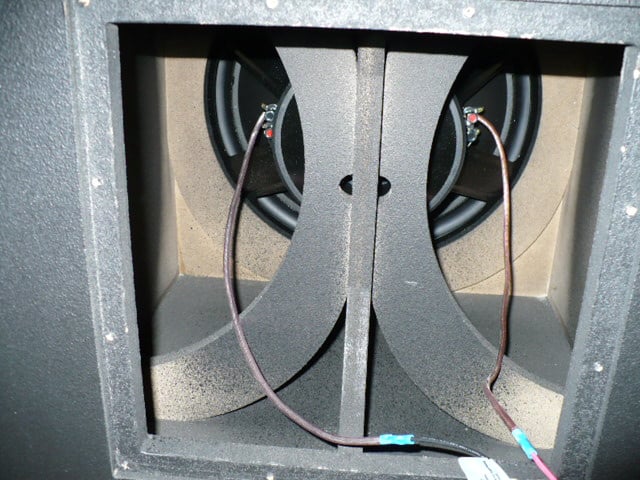
Internal bracing for the relatively large cabinet is in the form of an
hourglass shaped, bi-directional column mounted to the top and bottom
panels. The two pairs of outward facing
c sections used for bracing are only attached to the cabinet at the center of
the edge at the top and bottom panels and side panels. This provides minimal reduction to the actual
panel spans required for stiffening. So,
while it is impressive looking, it is not the most effective configuration,
structurally.
To have a look inside the A7S-450, I removed the plate amplifier, which
is mounted to the cabinet by 12 wood screws.
Once inside, I found the cabinet constructed of heavier 1” MDF panels
rather than the more common and flimsy ¾”.
Internal bracing for the relatively large cabinet is in the form of an
hourglass shaped, bi-directional column mounted to the top and bottom
panels. The two pairs of outward facing
c sections used for bracing are only attached to the cabinet at the center of
the edge at the top and bottom panels and side panels. This provides minimal reduction to the actual
panel spans required for stiffening. So,
while it is impressive looking, it is not the most effective configuration,
structurally.
Editorial Note about Cabinet Material
Elemental Designs informed us that they have recently moved away from using MDF for their cabinets and now use a material called EFS. EFS is a higher density wood and a little more eco-friendly. Score one for the environment to eD!
For more information about this, visit: http://www.edesignaudio.com/elementaldesigns_efs.php
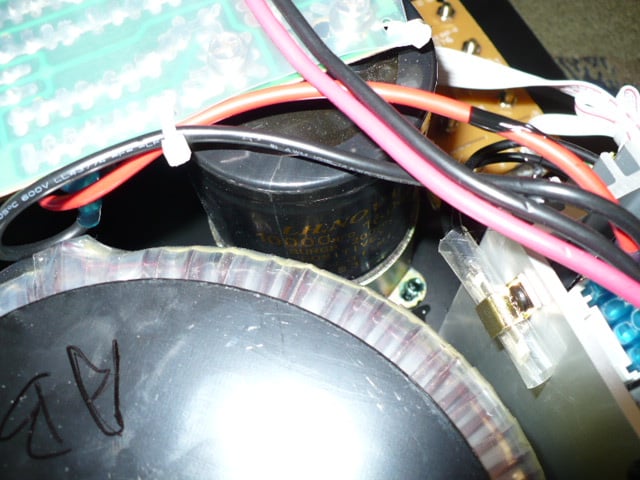
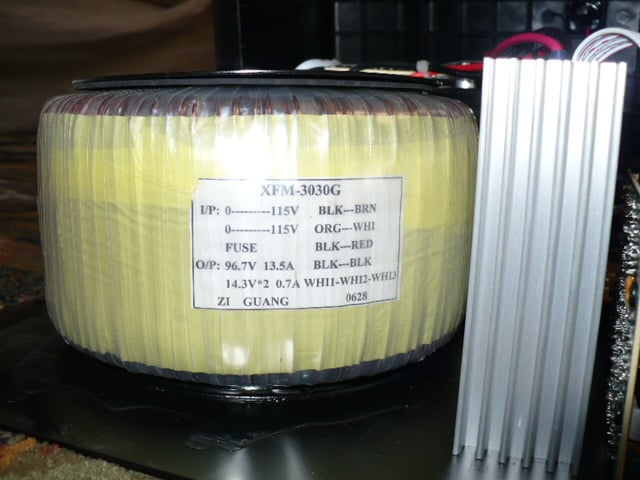
The amplifier is housed in plastic case, which is mounted to the inside of the back plate by four machine screws. Once detached, I found a massive 6½” diameter by 3½” tall toroidal power transformer. Calculated from output amperages and voltages listed on the side of the transformer, I get about a 1.325kVA rating for the transformer. Transformer power output is supplemented by a capacitor rated for 10000 mF at 160 VDC. The rated power consumption listed on the back plate for the amplifier is 1200W at 115V with a T12AL 250V fuse at 115V power input for overload protection.
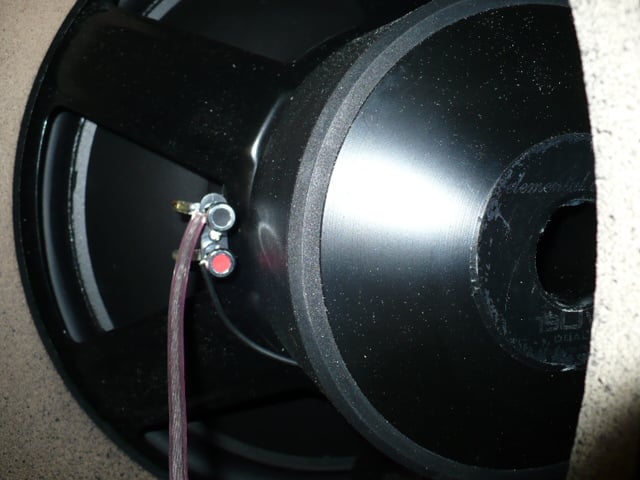
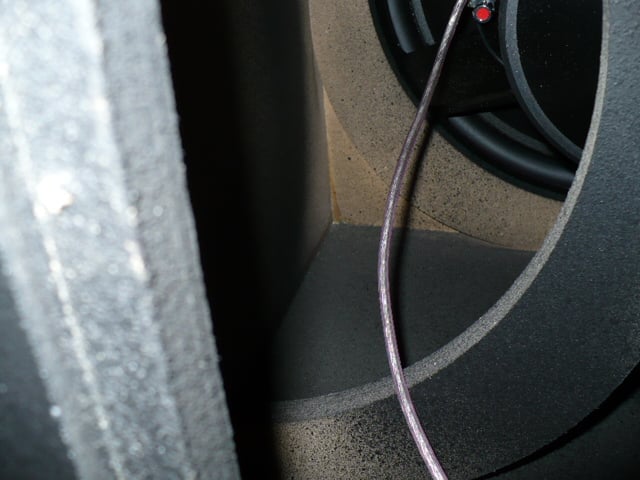
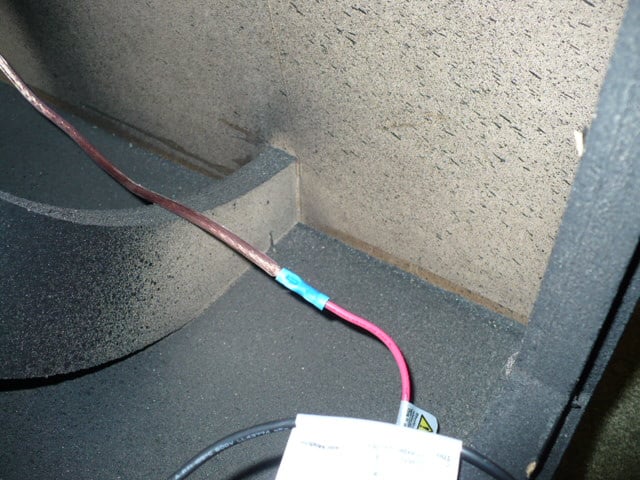
As for the driver (190v.2), it sports a sizable motor structure, with a magnet measuring at approximately 7.5" in diameter with a 10MM pole bump and utilizing two 25MM Y30 ferrite rings. The car origins of the driver are evident in the use of spring loaded wire terminals that are common in aftermarket car speakers. There are two pairs of wire terminals located at opposite sides of the driver, apparently to allow bi-amplification for car usage. The driver is wired from the positive terminal on one side to the negative terminal at the opposite side using 14 AWG wiring out from the amplifier and the demarcation between the outsourced amplifier and the eD driver components are as clear as the wire splice between them.
A7S-450 System Setup
Setup began with opening the box and carefully rolling it
over to lift it off the subwoofer. With
a sub this size, don’t get some silly idea to try and lift it out of the box,
the geometric reality is that the typical size of the human body does not
provide the leverage to bend over a box this large and then lift a beast like
this out. Oversized, chest beating
contrarians may balk at my statements, but don’t complain to me of injured
backs, broken bones, damaged subwoofers, or collapsed floors if my advice is
not heeded.
I then rolled the sub upright onto furniture sliders, maneuvered it into place, and left it on the sliders. Carpet spikes be damned, this thing isn’t going to move significantly from the force generated by the reaction of mere acoustic emissions.
From this point on, everything is mostly subwoofer standard. Select an acoustically acceptable location: crawl for bass, take measurements, or play-it-by-ear, whatever suits your fancy, and then dial in the appropriate settings. With the A7S-450 used for an LFE channel, the correct signal input must be wired into the system for the crossover bypass and the crossover frequency is then set using preamp/receiver bass management functions. If the subwoofer is being used without bass management, dial in an appropriate frequency based on the roll off point for the accompanying main channels. Next, using a full range source signal, adjust the phase to the setting that produces the best integration with the main speakers which usually corresponds to the setting that yields the higher and steadier SPL output via a frequency sweep. Finally, manually adjust the volume level to balance the overall system frequency response and then use the processor functions for speaker setup to tweak the final output setting, either by ear or with an SPL meter or any other available measurement device.
The only difficulty that I found using the A7S-450 is that it kicked a 15 ampere circuit every time I turned it on. Untamed inrush current draw sucked all 15 amps out of the wall consistently without fail. The process of powering up the subwoofer typically involved at least one trip into the basement to reset the breaker as the capacitor took on power. The circuit kicked even when completely unloaded with every other electrical device on the circuit turned off, both from a fresh power up as well as when coming out of standby mode. As such, I am not sure that even a 20 amp circuit will slake the A7S-450 of its initial thirst.
For me, the current situation is temporary; my system will ultimately end up on a 20 amp circuit, but until then and for anyone who does not have a 20 amp circuit available, it will be a problem, especially for older fuse protected circuits. Considering I normally run the more powerful Fathoms from this circuit without issue, I consider the inrush current problem to be an oversight in the design of the amplifier. JL Audio makes a point of discussing current draw for home audio applications and specifically outlines their efforts to mitigate the problem as part of the amplifier design. It would appear that eD has some homework to do to correct this problem.
Equipment Used
I evaluated the A7S-450 subwoofer using my A/V setup with HD-DVD, DVD, and CD content reproduced using a Toshiba HD-A35 and a Sony PS3 for Blu-ray content. Audio processing and power amplification was provided for using a Rotel RSX-1067 driving a 7 channel Infinity Beta speaker array with bass management set at an 80 Hz crossover point. All source material used for the review was reproduced in its native format, multi-channel or stereo, with the Rotel set to two channel mode for stereo material and the Beta 40 towers engaged to reproduce the mid and upper frequencies.
Normally I prefer being provided two subwoofers for review as it is easier to minimize certain room acoustics issues directly, but for this review, I was sent a single unit. The advantage of multiple subwoofers is that they can be used to help limit modal coupling of bass frequencies to the room through judicious placement of the subs relative to the room, each other, and the listening position. I typically run dual subwoofers and shifting to a single sub presents an extra difficulty to sort out what is really coming from the sub and not from the room acoustics, which is best avoided if possible.
Editorial Note on Multiple Subwoofers
Multiple subwoofers are a good choice to smooth frequency response by minimizing room modal behavior through cancellation. Strategic placement of the subs at opposing nodal points for frequencies that trouble the listening area can be used to nullify the worst dips and peaks from the room modes. This is a distinct advantage over equalization, which can only trim peaks but not fill dips.
My own experience with running multiple subs has been a stark improvement with smoother frequency response, improved bass detail, and increased depth at the bottom end beyond what a single well placed sub can muster.
I am including several links where this topic is discussed in greater detail and also an Excel based spread sheet that calculates modes for a rectangular room:
As usual, I put my test specimen through a wide range of movie and musical content with some of the highlights detailed below. Overall, I found the A7S-450 to be a highly capable subwoofer, able to generate prodigious output. Despite its rather large size, it was a surprisingly subtle subwoofer. The brute didn’t stumble all over the musical details, bull in a china shop fashion, when reproducing more sublime bass content and it also kept enough composure to render musical subtleties even when more demanding LFE was also present. The subtle playback capabilities allowed the fairly large A7S-450 to disappear, sonically, into my system very effectively; it played deeply, loudly, and transparently, blending into my system extremely well.
Comparison of Subwoofers
I’ve recently had my hands on a number of subs in this price category, between $800-$900, that pushed a kilowatt or more output. Both the Sunfire HRS-12 and the Chrysalis Acoustics Photon-8 can be considered direct competitors at the price and comparable power specifications.
The A7S-450 bested both in terms of absolute performance as a subwoofer providing the greatest acoustic output capabilities and the least colored sonic signature. The tighter acoustic performance helped the A7S-450 to be the most sonically invisible of this group of subs and presenting the best sonic integration into my system. This is not to say that the other subwoofers are inferior in any way. The performance of these subs simply represents different engineering tradeoffs.
The A7S-450 is the least subtle design, sheer size gives it the upper hand against the HRS-12, and the extra 300 watts don’t hurt either, but it’s a close race and the considerably smaller sub still puts up some stiff competition for the much larger A7S. Appearance considerations will give the Sunfire sub the clear upper hand, as it will at least look decent with more upscale décor, having a much nicer pseudo-piano gloss finish.
The Photon-8 on the other hand represents the complete opposite design philosophy, and while the A7S can handily outdo the little guy in an absolute sense, the Photon-8 is an extremely impressive subwoofer after taking into account its very diminutive size. Some people may not want a sub as big as the A7S or simply do not have the room. The Phototn-8 is easily tucked away and it will still impress friends with a very convincing imitation of being a much larger sub than it is.
As for higher end competition, the A7S will not best subs of the caliber of the Fathoms, either in terms of output or in terms of musical accuracy. To my surprise, considering her relative apathy to my audio preoccupations, even my wife could tell the difference and preferred the Fathoms. But the difference should be tempered by considering the effect of diminishing returns for subs like the Fathoms: the $860 spent on the A7S will get one a disproportionate fraction of the Fathoms performance for the price.
The moral of the story is that every design has its pros and cons and there is a variety of competently designed subs available to satisfy different needs, preferences, and priorities. Everyone should temper the selection process with actual product auditions before making a purchase.
Overall, the A7S-450 is a good subwoofer, and excellent for the asking price, if the size is not an issue.
A7S-450 Listening Tests
Blu-ray: The Mummy – The Tomb of the Dragon Emperor To work out this big boy with some LFE, I turned to this
special effects laden recent addition to the Mummy franchise. Opinions of the film itself aside, it does
have what it takes to fit the bill of blockbuster popcorn fare that will put
the low end of a sound system to the test.
The most extreme sound effects proved to be no issue for the A7S-450. And angry Yeti are cool.
To work out this big boy with some LFE, I turned to this
special effects laden recent addition to the Mummy franchise. Opinions of the film itself aside, it does
have what it takes to fit the bill of blockbuster popcorn fare that will put
the low end of a sound system to the test.
The most extreme sound effects proved to be no issue for the A7S-450. And angry Yeti are cool.
The A7S-450 performed well throughout the film. Intense sound effects were given plenty of support and the A7S-450 never showed any signs of giving out at very respectable volume levels. On the flip side of the mayhem, the A7S-450 was appropriately delicate and articulate with subtle deep sound effects and with the orchestral score. When asked to provide both of these extremes simultaneously, the sub did a fine job of blasting out explosions, collapses, and battle without losing the composure to render the delicate bits with finesse.
Right from the start, the Universal intro is delivered with solid, deep rumble segueing into the back story of ancient battles that were presented with solidity and sustained depth through the A7S-450. The musical score was rendered with an articulate bottom end and clean percussion. Thousands of years later, as the tomb is opened, dynamite and the crashing of traps were potent through the sub, while the low rumble of accidentally activated mechanisms working in the background came though quietly but distinctly. Percussion and the bottom of the score were again rendered with articulation and good timbral character by the A7S-450. I found the Chinese New Year fireworks were taut and realistic through the A7S-450 while the big band double bass at Imhotep’s was rendered delicate and light. The awakening showed off the A7S-450’s subtle side again, supporting ominous orchestral depth and the quite but distinct deep percussion while rendering hall ambience. The tactile throb of airplane engines over the Himalayas was developed enough by the A7S-450 to support the illusion of being on the plane, avalanches and cave collapses were most impressive, and the wing flaps of the two headed dragon all but gusted air around the room. As the final battle gears up, collapsing tombs, marching terra cotta armies, the sounds of battle, and raging of beasts get solid rumble and thump from the A7S-450. The score, with trombone petal tones and surging low brass, came through cleanly behind the demanding sound effects. All of this leading to the final confrontation with the mummy in a hidden chamber within the Great Wall where ancient mechanisms came through with a low, deep rumble. The closing score cycles through multiple sections showing off the subs prowess with musical content with resonant string passages, surging low brass, and percussion all of which came through with subtle bass detail and depth fully intact
CD: Mick Karn: The Tooth Mother
Fretless bass
and clarinet player Mick Karn, like former Japan
band mates David Sylvian and Richard Barbiari, embarked on a solo career
trajectory based on creativity and experiment well outside mainstream musical
tastes after the dissolution of the aforementioned Japan. With his unmistakably distinct playing style
and virtuoso technique on the bass guitar and his skills with various woodwind
instruments, Mick fuses experimental rock, funk, and jazz into a Middle Eastern
idiom that defies easy categorization on The Tooth Mother. Supported by a wide range of musicians,
including the likes of guitarist David Torn and former band mate Richard
Barbiari who, along with drummer Gavin Harrison and guitarist Steve Wilson,
would ultimately form three quarters of Porcupine Tree, the album is quite
simply unique.
Karn’s bass sound can be best described as fat but agile; it is a very full sound that is simultaneously nuanced and articulate, and the eD A7S-450 did a fine job rendering these qualities in the performance. Arrangements full of bass guitar chords, elaborate percussion, low woodwinds, and low synthesizers provide a lot of sonic complexity for a sub to work through, and throughout, the A7S-450 remained relaxed sounding and detailed at volume. Song after demanding song, the sub had enough punch and substance to fully flesh out Mick’s meaty bass guitar sound. It was quick and delicate enough to render all of the musical subtleties dynamically without bowling over them. I found that the eD A7S-450 kept all of the sonic layers In the low frequency range cleanly separated, and it did this with seamless voicing integration to the mains.
From the opening of the album with Thundergirl Mutation, Karn’s bass playing was solid and immediate through the A7S-450 without sacrificing musical nuance or getting bogged down in all of the layers. Opening with bass clarinet with well realized timbre, Plaster the Magic Tongue was rendered with a resonant bottom end, rich in quality and detail by the A7S-450. Bass guitar gymnastics were sonically seamless as Karn jumped from low to high register with all of the details of the performance captured. The A7S-450 did an excellent job keeping the layered bass arrangement during Lodge of Skins separated. Percussion was tight while the layered bass guitar, low winds, and synthesizers were all clearly discernable through the lushness. Ethnic percussion featured in Gossip’s Cup and Feta Funk came through the A7S-450 with depth, punch, and realistic timbre. The bass playing benefited from the sub’s ability to keep up with transients and dynamics while keeping the unique fullness inherent to Karn’s sound, cleanly rendering layers of bass guitar chords, low winds, synthesizers, and percussion. The A7S-450 again did a fine job with the timbre and transients of ethnic percussion during The Tooth Mother. Bass guitar was seamless through the crossover point as Karn moved up and down the finger board with no hint of voicing change between the mains and the sub. Towards the middle, deep electronic bass transients pop in and out of the arrangement, which the A7S-450 did a fine job in portraying. Bass guitar and drum parts during Little, Less Hope were tight and clean through the A7S-450, which had no trouble developing a resonant bottom end that rumbled the room. The album closes with There Was Not Anything But Nothing, which brings the winds to the forefront over the bass guitar playing. With a rich arrangement and a chord structure that shifts through harmonic changes, the A7S-450 kept everything going on at the bottom distinct. Bass clarinet had a realistic timbral character and remained distinct from tenor saxophone, synthesized bass, and bass guitar as chord structures were then piece by piece constructed on top.
A7S-450 Measurements and Analysis
Measurements were performed using the Sample Champion program developed by Paolo Guidorzi of Purebits. The program is a Maximum Length Sequence (MLS) program that generates an impulse response in the time domain from this pseudorandom signal. Fast Fourier Transformation is applied to the impulse response to generate the system frequency response. The operating principle is the same as that of the well known MLSSA program.
Test samples were taken using 16 bit resolution with a 48 kHz sampling frequency. Fast Fourier Transformations were performed at 64K allowing for a frequency resolution of .73 Hz, which is more refined than even 1/24th
octave resolution at the lowest octave; the A0 key on the piano has a fundamental frequency of 27.5 Hz.
All measurements of the driver were taken nearfield at the approximate acoustic center of the driver and referenced to a simultaneous, independent SPL measurement taken at 1 meter from the subwoofer. For these measurements, the low pass filter and the 25Hz bass boost were defeated.
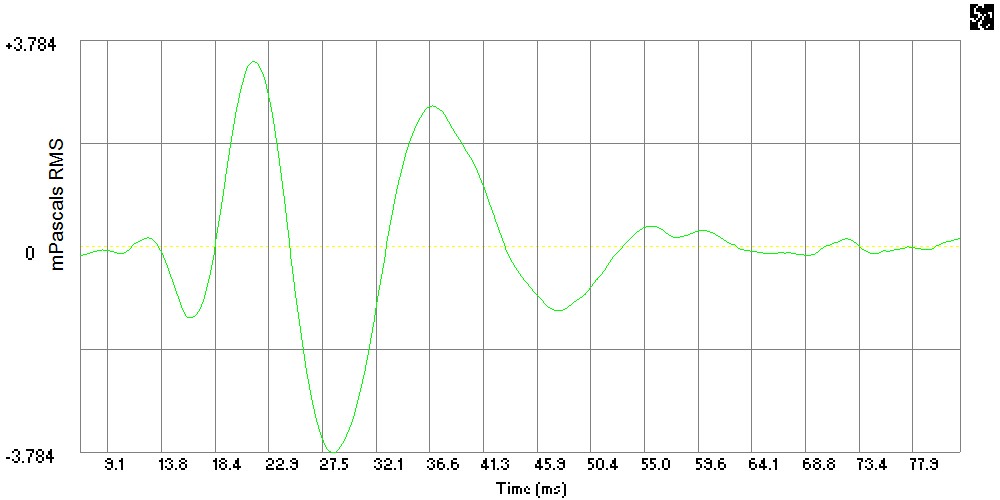
Figure 1: Nearfield Impulse Response
Figure 1 shows the impulse response of the A7S-450 subwoofer measured nearfield at an SPL of 80 dB at 1 meter. This fairly typical response curve for a bass driver shows the A7S-450 damping out the impulse input quickly within two cycles of free vibration.
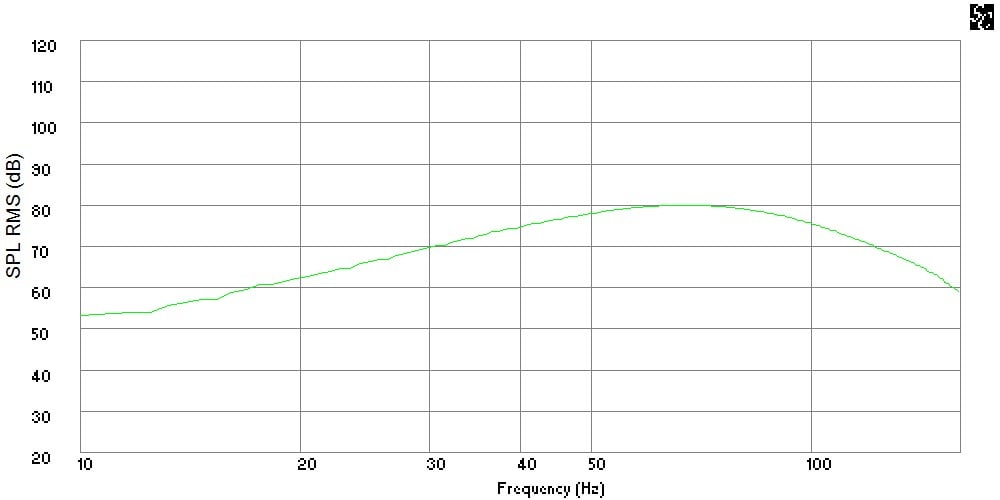
Figure 2: Nearfield Frequency Response
Figure 2 shows the nearfield frequency response of the A7S-450 at an SPL of 80 dB at 1 meter. The frequency response curve shows peak output at approximately 60 Hz with tapering of output below 50 Hz at approximately 12 dB/octave. No inflection point indicating significant roll off to the bass response occurs in the subwoofer’s response, which has a smooth roll off to 10 Hz. The specified 22 Hz appears to be dependent on the presence of either room boundary effects or utilization of the 25 Hz bass boost and perhaps a combination of both.
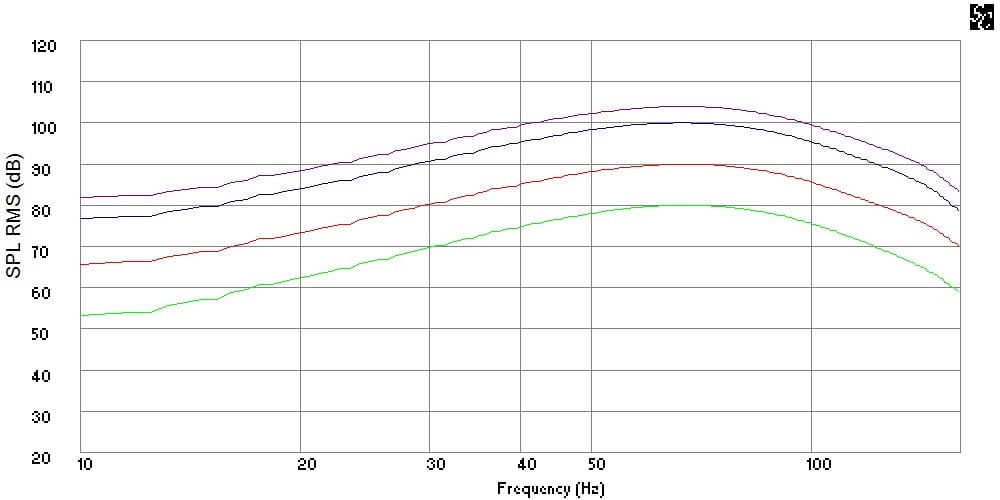
Figure 3: Nearfield Frequency Response at Various SPL
The curves in Figure 3 are overlays of the nearfield frequency response of the A7S-450 measured at various SPL. The green curve was measured at a peak SPL of 80 dB at 1 meter with the red curve at 90 dB, the blue curve at 100 dB SPL, and the purple curve at 104 dB, all measured at 1 meter from the subwoofer.
From the identical shape to the plotted curves at various SPL, it is clear that the sub had more to give before suffering the ill effects of compression even if my computer soundcard did not. Based on my experience with the sub, I would anticipate at least 3-5 dB more output is possible from the A7S-450 without any significant sonic troubles.
A7S-450 Conclusion and Recommendations
 The A7S-450 is a lot of subwoofer for the money. Pound for pound, few manufactures give a
customer more for $800 or so, and best of all, it is not a quantity verses
quality tradeoff. It performs well,
blatting out a lot of deep bass, but not at the expense of musical nuance and
subtlety. Coupled with the optional $85
parametric equalizer that eD offers, a forthcoming supplement to this review,
the A7S-450 provides a lot of potential to build an excellent mid-priced home
theater system.
The A7S-450 is a lot of subwoofer for the money. Pound for pound, few manufactures give a
customer more for $800 or so, and best of all, it is not a quantity verses
quality tradeoff. It performs well,
blatting out a lot of deep bass, but not at the expense of musical nuance and
subtlety. Coupled with the optional $85
parametric equalizer that eD offers, a forthcoming supplement to this review,
the A7S-450 provides a lot of potential to build an excellent mid-priced home
theater system.
The A7S-450 coupled with the LT/1300 amplifier option is fully capable of shaking a room in a meaningful way. And contrary to its considerable size, it is also fully capable of disappearing, sonically, blending well in a properly calibrated and tuned system, handling quiet bottom end detail, and belting it out when called upon without giving it position away. That is unless you look at it; then the A7S-450 is hard to miss.
While I do not personally know how well the LT/550 option performs, it seems to me to be a very obvious decision to spend the extra $85 for the LT/1300 amplifier upgrade that will more than double the headroom. At least that is how I roll.
So the recommendation: if the room to board this beast is
available and the wife won’t kill you for bringing it home, it is definitely a
worthy subwoofer to consider at anywhere near its price point. As for those who know the wife will very
likely kill them for buying it but like to live dangerously, well, more power
to ‘em.
Elemental Designs A7S-450 Powered Subwoofer
$775-860
MSRP
Elemental Designs
1618 N. 15th
Ave. E
Newton,
IA 50208
(641)
792-2501
http://www.elementaldesigns.com
The Score Card
The scoring below is based on each piece of equipment doing the duty it is designed for. The numbers are weighed heavily with respect to the individual cost of each unit, thus giving a rating roughly equal to:
Performance × Price Factor/Value = Rating
Audioholics.com note: The ratings indicated below are based on subjective listening and objective testing of the product in question. The rating scale is based on performance/value ratio. If you notice better performing products in future reviews that have lower numbers in certain areas, be aware that the value factor is most likely the culprit. Other Audioholics reviewers may rate products solely based on performance, and each reviewer has his/her own system for ratings.
Audioholics Rating Scale
 — Excellent
- — Very Good
- — Good
- — Fair
- — Poor
| Metric | Rating |
|---|---|
| Bass Extension | |
| Bass Accuracy | |
| Build Quality | |
| Fit and Finish | |
| Ergonomics & Usability | |
| Features | |
| Performance | |
| Value |
Professionally, David engineers building structures. He is also a musician and audio enthusiast. David gives his perspective about loudspeakers and complex audio topics from his mechanical engineering and HAA Certified Level I training.
View full profile