
RBH Sound WM-24, WM-30, FM-45 M Series Loudspeaker System Review
- Product Name: RBH Sound WM-24, WM-30, FM-45 M Series Loudspeaker System
- Manufacturer: RBH Sound
- Performance Rating:


- Value Rating:
- Review Date: July 16, 2007 20:00
- MSRP: $999/pair (WM-24); $1,199pair (WM-30); $1999/pair (FM-45)
RBH Sound WM-24 & WM-30
Primary Use: On-wall
LCR
System Type: 2-way,
Sealed
Frequency Response: 50Hz — 20kHz ± 3dB (WM-24)
47Hz — 20kHz ± 3dB (WM-30)
Sensitivity: 90dB
(2.83 Volts @ 1 Meter)
Recommended Power:
75-120 Watts
Drive Units: (2) 4”
active aluminum cone woofers;
(2) 4” passive aluminum
cone woofers;
(1) 1” silk dome tweeter
Crossover Frequency:
3000 Hz
Crossover Slope:
12dB/Octave
Nominal Impedance: 6
Ohms
Color: Hairline
brushed black or brushed aluminum
Grille: Black or
silver cloth
Video Shielding: No
Dimensions: 7
1/8” W x 24” H x 3 3/4” D (WM-24)
7 1/8” W x 30” H x 3
3/4” D (WM-30)
Weight: 9.5 Lbs./unit (WM-24)
11.0 Lbs./unit (WM-30)
Warranty: 5 Years
RBH Sound FM-45
Primary Use: Floor
standing
System Type: 3-way,
Vented
Frequency Response:
40Hz — 20kHz ± 3dB
Sensitivity: 89dB
(2.83 Volts @ 1 Meter)
Recommended Power:
75-250 Watts
Drive Units: (2) 8” active aluminum cone woofers;
(2) 4” active aluminum cone midrange drivers;
(1) 1” silk dome tweeter
Crossover Frequency:
100 Hz, 3000 Hz
Crossover Slope:
Asymmetrical 6-18dB/Octave
Nominal Impedance: 8
Ohms
Color: Brushed
aluminum/Black
Grille: Black or
silver cloth
Video Shielding: No
Dimensions: 7 1/8”
W x 45” H x 16 1/4” D
Weight: 42.0
Lbs./unit
Warranty: 5 Years
Pros
- Very stable imaging
- Truly timber matched design
- Well constructed
- FM-45 is biampable
Cons
- Limited choice of finishes
- WM-24 & WM-30: Banana plugs difficult to access
Introduction
RBH Sound is a name familiar to all of us here at Audioholics. Reviews, forums and staff reference systems – it’s a company whose products we see again and again in these pages. I’d not heard for myself any of their offerings before having the sample WM-24, WM-30 & FM-45s delivered to my door and was curious to see what it was about the RBH sound that so often curried so much favorable attention in this corner of the Internet.
First Impressions
 Right out of the box, its no-brainer obvious the WM-24s and WM-30 are
on-wall speakers well suited for pairing up with flat panel displays (FPD).
Whether you’re upgrading the factory installed speakers your FPD arrived with
(and what genuine audioholic hasn’t thought about it at one time or another) or
perhaps piecing together a surround sound system and prefer wall mount to floor
standing, the WMs are tailor-made for the job. Though both the WM-24s and
WM-30s can be used stand-mount, they come with wall mount hardware and an
excellent template that’ll aid in making the install a trouble-free process.
Right out of the box, its no-brainer obvious the WM-24s and WM-30 are
on-wall speakers well suited for pairing up with flat panel displays (FPD).
Whether you’re upgrading the factory installed speakers your FPD arrived with
(and what genuine audioholic hasn’t thought about it at one time or another) or
perhaps piecing together a surround sound system and prefer wall mount to floor
standing, the WMs are tailor-made for the job. Though both the WM-24s and
WM-30s can be used stand-mount, they come with wall mount hardware and an
excellent template that’ll aid in making the install a trouble-free process.
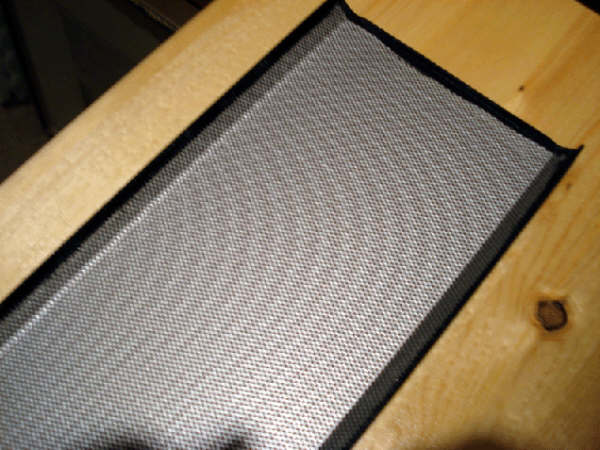 It’s also obvious, right out of the box, the WM-24s, WM-30 and the
FM-45s are well built, sturdy products. For example, pry off a front grill
cover and you’ll discover it’s made of perforated metal stock covered by a
thin, stretchable fabric. The latter is a particularly clever design feature in
that the material can absorb the occasional snag and snap right back into
place. Easy to clean, too.
It’s also obvious, right out of the box, the WM-24s, WM-30 and the
FM-45s are well built, sturdy products. For example, pry off a front grill
cover and you’ll discover it’s made of perforated metal stock covered by a
thin, stretchable fabric. The latter is a particularly clever design feature in
that the material can absorb the occasional snag and snap right back into
place. Easy to clean, too.
Setup
Wall mount speakers necessarily require the extra effort, come setup time, of installing the hardware on the wall to which the speakers are to be affixed. So there’s going to be a bit more initial time & effort investment required than that needed when dealing with floor standing or stand mount speakers.
Installing the mounting hardware can be a tricky challenge and success demands careful attention to the details. (This holds especially true when dealing with masonry). On the other hand, if it’s to be a DIY job you’re likely in the fortunate position of having available a variety of placement options to explore prior to bolting the things permanently in place. Similar to floor standing or stand-mount speakers, it often happens the final location is nevertheless a compromise between sonics and aesthetics. Taking the time to explore or rather audition the sonic merits of different locations is recommended.
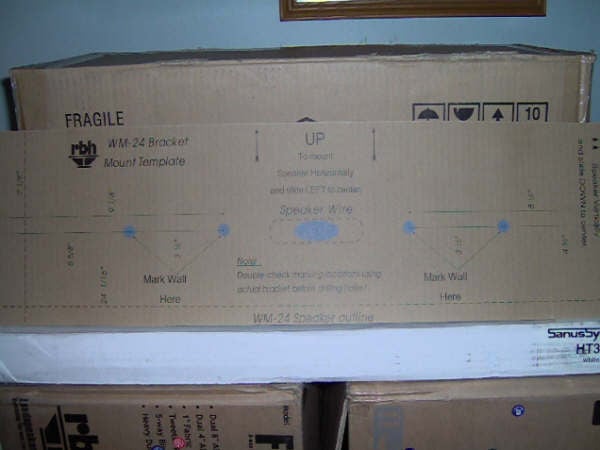
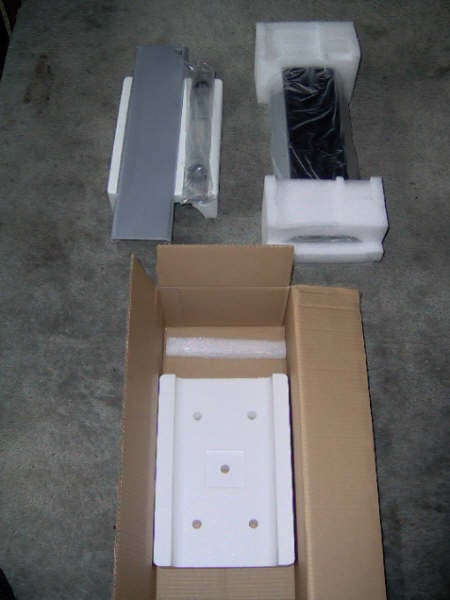 The WM-24s and WM-30 were exceptionally well
packaged, with both the products entirely encased within the shipping carton by
the packing material. The quality of the packaging design is a key detail.
After all, no matter how good the speaker, if it arrives
busted up, its useless and now you have to deal with the delays and potentially
hassle-rich process of returning the item to the manufacturer.
The WM-24s and WM-30 were exceptionally well
packaged, with both the products entirely encased within the shipping carton by
the packing material. The quality of the packaging design is a key detail.
After all, no matter how good the speaker, if it arrives
busted up, its useless and now you have to deal with the delays and potentially
hassle-rich process of returning the item to the manufacturer.
Both the WM-24s and WM-30s shipped with a manual, mounting hardware and a second grill cover and mounting template. The template is well diagrammed & annotated and is well worth holding onto should you need to move the speakers at some point in the future.
The FM-45s were packed likewise, with the system base & tower segments of the speakers well isolated from the carton walls. The system shipped with the usual accessories (manual, etc). Laying the cartons out flat before opening them is recommended; you don’t want to find out after opening them in the upright position that an FM-45 is upside down and about to topple out on your feet.
 Once out of
their shipping cartons, positioning the FM-45s was fairly straightforward,
having previously identified the general preferred location by walking the
room. “Walking the room” entails having an assistant, whose voice you’re
familiar with, walk the room reading from a textbook. Sitting in the main
listening position and listening to the tonal changes that occur in the voice
as the assistant walks the room will help locate appropriate locations for the
speakers. Once placed, some positional fine tuning will likely be needed. After
that, time to listen!
Once out of
their shipping cartons, positioning the FM-45s was fairly straightforward,
having previously identified the general preferred location by walking the
room. “Walking the room” entails having an assistant, whose voice you’re
familiar with, walk the room reading from a textbook. Sitting in the main
listening position and listening to the tonal changes that occur in the voice
as the assistant walks the room will help locate appropriate locations for the
speakers. Once placed, some positional fine tuning will likely be needed. After
that, time to listen!
The WM-24s replaced the original speakers supplied with my FPD (Plasma, 42” diagonal) and the WM-30 was positioned (and used) as a center channel
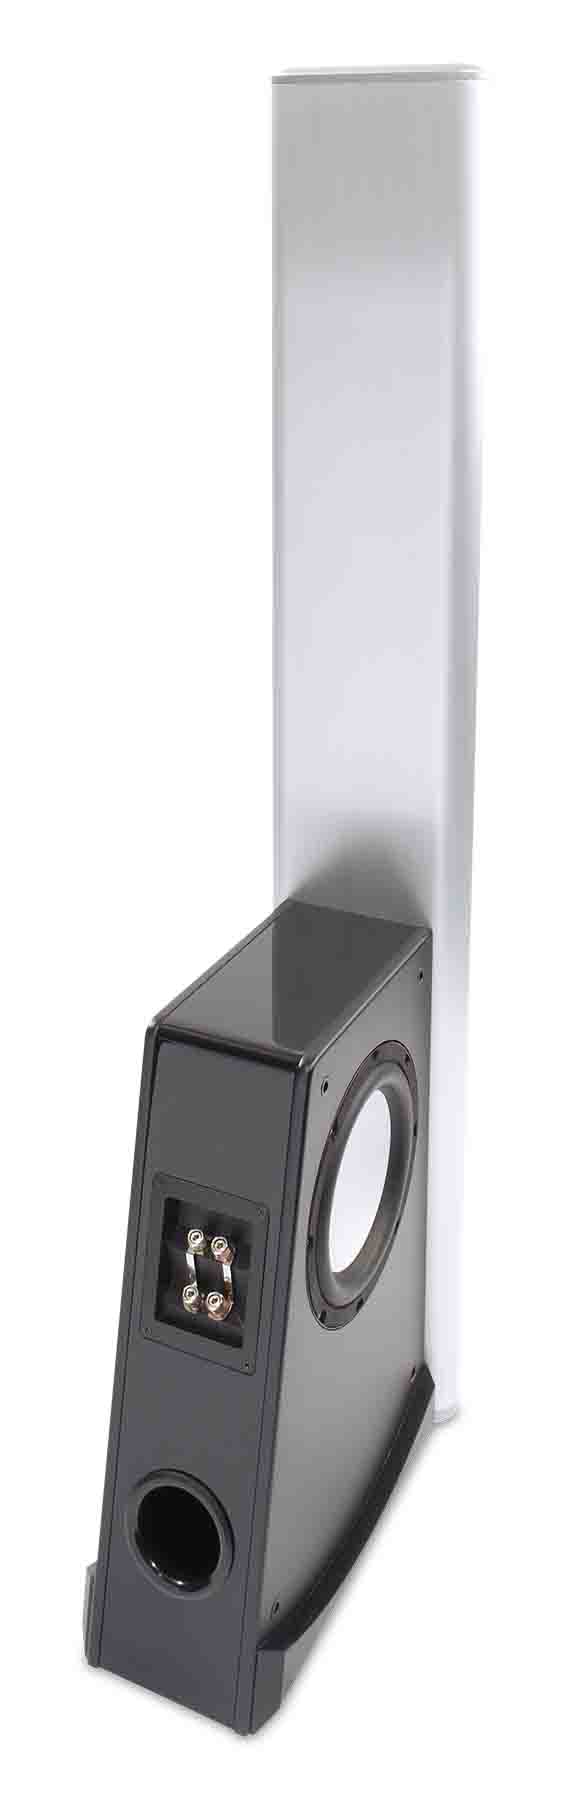
RBH WM-24, WM-30, FM-45 Build Quality
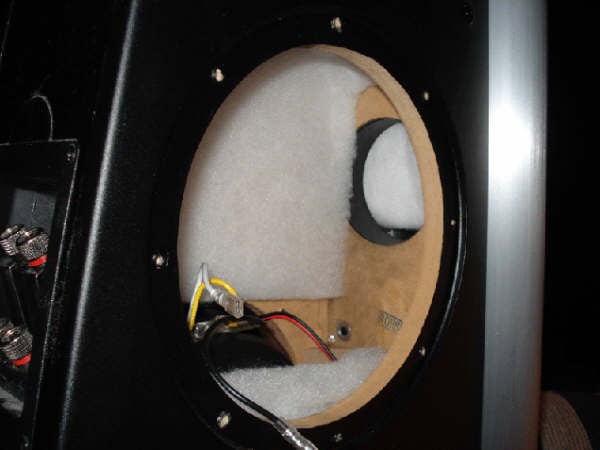
The FM-45s feature a D’apollito M-T-M arrangement, with the drivers mounted near the top of the tower, the 1” silk dome tweeter ~ 38” above ground level. The two 8” woofers are arranged in a side-firing configuration, ported out the back of the cabinet. 2 pair of 5-way binding posts, configurable for biamping via a pair of included removable jumpers. The cabinets are built of MDF and metal stock, lined\stuffed where appropriate and wired with 18AWG cable throughout.
The woofer pair is wired in series and connects directly to the bottom two binding posts. There are no passive components in the signal path between the woofers and the binding posts; RBH chose instead to rely on the inherent lowpass amplitude response of the series-wired drivers to determine the lowpass characteristics of the LF system’s response. A purist approach if there ever was one!
The highpass amplitude response characteristic of the LF system’s response is controlled not only by the duct fastened into the back of the cabinet but also by two ports found in the bulkhead that partitions the LF cabinet from the tower. One such port can be seen on the right interior side of the cabinet showing in the photo above right.
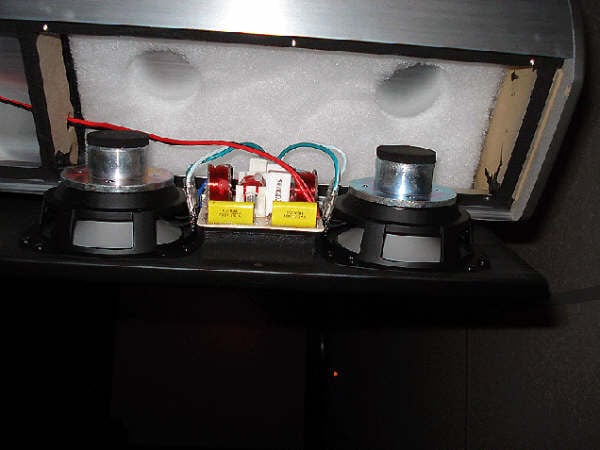
Mid-way or so up the tower an internal bulkhead separates the 4” midrange drivers & tweeter from the woofer. Both woofers and midranges feature aluminum cones and half-roll surrounds. The mids are wired in parallel and the tweeter features a series blocking cap in the circuit that serves to protect it from electrical damage. The crossover itself is located between the two mids and directly behind the tweeter, as seen in the photo, below right.
The WM-24s and WM-30 are similarly constructed, sharing many design features with the larger FM-45. Like their larger sibling’s M-T-M tweeter/midrange configuration, the WM-24s & WM-30s have their driver complement arrayed in an M-T-M, or more accurately, W-W-T-W-W. Though the FM-45s are vented and the WM-24s & WM-30s are not, the latter make use of a pair of passive radiators that function in much the same way as does a port. Similar hardware, similar specs - such as sensitivity, frequency response & so forth - and you’ve got what amounts to, sonically speaking, a well matched set. More on this later.
RBH WM-24, WM-30, FM-45 Listening Tests
Listening was done in a room measuring approximately 12’ x 20’ x9’, open at one end, with the FPD and all speakers located at the opposite end. At the head end of the equipment chain was a Toshiba HD-A20, lent for the occasion. The sub used was a Velodyne DD-18, all managed/amplified by a Denon AVR-3806. The RBH products were cabled to the Denon via 10AWG speaker cable. (Note, the measurments showing below are taken solely of the RBH products and do not include the subs contribution). Measurements were taken using LinearXs LMS and SpectraPlus 5.
CD: The Mavericks What a Crying Shame (ASIN: B000002OR0)
Originally a Florida
band, the Mavericks have long established themselves as a C&W band
definitely not part of that genre’s Top 40 scene. Fans love ‘em and their
unique sound that’s sort of described as a mix of honky-tonk, country pop, folk
and good old R&R. At the heart of that sound is Raul Malo’s tenor voice. It
was for that voice this CD was chosen. Lesser systems seem to have a hard time
reproducing that tenor with any sort of authentic quality, typically making
Raul sound (as my youngest daughter once described it) like he’s “singing out
the bottom of a barrel”. No such problems here with either the WM-24s, WM-30 or
the FM-45s. They all handled the task with finesse, easily conveying the rich
nuances of Malo’s voice, especially on tracks such as the Roy Orbison tribute I Should Have Been True.The Orb would be
proud.
On more sonically complex tracks, such as the Maverick’s cover of Springsteen’s “All That Heaven Will Allow”, nothing was lost, in terms of overall sonic quality, by the WM-24s and WM-30 as the volume was pushed upward. In large part, this is a testament to the quality of the drivers and the design context within which they work. How so? Lesser systems tend to collapse the overall sonic presentation into a glary, annoying mess as the volume gets pushed upward. This happens, in large part,because of the increasing distortion components present in the various driver’s acoustical output. Better quality drivers tend to
exhibit better control of this unwanted component and that’s certainly the case with the WM-24, the WM-30 & the FM-45. This is not to say these systems don’t have their limits in terms of how much electrical they can absorb; they do. However, RBH has done thier homework and have packed the WM-24, WM-30 and FM-45 with individual driver arrays capable of delivering clean sound at levels where other lesser systems of similar design & build would have have long since given up hope. In a word, these systems sound clean.
Truth is, there isn’t a bad track on the CD and I thoroughly enjoyed listening to the entire disk several times over as the RBHs were put through there paces. Tonally, the FM-45s tended to present themselves with a slightly hotter high end than either the WM-24s or WM-30 (as the measurements show) when listened to directly on-axis. However slight this difference tends to be in practice, it diminishes when the FM-45s are listened to off-axis. Also noteworthy is the WM-24s, WM-30s and FM-45s ability to keep images anchored rock-solid stable across the soundstage and the seemless LCR pans across the viewing field: there were none of the annoying shifts in tonal character all too often experience with lesser systems as an image moves from point to point across the soundstage.Here, the WM-24s were set up as the L & R speakers, the WM-30 as the center channel, with the whole rig augmented by a subwoofer.
DVD:
Texas Tornadoes Live From Austin, Texas (ASIN:B000B9EYK2)
If you’ve spent any time at all out in the southwest,
you’ve likely heard these guys somewhere at sometime or another. They are or
were (two members, Baldemar Huerta, better known as Freddy Fender, and Doug
Sahm have since passed away) a TexMex supergroup and the Live From Austin, Texas DVD is considered a must-have by the band’s
fan base. Not surprising when you consider some critics figure the Texas
Tornados’ performance captured on this DVD was one of the finest ever delivered
at Austin City Limits. (In 2005 The Rolling Stone reviewed the CD and awarded
it 4 out 5 stars, 1 short of a classic).
Fun to watch and fun to listen to, the DVD - and the RBHs - had the
place rocking in no time.
It was obvious the original speakers supplied with the FPD (what a joke!) couldn’t hope to match the RBHs in terms of either sonic accuracy or power handling. Now this was an upgrade fit for an audioholic! For this part of the listening session I set the FM-45s as the front L & R channels, the WM-30 as the center channel and the WM-24s as side surrounds.
The WM-24s, WM-30 and FM-45s ability to play loud and clean - to a degree that only well-designed systems packed with well-designed drivers can do - was effectively showcased by the DVD. Drivers that can play loud and keep their linear & nonlinear distortion components well under control typically excel when playing back well recorded concert material. Material such as this (that hasn’t been over-compressed) is a real pleasure to listen to when played back through the WM-24s, WM-30 or FM-45. With their ability to authentically reproduce the dynamics of a live music event, they successfully convey to an impressive degree a sense of the “liveness” of the live event.
Recommendations
 In terms of performance, to get the best out of WM-24s, WM-30s
and/or FM-45s experimentation with placement is highly recommended. Use of a
good quality speaker cable, 12 AWG or larger, is recommended. If you’re not
using banana plugs, you might find the binding posts on the WM-24s & WM-30s
difficult to work, owing to tight quarters in the immediate vicinity.
In terms of performance, to get the best out of WM-24s, WM-30s
and/or FM-45s experimentation with placement is highly recommended. Use of a
good quality speaker cable, 12 AWG or larger, is recommended. If you’re not
using banana plugs, you might find the binding posts on the WM-24s & WM-30s
difficult to work, owing to tight quarters in the immediate vicinity.
If your interest is solely with the FM-45s, consider biamping the speakers, even if they’re to be used for 2-channel listening. The RBH SA-200 amplifier (200 Wpc, 4-ohms driven) is an obvious choice for the job.
Biamping the FM-45s with an SA-200 improved the overall sonic presentation, especially noticeable with material that hadn’t had the life compressed out of it, an all too common occurrence these days. Biamp the FM-45s and run them with a separate subwoofer, if you’ve got one handy, and you’ll likely end up feeling compelled to go on one of those post-equipment upgrade musical safaris where you rediscover the sonic attributes of all your favorite CDs and DVDs.
If you plan on wall mounting WM-24s or WM-30s and are unsure of your carpentry or masonry skills, seek out the services of a competent professional. Better safe than sorry. As an alternate, the WM-24s and WM-30s can be stand mounted.
RBH WM-24, WM-30, FM-45 Measurements and Analysis
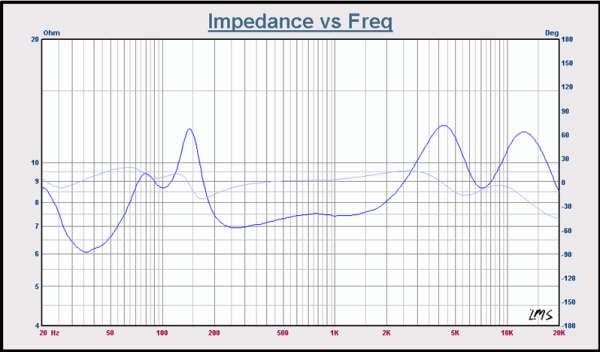
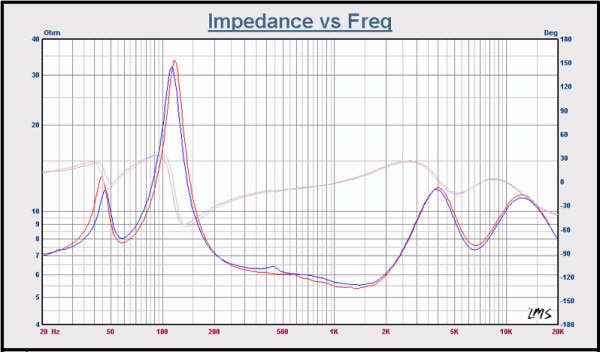
Figure 1. Impedance
& Phase. FM-45 at left, WM - 24 & WM-30 at right.
At left in the FM-45 graph we see a local minimum at just under 40 Hz. It’s also a global minimum in that at just under 40 Hz we also find the minimum system impedance at just over 6 ohms. To the right of that point, at just over 100 Hz we find another local minimum of about 8.7 ohms. This saddle point, located as it is between the two local z peaks (found at 80 Hz and 150 Hz) arises as a consequence of the electrical interaction between the woofer/ported cabinet system and the midrange/sealed cabinet system. The saddle point found at just over 7kHz is likely due to the MF/HF drivers setting up an electrical resonance with the highpass section of the crossover network. Also noteworthy is the system’s electrical phase response: Maxing out at 19.7 degrees (64 Hz), reaching a minimum of -45 degrees (20kHz). In the critical 300 Hz – 3kHz range the phase deviates a maximum of 15 degrees from 0.
At right are the impedance curves of the WM-24 & WM-30. At left in the graph we see the typical peak-trough-peak impedance response of an LF system employing passive radiators. In the case of the WM-24 & WM-30 the 4” active driver pairs are augmented by a pair of passive radiators. At right we see a z peak-trough-peak, located at roughly 500 Hz lower, though similar in appearance than that seen in the FM-45 impedance plot. As was the case with the FM-45, it is likely due to the MF/HF drivers setting up an electrical resonance with the highpass section of the crossover network.
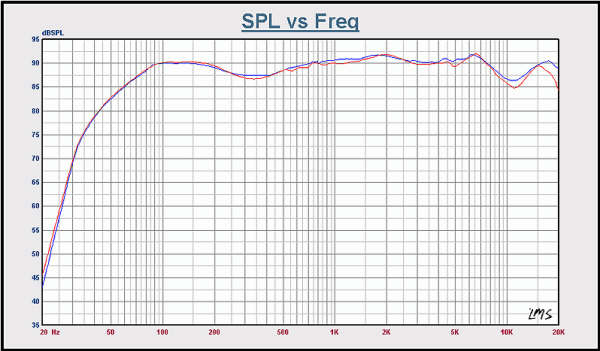
Figure 2. Amplitude response plots. FM-45 at
left, WM-24 (Red) & WM-30 (Blue) at right.
1m, on-axis, 2.828Vac,
dB re 20 µPa. 1/12th Octave smoothing used for enhanced visual
clarity.
In Figure 2
we see at left the amplitude response plot of the FM-45 and at right the
amplitude response plots of the WM-24 & WM-30.
Using the
measured 89 dB sensitivity as a reference, the FM-45 produces a response plot
that remains largely within +/- 3dB of that figure from about 45 Hz to 20kHz,
stepping slightly ( a fraction of a dB) out of bounds only in the 5kHz to 9kHz
range. Apparent in the plot is the slight upward tilt of the system’s amplitude
response noted earlier in the subjective assessment portion of this review.
Depending on where you’re seated in relation to the FM-45s this can present as
a slight emphasis on detail. The
effect diminishes, of course as the listening position is shifted off-axis.
The FM-45 LF
response you’ll likely encounter in practice will certainly be influenced by
placement and your listening space’s acoustics. Factoring in room gain and so
forth, useful extension to somewhere in the neighborhood of 40 Hz seems a
reasonable outcome. LF extension to at least the 40 Hz – 45 Hz range is often
judged as essential should a loudspeaker system aspire to successfully
presenting the listener with a musically satisfying experience. And in this
case, the FM-45 meets those criteria.
Referencing
the measured 90 dB sensitivity figure, the WM-24 & WM-30 both produce
amplitude response plots that remain largely within the +/-3dB range from about
70 Hz to 20 kHz, stepping out of bounds by a fraction of a dB only in the 10
kHz to 12 kHz region. Sounding slightly reserved in the upper mid-bass/lower MF
region and likewise in a portion of the HF region, the WM-24s and WM-30
otherwise presented similarly in many ways, sonically speaking, to the FM-45.
Noteworthy in the measurements is the high degree of similarity between the amplitude response of the WM-24 & WM-30. There also exists, especially in the 500 Hz to 20 kHz range the already mentioned family resemblance in both products to the FM-45.
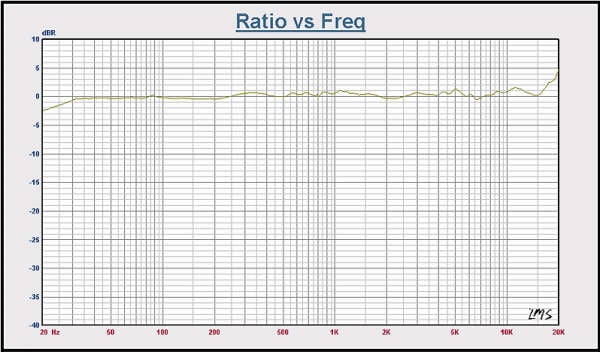
Figure 3. WM-24 & WM-30 amplitude response match comparison
In Figure 3 we see a comparison between the amplitude response plots of the WM-24 & WM-30.
Across the majority of 20 Hz to 20 kHz range they match to within 1 dB. This partially explains the rock-solid stability of the images and the exceptionally clear pans across the soundstage presented by the WM-24s and WM-30 during the listening sessions. Excellent!
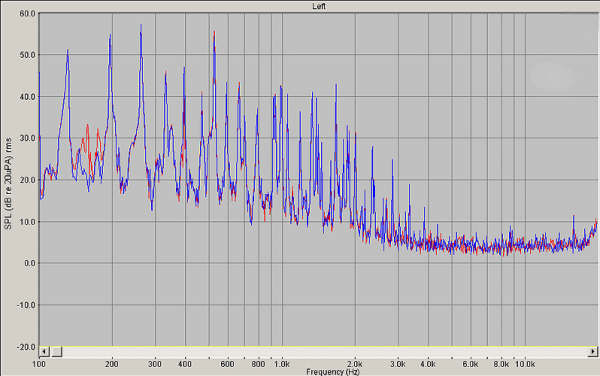
Figure 4. Spectral component
comparison of two WM-24s
In listening to the various RBH products it was clear how well matched, in terms of timbre, they are to each other. Curious to take a closer look at this, a spectral analysis of the two WM-24s was done.
Above in Figure 4, the red & blue plots are the spectral components or harmonic profile of the two WM-24's acoustical version of a chord, sampled from Gershwin's "Rhapsody in Blue" as played on a Steinway Concert Grand piano.
When broken down into the individual spectral components the strong similarity between the two is immediately apparent. (The bits that look out of whack in the 150 - 180 Hz range in the red plot are owing to environmental noise). Here we see another reason for the impressive rock-solid stability of the images and the exceptionally clear pans mentioned earlier. Clearly, a high degree of quality control has gone into the selection and assembly of the components comprising the WM-24s. Overall, it’s fair to say RBH has in fact attained a substantial degree of timbre matching with these products. Excellent!
RBH WM-24, WM-30, FM-45 Conclusion
The WM-24
or W-30? If you’ve just bought a flat panel display, these are for you! The WM-24s, WM-30 and FM-45s ability to play
loud and clean was effectively showcased in my exhaustive listening
sessions.. For those limited in
floorspace and/or wanting a speaker system that will aesthetically match their
new flat panel display, the M Series loudspeaker from RBH Sound should be on
your list of products to audition. The
system as a whole works very well together and blends seamlessly thanks to its
excellent timber matching and system synergy.
Hang a pair
of WM-24s or WM-30s on your wall and you’re investing in RBH Sounds 30+ years
experience in developing and refining advanced loudspeaker products. Upgrade
your current flat panel display speakers to a pair of WM-24s or WM-30s, maybe
add a third as a center channel, and you’ve just gained an extra dimension to your
viewing experience. Add a sub and watch the envy factor head up in your circle
of friends & neighbors.
If the budget doesn’t allow for a flagship product, such as the RBH T-30LSE, you’ll find many of the design-side benefits, such as the advanced driver technology common to all RBH products, are to be had in the affordable FM-45. Its biampable, sports a collection of top-notch drivers and is pure RBH through and through.
The Score Card
The scoring below is based on each piece of equipment doing the duty it is designed for. The numbers are weighed heavily with respect to the individual cost of each unit, thus giving a rating roughly equal to:
Performance × Price Factor/Value = Rating
Audioholics.com note: The ratings indicated below are based on subjective listening and objective testing of the product in question. The rating scale is based on performance/value ratio. If you notice better performing products in future reviews that have lower numbers in certain areas, be aware that the value factor is most likely the culprit. Other Audioholics reviewers may rate products solely based on performance, and each reviewer has his/her own system for ratings.
Audioholics Rating Scale
 — Excellent
- — Very Good
- — Good
- — Fair
- — Poor
| Metric | Rating |
|---|---|
| Build Quality | |
| Appearance | |
| Treble Extension | |
| Treble Smoothness | |
| Midrange Accuracy | |
| Bass Extension | |
| Bass Accuracy | |
| Dynamic Range | |
| Performance | |
| Value |