
RBH Sound T-2 Signature Series Tower Speaker Review
RBH Sound T-2 Signature Series
- Product Name: RBH Sound T-2 Signature Series
- Manufacturer: RBH Sound
- Performance Rating:

- Value Rating:

- Review Date: January 31, 2004 18:00
- MSRP: $ 7499 (black) $9499 (veneer)
Technical specs (T-2 N&P)
System Type: Modular Tower
Frequency Response: 20Hz - 20kHz±3dB
Sensitivity: 90dB (2.83V @ 1 Meter)
Power Handling: 500 Watts
Drive Units: (2) 10" Aluminum Woofer
(4) 6 1/2" Aluminum Woofer
(3) 1" Silk Dome Tweeter
Tweeter Protection: No
Crossover Frequency: 2500Hz
Crossover: 24dB/Octave
Impedance: 4 Ohms
Cabinet Material: Medium Density
Fiberboard (MDF)
Cabinet Finish: Black Oak Woodgrain
with NevamarT tops and bases,
or 30 different real hardwood finishes
Dimensions: 61 1/4""H x 13 1/4"W x 18"D
Weight: 190 lbs.
(2) SA-400 400wpc Subwoofer Amplifiers
MSRP: $7499pr (black) / $9299pr (veneer)
Pros
- Unsurpassed Dynamic Range
- Gigantic Soundstage
- Excellent Imaging Over a Large
- Listening
- Window
- Unbelievable Sound and Value
Cons
- Gargantuan Size and Weight
- Difficult to Set-Up Properly
- No Sub EQ or Variable Phase
- Control
- Low WAF
RBH T-2 Technology Overview
 RBH Sound
has been manufacturing high performance loudspeakers for over 25 years
catering to the high performance (mind you not necessarily high priced)
and custom install marketplaces. Yet their name isn't as widely
recognized by consumers like some of the big guys out there.
Fortunately name recognition is not always a reflection of product
quality or performance. I can't think of a better example than this
particular loudspeaker manufacturer. We have always been impressed with
RBH Sound products since we began reviewing them a few years ago (so
much so that two of our reference systems are comprised of their
Special Anniversary Edition Signature Series Loudspeakers).
RBH Sound
has been manufacturing high performance loudspeakers for over 25 years
catering to the high performance (mind you not necessarily high priced)
and custom install marketplaces. Yet their name isn't as widely
recognized by consumers like some of the big guys out there.
Fortunately name recognition is not always a reflection of product
quality or performance. I can't think of a better example than this
particular loudspeaker manufacturer. We have always been impressed with
RBH Sound products since we began reviewing them a few years ago (so
much so that two of our reference systems are comprised of their
Special Anniversary Edition Signature Series Loudspeakers).
When their Chief Designer Shane Rich phoned me about a new Signature Series flagship product, you could imagine my enthusiasm about wanting to get my hands on a set. However, upon my first glimpse of these super sized speakers, I had reservations as to how they would fit in my listening room, and more importantly how I would convince my wife of living with them during my evaluation.
The sheer size of the T-2 System implies intimidation and power, making lesser-sized speaker systems seem smaller than they would ordinarily appear. Granted, we all know the saying " Bigger doesn't mean better ", but does that apply in this case? Continue reading to find out....
When I asked Shane what their target market is for this system, he told me it is for the home theater enthusiast who demands uncompromised performance and dynamic range to handle two-channel music and sophisticated home theater playback with equal measure.
The T-2 subwoofers are basically unpowered versions of the renowned 1010-SEP subwoofers. RBH Sound classifies the T-1 speaker array as a satellite speaker, perhaps the worlds largest at that! The T-1 uses the identical sized cabinet of the 1010-SEN subwoofers. When I saw this, I thought to myself, very clever. RBH Sound probably didn't require this much cabinet volume for the satellite module. Now they had a common cabinet design for the whole package, saving them on material costs through higher purchase volume, as well as maintaining a uniform appearance to the speaker system when the modules are stacked. My assumptions were correct, as Shane told me about 1/2 of the cabinet volume is stuffed with insulation and baffled bracing at the midpoint to minimize resonance. For those who like mass loading the bottom of their speaker cabinets, you can take it to the next level by mass loading ½ of the cabinet from top to bottom! This would surely yield a more inert cabinet, but good luck moving such a beast as the stock system already weighs in at a whopping 200lbs. The weight would likely double if fully mass loaded, so if you found a permanent residence for these speakers, you may wish to give it a try. I would advise to first load the mass (ie. sand, led shot, etc) in plastic baggies so it would be easier to remove when you find it necessary. I ultimately did not choose to mass load these speakers during my review, but if time permits at a later date, I may give it a try and report the results in a review addendum.
What makes the T System unique is its rather unconventional driver array, which appears to be a cross between a line array and D'Appolito configuration. Since RBH Sound did not capitalize on a name for this unique driver arrangement, I aptly labeled it the "Rich Array" after the inventor. According to Shane, the increased cone area is responsible for increased dynamic range and less distortion. The specific driver alignment allows for a very broad/uniform dispersion pattern between the speakers and a more controlled dispersion pattern to the outside of the speakers. The controlled dispersion pattern reduces reflections off of room boundaries at critical frequencies. It also allows for a very spacious soundstage with improved imaging across the width of the listening area. In affect, as you move from the center listening position to the left or right, the speaker furthest from you becomes louder and the speaker closest to you becomes softer within a critical range of frequencies. In a sense, this speaker is somewhat self-correcting relative to listening position, implying that it almost counteracts the Haas Effect .
RBH T-2 Set-Up
The RBH Sound T System is by far the largest speaker system I have ever reviewed and integrated into a home theater set-up. I was a bit overwhelmed by the amount of boxes that the delivery person brought to my front door when the system arrived. I quickly unpacked the system, broke down the boxes and stowed them away in my attic before the wife came home to avoid her seeing our home in disarray.
|
|
|
|
RBH Sound T-2 Knotty Pine Finish (Main Channels) and T-1 Black Vinyl Finish (Center Channel) |
|

My room is a bit more challenging to get a system's bass response just right then this picture would lead you to believe. I have two strikes against me, vaulted ceilings, and a partly open front wall behind the main speakers to the kitchen/dining room area. The left speaker is coupled nicely a few feet away between two adjacent walls. However the right speaker side/back wall opens to another room creating asymmetrical bass loading that if the system is not set-up properly, can lead to bass anomalies usually in the form of suck outs or bumps at particular frequencies. This is why I am so adamant about variable phase/group delay control and/or inclusion of a PEQ for subwoofer amplifiers and processors.
Properly setting up the T-2 System, given my room dynamics and the speaker systems complexity and size proved to be a learning experience. I was fortunate to have Shane Rich on hand to assist in the set-up of this system and have tabulated my set up notes for the benefit of any potential future owners.
Step 1: Making the Connections
First you must decide as to how you plan on hooking up the 1010-SEN subwoofers to your A/V Processor/Receiver (AVP). The three primary options have associated trade offs, thus I recommend choosing which it right for your application and results in the least amount of compromises.
A) Line Level: Subwoofer output of AVP to SA-400 subwoofer amplifiers.
B) L ine Level: Main Channel outputs of AVP to SA-400 subwoofer amplifiers.
C) S peaker Level: Main Channel outputs of AVP to SA-400 subwoofer amplifiers.
The advantage to option A is that the user can retain subwoofer level control via their AVP after the system has been properly set-up.
This is particularly critical for a user that listens to all current multi-channel surround and music formats due to the inherent differences of subwoofer levels depending on format and actual recording. The downside is if the AVP is limited to a single or dual mono subwoofer output, you lose the ability of maintaining stereo bass below the crossover frequency of the T-1 satellites.
The advantage to option B is that you now have stereo bass feature and "always on" subwoofer level and control for all modes of operation. The downside is you lose the ability to adjust subwoofer level control via the AVP. In addition, some AVP's dynamically limit the LFE information when recombining that signal to the main channels in set-ups with no dedicated subwoofers, so be advised and proceed with caution.
The same advantages/disadvantages from option B apply to option C, except now you have speaker wires to contend with and cable dealers that may wish to sell you snake oil. I ultimately choose option A for my set-up since it represented the least amount of tradeoffs given my reference gear and room dynamics.
The RBH Sound SA-400 subwoofer amplifiers

It takes (2) SA-400 amps (one per 1010-SEN subwoofer) to power the T System. Unlike most subwoofer amps which are Class D, the SA-400 is a true 400 watt Class AB/G design. While digital amps are not necessarily a bad thing, especially for subwoofers, I still often prefer the performance of a good old linear amp. In this respect, the SA-400 really delivered what seemed to be limitless clean power to the subwoofers with minimal heat dissipation. I suspect the fact that a good job of adequately heat sinking the output devices, combined with the multi rail Class G operation during high power demands resulted in a powerful amplifier that could be stacked with moderate ventilation and not melt nearby furniture or equipment. Heat dissipation was never a problem in my set-up, even during my extended loud, bone crushing Terminator 3 listening sessions.
The backpanel of the T System contains 5 way binding posts for both the Satellite and Bass Modules allowing for bi-wiring or bi-amping. In my set-up, I left the jumpers in place and connected the Satellites to the Denon AVR-5803 front channel amps and each Bass Module to a separate SA-400 subwoofer amp.

Back view of RBH T-2 Speaker
Step 2: Making the Adjustments
Ok, so now that I figured out the best way to connect the T System to my setup, it was time to figure out how to adjust the following variables for optimal playback performance:
A) AVP Bass Management
B) Subwoofer Amps (SA-400) Settings
Due to the unique design of the RBH Sound T System, much care must be taken to ensure proper integration of the T-1 satellites and 1010-SEN subwoofers. Since the T-1 satellites have a lower end extension of about 40Hz, one would normally consider this to qualify for "Large" setting with a subwoofer crossover in the 60-80Hz region. I was the one who originally thought this until LMS and Sencore measurements, as well as my ears, dictated otherwise. Thanks to my rather non ideal room, typical with most Floridian houses endowed with vaulted ceilings and open architecture, I had to do things a bit differently and rather unconventionally from what I normally recommend. In the past I used to scream about the disadvantages of high crossover settings when mating with large bass capable speakers due to localization of bass pressure waves and doubling of bass which commonly excites room modes. However, in my situation it was a must, and the very fact that I now integrated two subwoofers in different parts of the room seemed to quickly nullify my concerns. Since the room was now loaded in this fashion, it appeared to help average out the bass response making it easier to integrate with a higher crossover setting within the room. While my measurements at the listening position were starting to look good, there were still too many nasty room modes and suck outs that I could not live with. Because I had the subwoofers connected in parallel to the mono subwoofer output of the Denon AVR-5803 receiver, attempting to utilize the subwoofer group delay within the receiver was senseless. In order for group delay changes to be effective, you must have independent adjustment capabilities for at least one of the subwoofers in the system otherwise you are simply changing relative phase of the signal. At this point, I had to turn to adjusting the level and phase controls of the SA-400 subwoofer amplifiers to dial in a more optimal system bass response. Unfortunately the RBH Sound SA-400 amplifiers lack variable phase control and any sort of equalization or room correction. Thus the only tools these amps were armed with to manipulate subwoofer response for better room integration were: {0/180 Phase Switch, Defeatable Crossover, Level Control}. After an hour or so of playing around with these variables on both subwoofer amps, I settled on the best measurable response. Incidentally I managed to find a host of settings that allowed for very good bass integration with the AVP bass management set to "Small" for all speakers and 100Hz for the crossovers.
|
|
SA-400 Amp Configuration (Left Sub) |
SA-400 Amp Configuration (Right Sub) |
|
Phase |
0 |
0 |
|
Crossover |
Defeat |
About 120Hz |
|
Level |
Slightly less then half |
Slightly more than half |
Note: AVP Crossover = 100Hz, All Speakers set to "Small"
Without a variable phase control, I had to trick the right subwoofer into thinking I was changing its phase response by enabling one of the SA-400 amps internal crossovers to cascade it with the AVP 100Hz crossover. I would have preferred RBH Sound to include a variable phase control as opposed to a 0/180 switch in the amplifiers to avoid taking this step. RBH informed me that all of their newer integrated subwoofer amplifiers have this feature and the SA-400 is the last amp in their line up that will eventually get it. Lucky me :-( My band aid fix of using the cascaded crossover really worked well in my situation as I all but squashed the worst suckout to within -5 dB for less than 10Hz bandwidth (see Figure 4). However, yielding an overall good bass response came at a cost by bumping subwoofer level up a bit hotter than ideal causing a 10-15dB bump from 25-40Hz. This is something that I can live with since I do like my low end bass extension a bit thick. In addition, based on the Fletcher & Munson Curve for human hearing, our sensitivity in this frequency range could certainly use a little boost, not to mention most recordings are a little thin in this range. Ultimately I would have liked to smooth out this bump a bit with a Parametric Equalizer (PEQ) and expressed my disappointment to RBH Sound for the lack of its inclusion to their excellent SA-400 subwoofer amplifiers and suggested incorporating this feature in future designs.
RBH T-2 Listening Evaluation
I was most impressed with the uniformity of bass response throughout my entire speaker system in this configuration. In my reference system, with large main speakers and a dedicated subwoofer near the left corner of the room, most of the bass energy emanated from that corner. Thus when I ran the Avia set-up disc for checking bass levels, I found it nearly impossible to maintain a similar bass response for each channel. This was no longer the case with the T-2 System implemented in my room and configured as previously noted. When I ran the same test sweeps I found bass energy from channel to channel to closely track within a couple of dB! I was beginning to really see the benefit of properly integrating multiple subwoofers in a listening room. For competitive purposes, before disconnecting my reference speakers, I made some quick listening position LMS measurements and adjusted the bass levels of the T-2 System to closely match the response as illustrated in Figure 5 . Upon further on the fly tweaking and using my trusty handheld Sencore SP295C Audio Analyzer, I honed in a more optimal response as seen in Figure 4 . At this point I felt I reached a good stopping point for measuring bass response and thus it was time to do what ultimately matters most, a critical listening evaluation.
Listening Evaluation
When gazing upon the RBH Sound T System for the first time at my listening position, I recalled a paper I once read authored by Dr. Floyd Toole. In this paper, he stated human perception of sound can be influenced by appearance or first impression of the product before any sound is actually outputted. I tried to be mindful of this realizing the physical stature of the speaker system to me conveyed power, presence and dynamics but at the expense of loss of subtle detail and imaging due to a large baffle area. Being mindful of my preconceived stereotypes of this system, I began my listening session, starting with some critical two-channel listening.
Two Channel Audio
|
Title:
Tubular Bells
2
Track List |
Title:
Modern
Cool
Trace List |


I began with a familiar disc from Mike Oldfield titled " Tubular Bells 2 ". I choose this disc because it was the exact disc I was listening to on my reference system prior to changing out my speakers for the new T-2 System. I wanted to gauge just how well the bass integration of two subs crossed over at 100Hz in my room would compare against my reference bass capable speakers mated with one powered 1010-SEP subwoofer. I skipped to track #8 " Weightless ", then sat back listening to the opening melodic keyboard and choir ballad waiting for the bass to kick in. About a minute into this song, a very deep and extended bass plays that wimpy speakers have no place even attempting to reproduce. This track always played well on my reference set-up so I had high expectations for the T-2 System. It certainly did not disappoint in this respect. In fact, this was the first time I actually had goose bumps listening to this song. The bass was well extended, tight, and full.
I was certainly reaching new lows that I was unable to with my reference set-up. The T System produced a quality of bass that was both felt and heard with equally unobtrusive delight. I found myself in such envelopment of the sound, that I unwittingly listened to the remainder of the CD, which is surprising since I am not particularly fond of two of the songs. Nonetheless, the sheer sonic enjoyment persuaded me to continue listening. I wasn't sure what sounded more grand, the bass extension, or the depth of soundstage and unstrained sound quality I was hearing in the instruments.
Next up was SACD. Patricia Barber's Modern Cool SACD is a great example of what SACD is all about. In my opinion, Premonition Records (premier record company for Patricia Barber), makes some of the highest quality recordings I am familiar with, and this one was no exception. The song " Company " from Modern Cool contains a drum ballad unheard of in today's Smooth Jazz realm, welcome in a world where two chord rock and prefabricated lyrics seem so commonplace. Again the T-2 Signature System was unyielding in its performance. The snare drum snapped and the cymbals crashed without hint of compression or distortion commonly heard in lesser designed systems. While my reference speakers were by no means compressed or lacking in dynamics, the T-2 System simply unveiled a level of realism in the music that I have never heard in any speaker system before, regardless of price. The trumpets were right in your face and the separation of instruments was unreal. Bass was hard hitting and tight making me lose control of the master volume. Usually I don't listen to music this loudly, but the T System almost seemed to beg to be played louder just like a sports car demands to be driven harder. Fortunately my wife kept me in check on many occasions to control loudness to reasonable levels, much like radar traps and high priced tickets govern sports car enthusiasts.
A speaker system that plays loudly with great composure and linearity is certainly important, perhaps equally important as one that plays at low levels. To get an understanding of how the T-2 System would handle low level details, I popped in Michael Frank's Burchfield Nines one night while everyone was asleep and the house was completely silent. I am intimately familiar with how track #5 " Meet Me In The Deer Park " sounds on my reference system and was eager to hear how the T-2 System presented it. I was hearing all of the detail in percussions as I recalled in my reference speakers, but with a much BIGGER soundstage. I was surprised that even at low volume levels, the benefits of T-2 unique driver topology were revealed. I suspect the radiation pattern of the Rich array and how the T-2 Speaker System played into the room played a big part in this. I felt that Michael's voice was a tad more laid back, or dare I say warmer, but not quite as intimate as I remembered on my reference system. However, the tonal differences in vocals are somewhat of a personal preference. My reference speakers incorporate a D'Appolito driver topology, which has a natural tendency towards a more forward sound quality in the midrange. Over the years I have become accustomed to this tonality in my speakers and thus I had to really listen back and forth between the two systems to realize which I preferred. Ultimately, I preferred the more laid back, but larger vocal presentation of the T-2 System in most cases, even at low listening levels. Whether I was listening to rock, jazz or classical music, I found the low level linearity of the T-2 System to be well preserved, indicating this was truly a highly dynamic loudspeaker system. It was clear by now that the T-2 System passed all of my tests and removed all doubts, preconceived or otherwise, about its ability to satisfy critical two-channel music listening.
Multi-Channel Music
Since I was in a bass mood at the time, I moved on to Graham Nash's "Songs for Survivors " DVD-A disc. I really love cranking up track #4 " The Chelsea Hotel " to test the limits of a system as well as my neighbors' hearing. The T-2 System broke no sweat keeping on track. In fact, it was indeed loud, more so than I thought as I took out my SPL meter and measured peaks in excess of 120dB at the listening position (note room gain and bass frequencies play a large roll in achieved high SPL's). The bass was so pronounced and powerful that for an instant I mistook a popping sound I heard as the subwoofers bottoming out for the plastic protection screen of my RPTV reaching its elastic limits. Interestingly enough, regardless of the high SPL levels, it didn't seem overbearing or fatiguing like when on rare occasions I 'm dragged to a nighclub or Columbian party playing loud music on a sub par audio system. To me this indicated that the distortion levels were extremely low, and dynamic driver compression was not evident during my torture test. Equally impressive was how effortlessly the Denon AVR-5803 was driving this system. One would ordinarily assume a large speaker system would require massive amounts of power to play at these loud listening levels.
However, this was not he case for a variety of reasons:
1) The impedance profile of the T-1 satellites (see Figure 1 ) is almost resistive in nature.
2) The high sensitivity of the T-1 satellites (90dB SPL, 2.83V @ 1 meter).
3) The T-1 satellites were crossed over at 100Hz essentially removing power robbing low frequency bass and providing more dynamic headroom to the amps in the receiver.
4) The 1010-SEN subwoofers are powered by separate 400 watt amps.
RBH T-2 Listening Tests (cont.)
I was startled to find that the Denon receiver remained cool to the touch after loud extended two-channel listening sessions and moderately warm during multi-channel listening extravaganzas. The T-1 satellite made quite an impressive center channel as well. Though I felt its lateral dispersion once horizontally placed above my RPTV was not quite as good as in vertical placement in a stereo pair. Again, its dynamics were unyielding and effortless, but was a tad more laid back (not a bad thing) then I was used to with my reference center channel. The T-1 center channel provided a wider listening window than I would have expected. I only heard notable tonal changes when seated almost completely off-axis to the speaker on my left couch (about 160 degrees). This is not uncommon in any speaker horizontally mounted, and wasn't a problem with me since I rarely sit in that location, reserving it for my guests, or unappreciative music lovers.
|
|
Artist:
Pat
Metheny
Tracks |
|
|
What kind of loudspeaker review would this be without the inclusion of one of Jazz's greatest guitarists, Pat Metheny? |
||

I was fortunate to actually see this tour a few years ago at Ruth Eckerd Hall in Clearwater, Florida. The acoustics in the concert hall, combined with the excellent horn ribbon loaded speaker array made for one impressive and loud show. Pat picked up a new drummer Antonio Sanchez and a couple of new instrumentalists / vocalists making for what I felt was his best performance to date, and perhaps within the top three live musical performances I have had the pleasure of experiencing.
I started out with the acoustical version of " Last Train Home " engaged in DTS and THX Music Mode which was my preferred choice upon hearing this DVD on my reference system. Given my new familiarity with the T-2 System, I was not surprised by how large Pats acoustic guitar sounded. I thoroughly enjoyed hearing the echo of his guitar and the swishing of his fingers on the strings when he played a slower version of what is more popularly known today as the holiday Publix song. I noted a hint of exaggerated bass that ordinarily shouldn't be there in an acoustic guitar. While most of this was a result of the recording, I couldn't help but wonder: if the SA-400 sub amps had built in room correction or PEQ if this problem would have been less noticeable. " Roots of Coincidence " was the next track I was most eager to hear. I quickly jumped to it, closed my eyes and waited to be transported back to Ruth Eckerd Hall. Despite the compressive artifacts in the recording (if only we had DSD or MLP for DVD Video), the T-2 System still managed to convince me I was back at the concert. The only thing missing was the bright magnesium flashes during explosive parts of the show. Perhaps I will add light effects to my home theater room in the future to rekindle the luminary experiences of live concerts.
Home Theater
A speaker system that satisfies critical two-channel and multi-channel music listening usually has no problems equally satisfying for the home theater user. However, the converse is not always true. I held back no punches with the T System and brought out some of the most dynamic DVD movies in my collection.
|
|
|
|
|
Terminator 3 - Rise of the Machines |
Lord of the Rings- The Two Towers |
Monsters, Inc. |


I think it goes without saying why I choose Terminator 3 as one of the DVD movies for reviewing the T-2 System. I am sure BIG, bold, and dynamic are the likely qualities Arnold Schwarzenegger would expect a speaker system to have, and in this regard the T System should more than satisfy the Terminator's requirements. The battle scenes in T3 and LOTR: The Two Towers were simply stunning. I felt as if I was enveloped in a wall of sound, convinced I was in a quality Cineplex and not my living room. I did feel at times that the rear soundstage (with my much smaller, but potent, reference speakers) was a bit outgunned and couldn't help to wonder what a full seven channel Signature T System configuration would sound like.
Monsters, Inc. is both a quality sounding and enjoyable movie to watch. It also happens to be one of my 3 year old daughter's favorites so, as you could imagine, I am quite familiar with it. A particularly notable scene in this movie is when the CDA had to decontaminate the town after the infestation of Baby Boo to their world. I felt the bass from the pulse blast in my bones, and of course heard the rattling of my front door and other undiscovered areas of my home. The T System brought a level of enjoyment to my movie watching experience that made me more eager to frequent the DVD rental store on the way home from work.
The Wife Acceptance Factor (WAF)
Regardless of how good a speaker system sounds, all married men know that integrating a home theater system in one's living room needs to have some degree of WAF. In this respect, the T-2 System doesn't pass with flying colors, but I do have a solution that should soften the blow should you decide this system is right for you. When I first installed this system in my living room for review, my wife complained about its sheer size and overwhelming stature. She complained that the numerous silver drivers, which she referred to as "crop circles", made her feel dizzy. As things weren't sitting too well with her at the moment, I had to tactically rethink the situation to turn things to my favor.
WAF Five Step Procedure
Step 1: Install T System while the wife is not at home. Don't let her see all of the boxes!
Step 2: Keep the grills on to avoid the "crop circle" dizzying effect. In time you can take them off, but not until she is more comfortable with the physical presence of the speakers.
Step 3: Have her enter the room for the first time blind folded and play her favorite music while offering a glass of wine or foot massage.
Step 4: Casually remind her that the overall footprint of the T-2 System is less than two, moderately sized tower speakers and a dedicated subwoofer.
Step 5: That night, take her to out to her favorite restaurant and discuss what types of decorations and/or ornaments she would like to place on top of the cabinets or in the room to match the new décor.
While I didn't exactly follow all of these steps in sequence, I did manage to convince my wife that the T-2 System can integrate into our living room. However, I cannot take full credit as the sound of the system is ultimately what sold her on it.
RBH T-2 Measurements and Analysis
|
|
|
Figure 1. Impedance & Phase Plots of T-1 satellite module
Light Purple: Phase |

This is a very impressive impedance/phase profile for such a complex multi driver speaker array.
The impedance looks almost resistive in nature from 100Hz out to 2kHz with a modest dip down to 4 ohms throughout the remaining audio band. Phase is extremely uniform maintaining a +- 30 degree window throughout the entire audio band, quite an achievement!
In my experience, I haven't measured a more benign loudspeaker load. Based on these measurements, and the high sensitivity of the design, any decent amplifier (even a rigid receiver) should be able to drive these speakers quite well.
Based on the low impedance profile of the T-1 at high frequencies, I recommend using low resistance cables (10AWG or less) to minimize potential frequency variations.
|
Figure 2a. T-2 System Summed Frequency Response

Figure 2b. T-1 Quasi Near Field Response
The above graph was taken: 2.5 meter @ 30 deg off-axis quasi near field response 3rd octave smoothed
According to Shane, due to its rather unique driver topology, the T System cannot be measured accurately in the nearfield. Or in other words, due to the distance required for an accurate summation of the drivers, a measurement in the nearfield will not give an accurate representation of the performance of this loudspeaker. The measurements in Figures 2a and 2b were taken at a distance of 2.5m at 20 and 30 degrees off-axis, respectively. At 30 degrees off-axis the response of the tweeter above 10KHz rolls off accordingly and matches the off-axis response of the manufacturer data sheet as illustrated in Figure 6 .
Real Time Analysis (RTA) from the Sencore SP295C Audio Analyzer
|
|
|
Figure 3. T-2 FFT In Room Frequency Response at Listening
Position Acoustic midpoint between T-2 System 5 meters away (20Hz to 21kHz). |

|
|

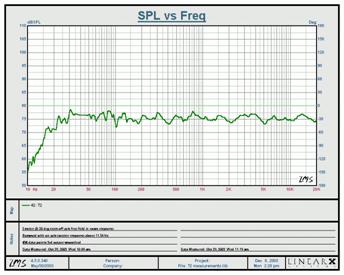
Figure 4. FFT In Room Frequency Response of the T-2 System at Listening Position
|
Low Frequency (10Hz to 330Hz) 1/12 th Octave FFT at listening position (6 sec average) |
RBH T-2 Measurements and Analysis (cont)

Figure 5. LMS Full Bandwidth Frequency Response Comparison of T-2 and
(1266-LSE + 1010-SEP)
Pink: T-2 System
Blue: 1266-LSE + 1010-SEP Subwoofer
Note the apparent 3dB suckout from 1.5kHz to 3kHz seen in the T-2 response was mostly nullified by simply repositioning the speaker system with respect to my entertainment center as seen in FFT plot in Figure 3 .
While this plot doesn't look pretty, it is a realistic representation of how loudspeakers interact in a room when measured at the listening position using a high resolution measuring system ( > 1/18th octave resolution) such as LMS. Since my original reference system was more calibrated towards Home Theater (bass levels elevated), I attempted to closely match levels with the T-2 System to show a direct comparison. In reality, I usually cut subwoofer levels down a few dB when listening to music, particularly two-channel audio. Figure 4 gives a much better representation of how the bass levels were ultimately set for the T-2 System during my music evaluation.
I would consider the T-2 measurement to be more linear in the treble range. The reason being that the frequency response of the T-2 System fits within a tighter overall window of + or - 2.77 dB from 800Hz to 10KHz, where the 1266-LSE + 1010-SEP system measures + or - 3.85 dB within the same range.
Another important factor to consider is the overall trend of the curve. A general rising or falling trend to the curve is much more audible to the ear than an occasional narrow band peek or dip in frequency response. Now that being said, we are comparing apples and oranges to some degree. Both systems "play" into the room differently. The measurements taken do not distinguish the differences between direct and reflected sound. However, they do show the non-linearity that results from the interaction between direct and reflected sound. This is especially evident in the midrange and mid bass frequencies. Take note that the T-2 System has 4dB more output at 20 Hz when compared to the 1266-LSE + 1010-SEP system which may partly explain why the bass in with the T-2 System was both felt and heard more so than with the 1266-LSE + 1010-SEP reference system.

The on-axis response of the Vifa D27tg tweeter utilized in the T-1 satellite modules is almost ruler flat out to 30kHz. Notice the 30 degree off-axis response of the tweeter is similar to the in room response I measured at the listening position. This indicates the baffle and driver alignments are not interfering with the excellent off-axis response of the tweeter.

Figure 7. Impulse Response of T-2 System
A quick check of impulse response using LMS demonstrated that no nasty resonance anomalies due to poor driver/crossover integration, ringing, or cabinet vibration was present in this system as indicated by the short settling time and lack of bumps thereafter.
About LMS and FFT Measuring Methods
The Fast Fourier Transform (FFT) is a mathematical filtering process that determines the frequency content of a time domain signal. The dual-channel FFT is the transfer function comprised of the complex comparison between the electrical signal inputted to the loudspeaker and the acoustical signal produced by the loudspeaker.
LMS (Loudspeaker Measurement System) provides the ability to achieve very high log frequency resolution across many decades of frequency. Unlike FFT analyzers, LMS provides log resolution of frequency data points, while still maintaining the ability to gate signals for quasi-anechoic SPL measurements. LMS measures frequency response directly, requiring very little CPU overhead no complex FFT transform to solve. Excellent log resolution is obtained at both the low and high extremes of the frequency spectrum.
RBH T-2 Recommendations
The RBH T-2 System really sold itself over a relatively short period of time. At first I felt it was a bit bright in my room but after a rather long break in period (50 hours or so) my perspective changed. The top end does have slightly more energy and frequency extension than my reference system (see Figure 5 ), but how the two speakers play differently into the room is what really tells the whole story.

RBH T-2P in knotty Pine
The 1266-LSE's are more limited in dynamic range due to less radiating cone area. In the same breath, the wide array of the T-2 System allows for much higher driver radiation and energy into the room, and to some degree making it more reactive to overly active rooms. What I originally mistook as "bright", was less compressed and had a more open, unforced soundstage which was second to none in my experience.
A large, heavy, expensive, and somewhat complex to set-up speaker system may not be for every audiophile. But the rewards of the T-2 System to the true music lover are limitless. It has a personality that grows on you. After experiencing it, switching back to a conventional cone loudspeaker design seems somewhat small. I think the most important aspect to consider when comparing the imaging characteristics of the T-2 System against conventional cone designs is which sounds more natural. Which one reproduces the soundstage of a concert hall or studio environment in your room in a more realistic manner and which one reproduces the most convincing image across the full width of the soundstage? While I realize the answer to this is subjective, I feel most of us are accustomed to hearing a more "spot lit" image than is really natural. The sound radiation pattern of most conventional speaker designs dictates an image where the majority of the sound comes from a center point between the speakers. Since this is where the image sounds most palpable and realistic, we often condition ourselves to some degree to accept this as good imaging. An experiment that can demonstrate this concept is to have someone stand between your speakers and talk, sing or play acoustic guitar (these are examples of sources that are usually recorded with a microphone in close proximity). Next pull out a few recordings of vocals or guitar and compare the difference. The recordings will usually sound more focused. Go to a concert hall and listen to the same type of material live and you will find there are even less definable directional cues to the music you are listening to. Of course all the specifics of what makes for good imaging and sound staging can be debated at length. While I originally preferred a delineated or more focused image and soundstage, I was surprised how my perception changed after listening to the T-2 System for a while and then switching back to my reference speakers. I would categorize the T-2 System as being open and spacious like a great ESL, but without the narrow sweet spot or common compression problems many ESL designs tend to exhibit at high volumes. It certainly has another advantage over most ESL designs - a more controlled and resistive impedance (see Figure 1) allowing for a more forgiving amplifier and considerably less power requirement.
Integrating the T System into one's home theater system must be done with great care. The T-1 satellite module weighs nearly 100lbs, and thus the installer must ensure that the shelf or mounting for it when used for center channel duties is heavily reinforced to support its weight. I had to install metal bracing brackets under the shelf of my entertainment center to eliminate a bowing effect I noticed almost immediately. Calibrating the T-2 System requires time, patience, and preferably an audio analyzer or at least an SPL meter and test disc such as Avia or the like. When contemplating an investment of this magnitude, you may wish to call on the services of your local authorized dealer, if not for anything other then avoiding hauling big heavy boxes into your home.
The RBH Sound T-2 Signature System garners my respect as the most innovative, best sounding loudspeaker I have had the pleasure of reviewing and demoing at CES 2004 . For the ultimate bass nut, RBH Sound also offers a T-3 version of this system, which stacks another T-2 Bass module on each T-1 satellite for a whopping (8) 10" subwoofer and standing nearly 8ft tall, tipping the scales at 280lbs! If you are serious about audio, and can live with a speaker system this grand, you owe it to yourself to arrange an audition of a Signature T System at a local authorized RBH Sound dealer.
At this time, due to the high performance of the RBH Sound T-2 Signature System, two of our Reference Systems will be getting an upgrade. Our third reference system formerly comprised of the fabulous Axiom Audio Epic 80 System will be upgraded to one of our original LSE Signature RBH Sound systems.
The Score Card
The scoring below is based on each piece of equipment doing the duty it is designed for. The numbers are weighed heavily with respect to the individual cost of each unit, thus giving a rating roughly equal to:
Performance × Price Factor/Value = Rating
Audioholics.com note: The ratings indicated below are based on subjective listening and objective testing of the product in question. The rating scale is based on performance/value ratio. If you notice better performing products in future reviews that have lower numbers in certain areas, be aware that the value factor is most likely the culprit. Other Audioholics reviewers may rate products solely based on performance, and each reviewer has his/her own system for ratings.
Audioholics Rating Scale
 — Excellent
- — Very Good
- — Good
- — Fair
- — Poor
| Metric | Rating |
|---|---|
| Build Quality | |
| Appearance | |
| Treble Extension | |
| Treble Smoothness | |
| Midrange Accuracy | |
| Bass Extension | |
| Bass Accuracy | |
| Imaging | |
| Soundstage | |
| Dynamic Range | |
| Performance | |
| Value |
Gene manages this organization, establishes relations with manufacturers and keeps Audioholics a well oiled machine. His goal is to educate about home theater and develop more standards in the industry to eliminate consumer confusion clouded by industry snake oil.
View full profile