
Mirage Omnisat v2 FS Loudspeaker Review
- Product Name: Mirage Omnisat v2 FS Loudspeaker
- Manufacturer: Mirage
- Performance Rating:

- Value Rating:
- Review Date: October 29, 2005 20:00
- MSRP: $ 1000/pair
|
Sensitivity (2.83 V/1 m): Recommended Amp. Power: Power Handling: Impedance, Nominal: Frequency Response (+/- 3 dB): Resonance Frequency: Internal Cabinet Volume: Bass Principle: Weight: Dimensions (W x H x L, cm): Crossover: Crossover Frequencies: Crossover Slope: Connection: Recommended Placing: |
85.5dB (averaged 300Hz-3kHz) 10 to 175 Watts 175 watts 4 ohms 55 Hz - 20 kHz 47 Hz 10 litres (.39 ft^3) Passive radiator 9.9 kg (21.8 lbs) 14.05 x 114.3 x 14.9 (5.5” x 45” x 5.9”) 900 Hz, 2.5 kHz Tower Woofers: 12 dB/oct LP; Top Woofer: 6 dB/oct LP; Tweeter 12 dB/oct HP 5-way, gold plated binding posts Floorstanding |
Pros
- Exceptional soundstage capabilities
- Tonally neutral sounding
- Very attractive product
- Small footprint
Cons
- Lightweight bass response; all but requires a subwoofer.
- High center of gravity; may lean slightly if placed on carpet too thick for the supplied spikes.
Mirage Omnisat v2 FS Company Overview
Founded in 1977, Mirage has enjoyed both critical and commercial success from the get-go with consistently innovative products, tracing its design roots to the seminal research done by the company's VP of Engineering, Ian Paisley, at Canada's NRC (National Research Council) research facilities in the early 1970's.
Based on the concept that realistic reproduction of music requires a ratio of 30% direct sound to 70% reflected sound, Mirage's Omni products are but the latest chapter in the company's success story. Beginning with their first, the Mirage M-1 (chosen by The Absolute Sound as Speaker of the Decade) Ian and the rest of Mirage's design team have managed to rack up literally dozens of awards over the years for their products. Not bad.
 The original implementation of the 30%/70% mix of direct/reflected sound
required a costly, complex architecture of front
&
rear-mounted drivers (operating in phase as
bipolar radiators) and, likewise, complex cabinetry. That changed in 1997 when Andrew Welker joined
Mirage. Tasked with the daunting challenge of creating a loudspeaker system capable of producing the
Omnipolar sound -
without
having to resort to the usage of front
&
rear mounted drivers...
Andrew came up with the Omniguide.
The original implementation of the 30%/70% mix of direct/reflected sound
required a costly, complex architecture of front
&
rear-mounted drivers (operating in phase as
bipolar radiators) and, likewise, complex cabinetry. That changed in 1997 when Andrew Welker joined
Mirage. Tasked with the daunting challenge of creating a loudspeaker system capable of producing the
Omnipolar sound -
without
having to resort to the usage of front
&
rear mounted drivers...
Andrew came up with the Omniguide.
The Omniguide is a saucer-shaped contrivance whose outwardly simple appearance belies the two years of research & engineering that went into its creation. With each Omniguide perched at the top of a line array of 6 woofers (2 active, 4 passive) its easy to imagine these systems throwing a very wide soundstage in the listening area.
Given the v2's enviable pedigree and the unique features found in this system, I looked forward to the opportu nity to setting them up and putting them through their paces.
Mirage Omnisat v2 FS First Impressions
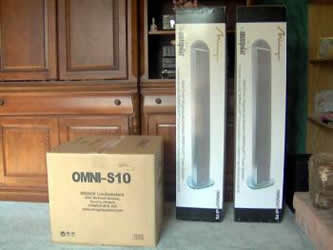 Even before you get them out of their
shipping carton it's obvious these are definitely
not
your average box loudspeaker.
Clearly Mirage have done their homework and obviously appreciate the importance of integrating
performance with appearance. I can recall only a small number of speakers over the years that have
consistently garnered as much praise as these have from those seeing them for the first time. As you
may have already guessed, they consistently earned high Spousal Acceptance Factor (SAF) values.
Industrial art is an apt description.
Even before you get them out of their
shipping carton it's obvious these are definitely
not
your average box loudspeaker.
Clearly Mirage have done their homework and obviously appreciate the importance of integrating
performance with appearance. I can recall only a small number of speakers over the years that have
consistently garnered as much praise as these have from those seeing them for the first time. As you
may have already guessed, they consistently earned high Spousal Acceptance Factor (SAF) values.
Industrial art is an apt description.
The packaging for the v2s is well thought out and lends itself not only to ensuring your loudspeakers arrive at their destination safely, but that they are quickly removed and ready for set up.
Included with each system is a manual, containing among other things in various languages, all the basics you'll need to know to get them setup. The v2s also come with a set of spikes, should you prefer not to use the already installed rubber feet found at the base of each tower. I would have preferred the included spikes to have been a bit longer. They feature a diminutive footprint that respects your space, especially important if you don't have lot of it. They're also 45" high, with a center of gravity found at about 20" above the base. This means that if the they're placed on a carpet thick enough to prevent the spikes from directly contacting the solid floor beneath (as is the case in my listening room), they will tend to lean a bit one way or another. A minor detail. Anyways, once out of the box, there's nothing to assemble and they're ready for installation.
Initial installation of both v2s took all of about 5 minutes. I began with the v2s approximately 1m away from the wall immediately behind them, though over time I shifted them just a bit closer to their current spot, about 2/3rds of a meter (~ 2.2 ft) away from the wall. Laterally, they're separated by about 3m (~10 ft). Unlike most of their more common front-firing counterparts, I found the they needed the wall behind them to sound their best.
Inside Look
 Removing
the grill cloth, then the array of 2 active drivers and 4 passive radiators uncovers an enclosure
partially filled with sound absorbing material. The system's crossover network is positioned
securely within the base of the enclosure and at the top is found a bulkhead separating the main tower
from the two drivers showing in Figure 2.
The cabling running from the network to the topmost
drivers is sheathed in cloth.
Removing
the grill cloth, then the array of 2 active drivers and 4 passive radiators uncovers an enclosure
partially filled with sound absorbing material. The system's crossover network is positioned
securely within the base of the enclosure and at the top is found a bulkhead separating the main tower
from the two drivers showing in Figure 2.
The cabling running from the network to the topmost
drivers is sheathed in cloth.
The lower array features 2 shielded, active drivers and 4 passive radiators, identical in appearance. Loudspeakers employing the passive radiator approach function similarly to vented systems, with a few advantages. Passive radiators are a great choice where cabinet space is at a premium. Arraying the driver/radiator collection vertically helps promote broad horizontal dispersion.
Set-Up
As mentioned earlier, it took all of about 5 minutes to get both v2s out of their shipping cartons, located at their initial positions within my listening room and wired in to the system upstream of them.
The v2s sport the usual gold-plated 5-way binding posts located on the bottom of the cabinet, just above the base on the back. Owing to the location of the binding posts, you pretty much need to be looking at them straight on at set up time. You might want to try wiring them up prior to setting them in their upright position as it's easier to see where the cable/connector is going. Otherwise, if upright, you'll likely end up spending time on the floor thinking there's got to be a better way of doing this
Mirage Omnisat v2 FS Listening Tests
Prior to spending any sort of critical listening time with the v2s, I spent a few months time enjoying extended recreational listening sessions, getting to know the personality, strengths - as well as limits - of these unique loudspeakers. Overall I found them to be tonally neutral, capable of filling a room with an enveloping listening experience. The latter owing largely to their remarkable soundstaging abilities all delivered in an effortless way; a tendency typically reserved for speakers costing thousands more.
 Rumors of their outstanding soundstaging abilities as well as their somewhat diminished
imaging capabilities preceded them, so my first test disc choice was the Wilson Audio
Beethoven/Enescu
CD, (Wilson Audio WCD-8315). A spaced-pair of Schoeps microphones were
employed in the recording. Sonically, the various tracks feature a very close-in recording perspective,
natural for chamber music. The CD comprises 7 duets for piano and violin.
Rumors of their outstanding soundstaging abilities as well as their somewhat diminished
imaging capabilities preceded them, so my first test disc choice was the Wilson Audio
Beethoven/Enescu
CD, (Wilson Audio WCD-8315). A spaced-pair of Schoeps microphones were
employed in the recording. Sonically, the various tracks feature a very close-in recording perspective,
natural for chamber music. The CD comprises 7 duets for piano and violin.
From the opening track it was clear the v2s were quite capable of placing the violin (a Gaurneri) exactly where it should appear (just to the right of the inside edge of the left speaker) within the soundstage and do so with a subtle sense of spaciousness entirely appropriate for the recording venue (Mills College Concert Hall). I have in the past found that lesser speakers tended to largely mute that natural sense of spaciousness.
As an audio engineer, I've recorded on several occasions Steinway Model D Concert Grand pianos in small theatres (100 to 900 seats), just as we find in this particular Wilson CD. The v2s recreated in a number of valid, musically important ways the experience of listening to that particular instrument played in that size venue.
The Steinway Model D was instantly identifiable as a Steinway Model D. Don't laugh... accurate reproduction of the sound of a piano is a formidable challenge for any loudspeaker. Mediocre speakers tend to make them all sound pretty much the same. The reality is, they don't all sound the same. Indeed, I found the Wilson CD, when played back through the v2s, tended to shift my listening perspective from that of audio enthusiast seated comfortably in a home listening room to an engineer in the middle of many sessions past. The listening experience could become that involving, with the right playback material.
Seldom have I heard in a loudspeaker (at any price point) the ability to present a
sense of the space within which a recording was made as I've found these v2s are capable of
reproducing in a home listening environment. On the other hand, if you place extreme,
chiseled-with-a-razorblade image resolution as your #1 requirement in a speaker, these aren't for
you. This is not to say the images aren't focused or stable...
they definitely are, (See
Figures 12
&
13). In trading away a small amount of image resolution, the v2s treat the listener to
an increase in the sense of presence and location of the
various images within their remarkable
soundstage. This approach is, sonically speaking, a refreshing change.
 Next in the collection was
Sinatra Reprise The Very Good Years (
Reprise 9
26501-2).
Next in the collection was
Sinatra Reprise The Very Good Years (
Reprise 9
26501-2).
Curious to further explore the v2's soundstaging and imaging abilities I next auditioned them with a variety of tracks drawn from this CD. (By the way, if you're not familiar with Sinatra's music this is a great introductory CD). I'll focus here on track 14, All Or Nothing At All.
Right off the top the v2s did a great job of presenting the orchestra across the soundstage with Frank right in the thick of it all. But it wasn't until the instrumental breaks in the track were hit that the real eye-popping moments occurred.
When the orchestra wound up, they delivered , emerging from the background to flesh out a huge, spacious soundstage clearly extending beyond the outer edges of both v2s.
Boom! There they were - the orchestra sounded
big
,
baaad
and
there.
(Not bad for a recording done about 4 decades ago).Duly impressed, I couldn
舗
t
help but listen to that track several more times, increasing playback volume a bit with each go. What a
sonic treat! Another track that sounded particularly good was
Nancy.
I listened to the track
several times marveling at how a loudspeaker system with a direct sound amplitude response curve
looking like that showing in Figure 6 could sound so clean, balanced and tonally neutral.
Following Sinatra was Chris Botti's
When I Fall In Love
(Sony, ASIN: B0002VL0K6).
Playback confirmed what was already evident in listening to the Frank CD. The v2s delivered an
enveloping soundstage, populated with focused, stable images, delivered with a degree of effortlessness
surprising for a speaker in this price range. They reproduced Botti's horn work with an obvious
finesse. They managed to convey the unique harmonic character of the horn in way far better than a
number of other speakers I've listened to offered in the v2's price range. Don't know
why, but this is one CD that sounds particularly good when listened to at night.
Next up was Wilson Audio's Ragtime Razzmatazz (Wilson Audio WCD-8212). It was now time to explore the sonic characteristics of the tweeter/midrange driver array (Fig. 1) perched at the top of the tower. I've found the tinny, honky-tonk sound of the Gildameister, Kroeger & Sons upright piano with its hardened-felt hammers featured in this CD another challenge for most speakers.
 The v2s had little trouble reproducing the characteristically fast
attack portion of the amplitude envelope of the notes pouring out of the Kroeger...
the leading
'tick'
sound of each hammer's strike was very clear. Given the quality of the Schoeps
CMC-3 mics used to record the piano and the v2's bandwidth (see Figures 6, 8 - 11), that came as
no surprise. There's also the rich upper harmonic structure found in the very recognizable sound
of a ragtime or honky-tonk piano to contend with. The v2s handled that job well, along with presenting
all the aural cues telling you that not only were you listening to an upright honky-tonk piano, but
that you were close to it.
You could here
all
the details, including the sound of the
pianist stepping on the pedals.
The v2s had little trouble reproducing the characteristically fast
attack portion of the amplitude envelope of the notes pouring out of the Kroeger...
the leading
'tick'
sound of each hammer's strike was very clear. Given the quality of the Schoeps
CMC-3 mics used to record the piano and the v2's bandwidth (see Figures 6, 8 - 11), that came as
no surprise. There's also the rich upper harmonic structure found in the very recognizable sound
of a ragtime or honky-tonk piano to contend with. The v2s handled that job well, along with presenting
all the aural cues telling you that not only were you listening to an upright honky-tonk piano, but
that you were close to it.
You could here
all
the details, including the sound of the
pianist stepping on the pedals.
Talas' If We Only Knew Then What We Know Now (ASIN: B00000AD95) was on my playlist next. Talas is (was?) a power trio that played all over New York back in the '70s & '80s. I remember seeing them in all the rock clubs I used to hang out in back then. Eventually they went on to open for acts like Van Halen, Aerosmith and so forth. I'm pretty familiar with their live sound, so this CD seemed a good choice, especially as I'm also familiar with the venue where the show was recorded.
 I now wanted to assess how the v2s perform when pushed hard, volume-wise. All the
CDs played back prior to the Talas disc were done so at reasonable, polite levels. Now it was time to
rock.
I now wanted to assess how the v2s perform when pushed hard, volume-wise. All the
CDs played back prior to the Talas disc were done so at reasonable, polite levels. Now it was time to
rock.
Up to this point in the critical listening sessions I'd been using the Mirage S-10 subwoofer (a product requiring its own review) with the v2s. (As well, all my recreational listening was done with the v2/S-10 combo. I was impressed with the overall quality of the S-10s performance; including a sub with the v2s is important. For a full range system to deliver a musically satisfying experience, I am of the opinion that LF extension to (at a minimum) about 40 Hz is necessary. In my listening room it sounded like the v2s rolled off at about 55 - 60 Hz, so a subwoofer is pretty much required.
Anyway, as luck would have it, I returned home one day to find a very large box sitting on a pallet in my garage. It was SVS' PB12-Plus/2 subwoofer. Being the incurable audioholic I am, I of course had to immediately uncrate the behemoth and fire it up to see how it would get along with the v2s. I wasn't interested in comparing the $500US S-10 with the $1399US PB12-Plus/2 - designed for very different segments of the market as they are - no valid comparison can be made. Nor should my swapping out subs be interpreted as a negative comment leveled at the S-10; this was just a case of incurable audioholism at work. Or should I say play? Anyway, The SVS is a subwoofer with no fear of pulling stunts like rattling things off shelves, getting your floor bouncing or making your furniture jiggle, with power to spare. Now it was time to rock.
 I gave Billy Sheehan's bass solo a whirl. Given the v2/SVS combo and the amplifier
horsepower upstream of them (a heavily tweaked Hafler DH-500 for the v2s and the sub's own built
in 900W power amp) I had high hopes for this track segment. Speaking in terms of dynamics, it actually
fell a bit flat. Somewhere in the process of turning the moment into a CD track, I suspect just a touch
too much compression was applied.
(Kind of surprising when you consider the bass player produced
the disc!) I've heard various versions of this solo live over the years (maybe I've gotten
spoiled) and the recorded version just didn't measure up. Too bad. This round the v2/SVS system
was not challenged.
I gave Billy Sheehan's bass solo a whirl. Given the v2/SVS combo and the amplifier
horsepower upstream of them (a heavily tweaked Hafler DH-500 for the v2s and the sub's own built
in 900W power amp) I had high hopes for this track segment. Speaking in terms of dynamics, it actually
fell a bit flat. Somewhere in the process of turning the moment into a CD track, I suspect just a touch
too much compression was applied.
(Kind of surprising when you consider the bass player produced
the disc!) I've heard various versions of this solo live over the years (maybe I've gotten
spoiled) and the recorded version just didn't measure up. Too bad. This round the v2/SVS system
was not challenged.
Next was their version of 21st Century Schizoid Man (an old King Crimson tune). Now this was more like it, though still not (in terms of dynamics) quite what I was listening for. The v2s were being pushed hard and they did a great job of playing cleanly within the LF backdrop (or should I say mayhem?) the SVS was laying down (with just a little too much enjoyment). I got the sense they were still holding back, just waiting for something even more challenging.
Last up was Talas 舗 rendition of Max Webster's Battle Star . For this track the v2s were once again pushed very hard and they responded superbly. This was the track that finally did the trick. The sharp attack of the guitar, bass & drums playing in unison at the top of the track sounded great, with the v2s providing the clean leading edge.
 Earlier, when I'd had one of the v2s disassembled, I noticed tucked away in a corner of
the crossover network circuit board an iron-cored inductor. Given the well known core saturation
problems inherent to these devices I was on the lookout for any telltale signs of punch through due to
core saturation at high input power levels.
I didn't notice any; even at the levels I had
been driving the v2s at for this part of my critical listening session. The v2s are built with a
seriously over-specced inductor so that at any power level it would likely ever encounter the core
would not saturate.
Earlier, when I'd had one of the v2s disassembled, I noticed tucked away in a corner of
the crossover network circuit board an iron-cored inductor. Given the well known core saturation
problems inherent to these devices I was on the lookout for any telltale signs of punch through due to
core saturation at high input power levels.
I didn't notice any; even at the levels I had
been driving the v2s at for this part of my critical listening session. The v2s are built with a
seriously over-specced inductor so that at any power level it would likely ever encounter the core
would not saturate.
Whether I'm part of the audience just enjoying a show or busy at work behind a mixing console, where it comes to live music there are a number of cues I listen for that tell a great deal about both the quality of the mix and the quality of front of house system. One of those is the clarity of the vocals and where they sit within the mix and the vocals presented in this track - whether it be Billy singing lead solo or Billy, Paul & Dave singing in harmony - never wavered in their clarity. I was impressed yet again by the v2s.
Tough gig singing (at those levels) over the top of the SVS, but the v2s did it.
Omnisat v2 FS Measurements and Analysis
It's tough to make sense of the direct sound amplitude response plots of a loudspeaker system designed purposely to provide the listener with more reflected than direct sound let alone reconciling the measurements with the subjective impressions. These sounded well balanced and tonally neutral. They measured as anything but. What can we gather in these measurements that will substantiate the subjective assessment?
In figures 6 ,9 -12 we see a pair of amplitude response curves. In each case the blue plot is the on-axis amplitude response and the red plot is amplitude response plot as measured 30°, 45°, 60°, 90° and 180° off-axis.
In the LF end of each graph we see the typical passive radiator system roll off characteristic. Note that these are direct sound measurements, done with great care taken to ensure that the effects of any nearby boundaries are excluded. Hence, the LF roll off appears to be much higher (~ 85 Hz) here than that encountered when the system is in use within the LF-enhancing confines of your favorite listening room. There you can expect an LF roll off somewhere in the neighborhood of 55Hz 舑 60Hz.
It's also clear in viewing the amplitude response plots that the v2s are directing substantial amounts of their acoustic output in directions other than front & center. Even at 45° and 60° off axis, the similarity between the on and off axis plots are remarkable. And the difference in plots between the on-axis response and 30° is remarkably minimal out to about 15 kHz, as can be seen in figures 6 and 7.
Given that fact and how well matched in terms of output the v2s were as evidenced by the on-axis ratio plot in Figure 8, it comes as no surprise they were capable of projecting a huge soundstage, populated by focused, stable images.
Omnisat v2 FS Measurements and Analysis (cont.)
The impedance plot shows us the typical characteristics of a passive radiator system, evidenced by the peak-valley-peak curve centered at ~ 85Hz. The curve minimum was just under 4 ohms.
Owing to the inductive character of the impedance in the neighborhood of that minimum, as evidenced by the positive-going slope of the phase curve, some amps might strain a bit when reproducing the segment of the spectrum in the neighborhood of the minimum, especially at high playback levels. Most shouldn't have any problem at all. Notable too is the absence of any peaks indicative of unwanted pipe resonances.
From Andrew Welker (System's Designer), on the absence of pipe resonances:
My idea was to allow the top woofer to act full-range at the bottom end, but in a sealed sub-enclosure. This reduced the height (length) of the cabinet volume "seen" by the front firing woofers, and moved the main standing wave slightly lower in frequency. We also found that by staggering the positions of the front mounted woofers and passives we were able to "drive" the cabinet at points that would reduce the effect of the standing wave. The side benefit is that we have two different low frequency alignments (sealed and passive radiator) adding together and by adjusting the parameters of each section we are able to achieve a seamless blend at the bottom end. All of this adds up to excellent bass performance in a cabinet with very little internal volume.
Focusing now on that 6kHz - 20kHz portion of the spectrum, the generally downward slope of the amplitude response plot is quite noticeable. With a front-firing loudspeaker this HF downward slope would indicate, subjectively speaking, a very recessed top end. However, when you take into account that the v2s (when operating in this portion of the spectrum) by design radiate energy all over the room, what appears to be a recessed top end will in fact sound like a clean, respectably smooth HF response characteristic. And it does so because its not only the on-axis response that counts but also the total amount of energy dumped into the room, on and off-axis by the system. It's that sum, perceived by the listener, that counts.
EQ this portion of the v2s direct sound amplitude response flat (as I did for the fun of it) and you'll end up listening to what'll sound like a pair of loud, annoyingly efficient tweeters. So, for a system with the radiation characteristics such as that possessed by the v2s, that downward sloping amplitude response plot is exactly what you want to see in a measurement.
Mirage Omnisat v2 FS Recommendations
I’ve purposely saved mentioning one of the v2’s particularly notable strengths for last.
In the listening room I chose for the v2s there sits between them a large screen TV. So it seemed only natural to make use of them for watching movies, something I’ve done many times in the past with many other loudspeakers.
I’ve often found that if you weren’t sitting in the sweet spot (particularly true where it comes to systems sporting 1st order crossover networks) the sound quality suffered. With the v2s - and their ability to fill the listening space with a huge soundstage - there wasn’t a bad seat in the house, so to speak.
The seating area within this particular listening room can accommodate comfortably 10 to 15 people. With the v2s in place, watching movies had become a social experience. Gone was the situation where of the 10 – 15 listeners there were only one or two lucky enough to be sitting in the sweet spot enjoying the movie’s soundtrack to its maximum advantage.
If you’re interested in enjoying movies at home but are not yet prepared to make the investment required for piecing together a proper home theater system, then I would highly recommend the v2s as a terrific alternative, especially when coupled with a subwoofer.
The Score Card
The scoring below is based on each piece of equipment doing the duty it is designed for. The numbers are weighed heavily with respect to the individual cost of each unit, thus giving a rating roughly equal to:
Performance × Price Factor/Value = Rating
Audioholics.com note: The ratings indicated below are based on subjective listening and objective testing of the product in question. The rating scale is based on performance/value ratio. If you notice better performing products in future reviews that have lower numbers in certain areas, be aware that the value factor is most likely the culprit. Other Audioholics reviewers may rate products solely based on performance, and each reviewer has his/her own system for ratings.
Audioholics Rating Scale
 — Excellent
- — Very Good
- — Good
- — Fair
- — Poor
| Metric | Rating |
|---|---|
| Build Quality | |
| Appearance | |
| Treble Extension | |
| Treble Smoothness | |
| Midrange Accuracy | |
| Bass Extension | |
| Bass Accuracy | |
| Imaging | |
| Soundstage | |
| Dynamic Range | |
| Performance | |
| Value |