
McIntosh XLS340 Loudspeakers
McIntosh XLS340 Floorstander
- Product Name: XLS340 Loudspeakers
- Manufacturer: McIntosh Laboratory, Inc.
- Performance Rating:


- Value Rating:
- Review Date: October 31, 2006 09:24
- MSRP: $ 7000/pair retail
| Frequency response (+/-2dB): 65Hz-34kHz Typical In Room Response (-6dB): 38Hz-34kHz Nominal Impedance: 8 ohms Sensitivity (2.83V @ 1m):85 dB Tweeter: (5) 1″domes Midrange: 6½″cone Woofer: 2 8″cones |
Crossover frequencies: 250Hz, 1.5kHz Crossover type: Combined first, second, and third order design Amplifier power: 400W peak input Dimensions (H×W×D): 44 1/16″× 14 3/4″× 12″ Weight (each): 69 lbs Enclosure type: sealed |
Pros
- Airy treble that is clear and detailed
- Rich midrange
- Smooth sound that is free from graininess
- Overall, excellent build quality
Cons
- Limited bass output requires a subwoofer
- Downside to the rich midrange is heavy voicing at upper bass/lower midrange
- Vinyl on the top and bottom of the cabinets
The company behind the speakers
At this price level, such speakers are a near statement product from a company known for its statement products; fine performance is an expectation. McIntosh Laboratory, Inc. is one of the venerable heavy weights of the high fidelity audio world and has earned an enviable reputation and name recognition, particularly for producing quality high-end amplifiers.
 McIntosh Laboratory began as McIntosh and Ingles Consulting, a radio station and sound system design consultancy, by Frank McIntosh in Washington D.C. in 1942. Poor quality of the amplifiers available at the time lead Frank to build his own amplifiers; typical designs of the time were high distortion at low power and few even met published specifications. In 1947, the firm was renamed McIntosh Scientific Laboratory, and by 1949, the company was incorporated as McIntosh Engineering Laboratory. McIntosh's first foray into loudspeaker design occurred as far back as 1952 with the F100 speaker. Only about five units sold and the line was discontinued until 1967 when McIntosh hired Roger Russell to develop a speaker line; by 1970, the McIntosh ML-1C loudspeaker was in production.
The XLS 340 loudspeakers are among the latest products offered by McIntosh. According to McIntosh, XLS product line is intended for both home theater and stereo applications with accurate reproduction as a primary design goal. At this price level, such speakers are a near statement product from a company known for its statement products; fine performance is an expectation. In the review of such products, one must keep in mind that sonic subtleties and nuance become disproportionately important to describe differences in products that are at the top level of performance.
Design and Construction
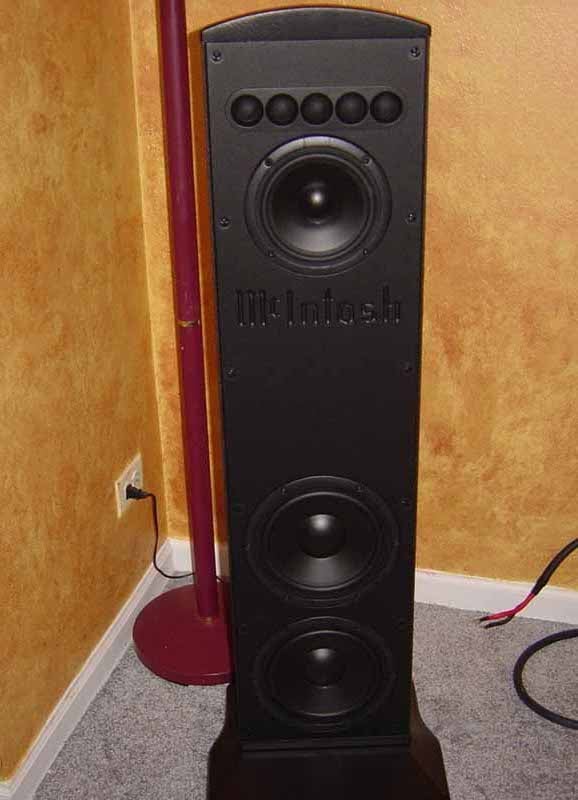
 The XLS340's are a moderately tall, thin column array of drivers adaptable to floor or wall mounting with an optional in-wall mounting kit also available. The cabinets are made of extruded aluminum and are equipped with mountings for screws to attach, including floor bases or wall mounting brackets. The cabinets also are internally braced to further increase cabinet rigidity. Included with the bases are both flat caster and cone floor supports allowing for placement in either hard floored or carpeted rooms. With the base installed, the total weight of each speaker is a substantial 69 pounds. Both the base and the cap appear to be constructed of MDF and covered with what the users manual describes as a "thermal vacuum formed durable surface in a textured black finish"; sounds like a rather elaborate euphemism for vinyl to me.
 Use of extruded aluminum cabinets has several advantages. The cabinets are a thin profile design with the intent of wall mounting the XLS340's alongside flat panel TV displays as an option. Using aluminum with this constraint allows for thinner cabinet walls to maximize internal cabinet volume for bass response, and yet still be stiff enough to minimize cabinet vibration modes. Also, in consideration of placement near a TV, all of the drivers have shielded motor structures for use near all TV types.
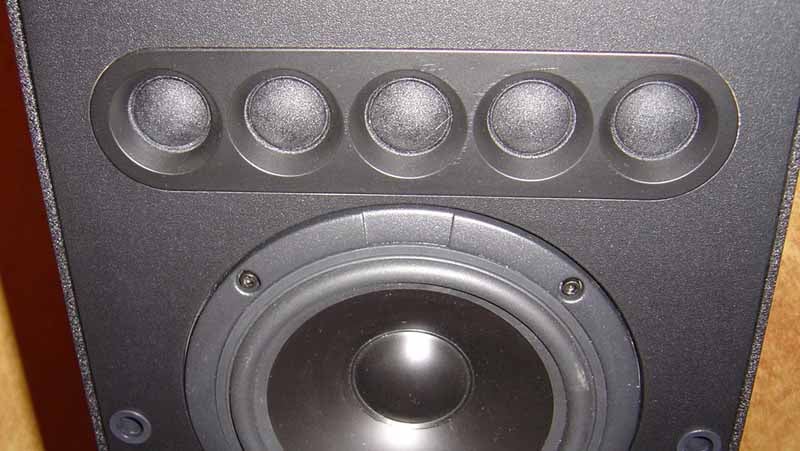
Enclosures are a sealed design consisting of a five tweeter array and a 6 ½" midrange driver mounted at the top of the cabinet below the tweeter array, and dual 8" woofers mounted towards the bottom. The tweeter array is a soft dome textile design, while the midrange and bass drivers appear to be polypropylene cones, but the product documentation does not specify. McIntosh uses the same midrange driver and tweeter array for all the speakers in the XLS line. The goal here is to voice match all the speakers for flexibility when selecting between models for use in multi channel applications.
 McIntosh states that multiple drivers were used to increase the power handling capabilities of the speakers. Precision crossovers are said to provide even frequency response with +-2dB specified in the product literature. The crossover network also features an automatic, solid state protection device in the event of an over load.
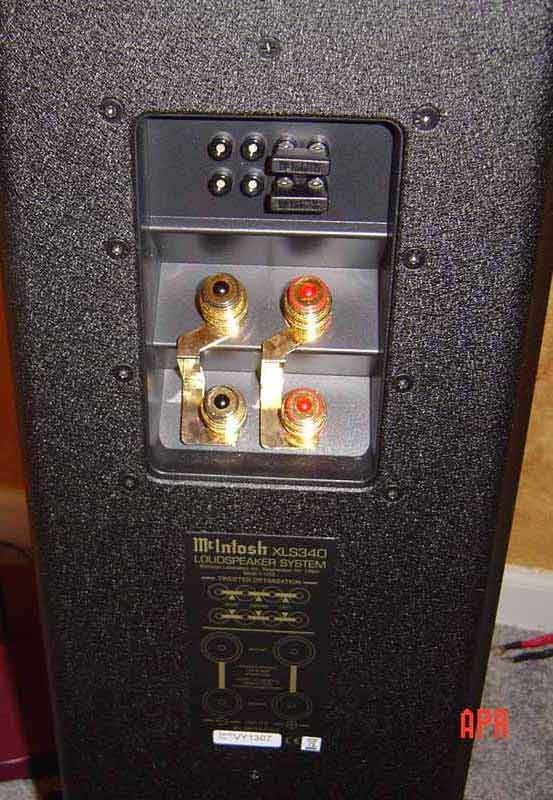
The tweeters used in the XLS340's are described as a Bessel Function Tweeter Array that McIntosh says allows each driver in the array to operate at lower individual power but still perform as a point source with broad dispersion characteristics with lower distortion. On the back of the cabinet, above the speaker terminals, is a pair of jumpers to optimize the phase relationship of the array for left, center, and right channel applications; presumably this is how the Bessel function is utilized as there is little by way of explanation in the product documentation. Also, the array is said to be insensitive to horizontal or vertical alignment allowing placement flexibility without compromising sound quality.
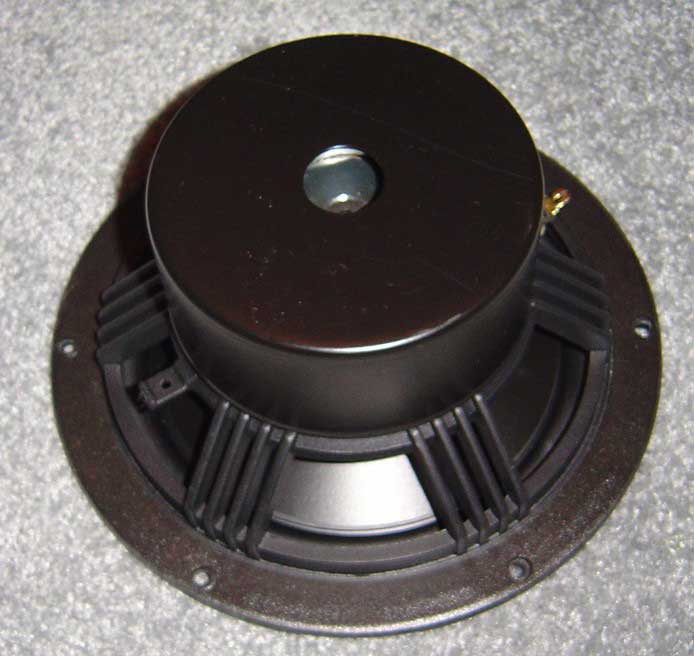 Another design feature cited by McIntosh is the patented LD/HP motor structure used for midrange and bass drivers: U.S. patent number 5,151,943 : "Low Distortion Dynamic Loudspeaker. The voice coil pole has aluminum shorting rings at each end that are said to extend the linear operating range of the magnetic field which increases the linear excursion capabilities of the drivers, reducing distortion by 10dB. McIntosh also points out the added benefit of increased heat dissipation in the design that in turn, increases the power handling capabilities of the drivers. It is interesting to note, I could not find any information on McIntosh's web site that could lead me to the actual patent, but I did find it on the site of Roger Russell, former Director of Acoustic Research at McIntosh Laboratory, on a page for the vintage XR250 speaker system , the product for which the patent was originally applied. It is also interesting to note that this web site reveals the considerable history of the products and personnel who have made McIntosh what it is today, little of which is available on the company site.
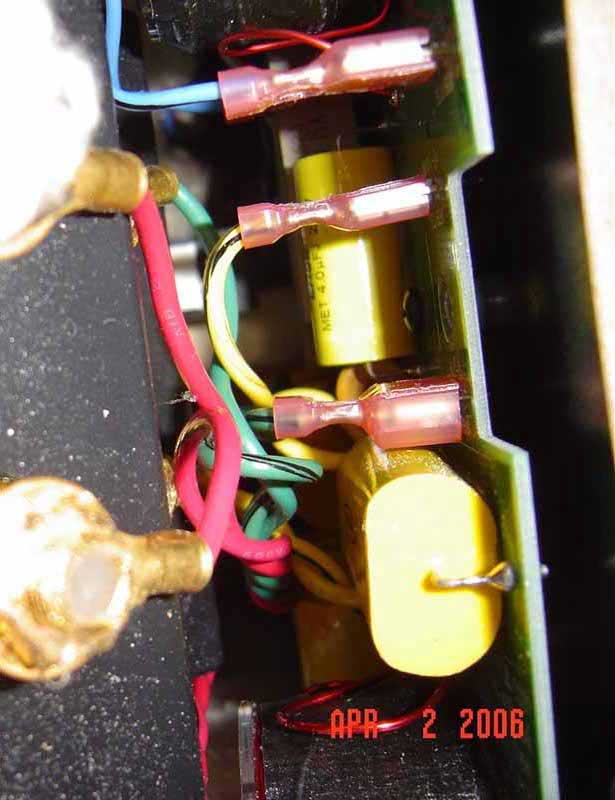
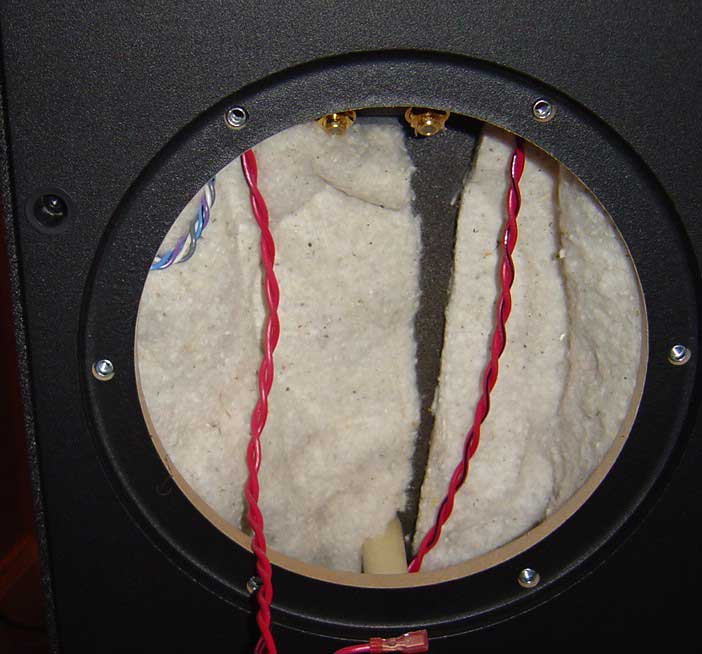 Inside, the cabinets are filled with a treated cotton damping material on all sides. The crossover network is mounted on the inside face of the MDF baffle between the midrange and woofers. Drivers feature cast baskets and magnet covers with 18 gage internal wiring.
The cabinets are internally braced using wooden dowels attached at midpoint of the front baffle coupled to the back of the aluminum enclosures at several locations.
Listening Tests & System Setup
The XLS340's arrived by freight carrier in four boxes strapped to a wooden pallet and wrapped in plastic. The towers were in the two larger boxes and the mounting hardware and bases for floor use were in the smaller boxes. Some assembly is required. There are some foibles in the product documentation that I noted during assembly and while writing the review.
Attachment of the cabinet to the base involves the use of an unmentioned 7/16" socket wrench, only determined by trial and error, to tighten the supplied machine bolts that make the connection. While installing the base, do not follow the recommendation of placing this 69 lb speaker on top of the empty box. As a structural engineer, I cannot recommend using cardboard for support: if the side walls do not crush or buckle, or the box flaps do not cave in, eccentric placement of the speaker on the lightweight box may cause it to overturn. Find another flat, sturdy surface to use and put down some sort of blanket, cloth, or use the packing plastic to protect both the finish of the speaker and of the support surface.
I also found a number of discrepancies between the product specifications available from various sources. Specifications quoted in the product manual, included with the speakers, differed from those quoted in the product brochures available on line from McIntosh as to crossover frequencies, sensitivity, dimensions, and weight of the speaker. The specifications I have listed in the review are from the supplied manual. The manual also internally contradicts itself, suggesting in the body of the text that all the XLS models are designed for use with amplifiers up to 600 watts, while the specifications indicate 600 watts only for the XLS360, with the XLS340 and XLS350 at 400 watts and the XLS320 at 250 watts maximum power handling.
Editor's Note on Comments in Owners Manual
In the owner's manual, McIntosh makes a point of discussing that the XLS series speakers were designed for accurate home theater as well as musical reproduction. They go so far as to suggest that only dynamic range and high SPL capability is required for home theater, while music is "by definition" harmonious and requires low harmonic and intermodulation distortion. I personally disagree with both statements; I find this sort of distinction between movies and music to be irrelevant as accuracy is accuracy. While distortion in an explosion and other special effects may not be obvious, I would prefer to hear them as recorded, not what an inaccurate speaker invents. This statement also neglects the fact that most movies come with a score, often orchestral, that requires accurate music reproduction. As to music being inherently harmonious, this statement obviously discounts most of the serious work in music through the twentieth century including the rise of atonality and other modern forms, but also that the tonal relationships between the fundamental frequency of a note and its higher order harmonics become increasingly dissonant. Octaves are geometric progressions while harmonics are an arithmetic series. For example, the ninth above the fundamental frequency is only a major second from the third octave of the fundamental frequency. Chords built on intervals such as these show up in modern music including such forms as Jazz.
Perhaps some of the above items are trivial, while some are not. I personally would expect all of the i's to be dotted and all of the t's to be crossed with a product that is represented to be of this caliber. Hopefully the discrepancies can be rectified for the future.
Listening
With accurate reproduction in mind as a primary design goal, I listened in to the XLS340's using both my PS Audio amplifier and my Rotel A/V receiver in two-channel mode utilizing bass management. Noting the specified frequency response, I listened both with and without subwoofers, but the review mainly considers the sound quality of the XLS 340's without the subs to isolate their performance. In general, I consistently noticed several aspects of the sound produced by the XLS340's.
Treble was clear and detailed, and open at the top end. Individual instruments were given a sense of space with, one might use that ever-popular word: air, between them. The micro dynamic presentation was very good. The midrange was rich with a warm, full sound, but with some source material, could almost seem exaggerated. The upper mids and treble were very smooth and free of any graininess. In this register, the presentation of musical instruments sounded natural and retained their timbre.
The imaging presented by the XLS340's was distinct with a wide sound stage, but not as three dimensional as I am used to. My preamplifier has a control to bypass the active gain circuitry; this is a purist approach with the goal of minimizing signal path and thereby distortion. I typically use this mode as the sound is more natural and with a less electronic character, but the trade off is a slightly flatter sound stage which is of little consequence to my reference speakers. In this mode, the XLS340's sounded somewhat flat so I had to revert to using active circuitry to push dynamics and three dimensionality out of these speakers. I also noticed that the sound stage width seemed overly sensitive to volume with these speakers, and in general, I found that the XLS340's needed to be pushed to sound their best.
Bass output, as expected from the manufacturer's specifications, was lean but not absent from the XLS340's musical presentation. The downside to the richness in the upper mids was at the transition between upper bass and lower midrange: deep male vocals could sound somewhat chesty and the upper register of bass instruments seemed slightly exaggerated. The sound here was a little heavy, one could say, thick. Detail was not lost as a result, as often is the case, but there seemed to be too much and this was consistent through all the recordings I listened to. In that context, it could be considered a trade off in voicing, and becomes a matter of one's personal preferences. However, when I teamed the XLS340's with a subwoofer, I found that the overall sound was much more balanced; the heaviness was not as obvious as it was without the sub. With low end support, I also found the overall character more dynamic with improved presence throughout the audible range.
Listening Sessions
Talk Talk: The Color of Spring (Remastered)
 Some readers may only recall the earliest version of this band as an 80's new wave synthesizer band, but much like the moths and butterflies that populate the album's cover, this band went through a complete metamorphosis starting with this album. Acoustic instruments, strings, and choral arrangements abound on a road to music that has more to do with experimental ambient jazz than with anything else.
Acoustic instruments in the upper register, such as the guitar, had a natural timbre.
Throughout the album, the XLS340's revealed detail, inner parts, and the various instruments had clear separation. Treble was open and airy and the midrange warm with acoustic instruments such as guitars, percussion, cymbals, vocals, and choral parts sounding distinct and full. Mark Hollis's vocals do not always seem to have articulation as a priority; he often uses his vocals more as another instrument in the arrangement to support the emotions conveyed by the music. Using the XLS340's, the vocal clarity was noticeably more distinct than I typical find with many speakers and ambient cues contained in the recording were also very clear.
The album opens with "Happiness is Easy" which utilizes a children choir. The choir parts were clear and well imaged; the overall sound was smooth and airy with instruments clearly separated. Acoustic instruments in the upper register, such as the guitar, had a natural timbre. Drums and double bass were detailed, but somewhat over present at the upper bass. During "IDon't Believe In You", the instrumental separation was again good; case in point was an often-buried harp part before the bridge that was distinguishable with the XLS340's. "Time It's Time" also features choral arrangements supporting the lead vocals along with layers of synthesizers, acoustic and electric guitars, percussion, and piano occurring simultaneously. Many lesser speakers will often make mush out of such a full arrangement, homogenizing the sound into one mass, but here all the parts were distinct with the sound once again both smooth and open.
Radiohead: Kid A
 Radiohead always makes for a good test of transient response with the multitude of crisp, ever changing electronic sounds that populate their albums. Throughout, the XLS340's presented an open sound with crisp transients and the subtleties of inner parts within layers of electronics audibly dissected. Sound occurring in the treble and upper midrange was well projected and the imaging conveyed a wide soundstage. Vocals were palpable and well centered with the sundry layers of overdubs distinct.
Listening to the title track, the XLS340's presentation was smooth with ample detail; every sound had its own space. Subtle details in the synthesized bells sounds were distinct and well projected beyond the separation of the speakers. Vocals were focused in the center with percussion behind and the midrange presentation was full. Individual wind instruments in "The National Anthem" were distinct but overall sound was weighted towards the upper bass, with little depth. Multiple acoustic guitar parts in "How to Disappear Completely" were well separated, conveying a sense of space between them. Vocals during "Optimistic"were palpable and resolution of the various guitar parts was high enough to clearly distinguish all the notes within the chord structures.
XTC: Apple Venus
 Apple Venus is perhaps the artistic highlight of XTC's creative musical career. The typical cleverness of XTC's song writing is complimented with lush arrangements that transcend typical rock music fare.
Open and airy treble, warm midrange, considerable detail, but exaggerated upper bass define the character of the XLS340's musical presentation with this album. Instruments were well separated with good sound stage width, but this width was volume dependent. While this was generally true for all the albums I auditioned, this album seemed particularly sensitive to the XLS340's in this respect. The reduced three dimensionality also impacted the overall dynamic presentation leaving this well recorded album somewhat flat sounding.
"River of Orchids" is a piece that grows and evolves into a fugue with pizzicato violin over layers of vocal harmonies, synthesizers, with a muted trumpet part soaring over the top, all of which the XLS340's presented as distinct sonically and spatially. "Knights in Shining Karma" displayed the strengths of the tweeter array: percussion, such as the wood blocks and cymbals, and the electric guitar had that sense of air, of space at the upper end and inner parts of the vocal harmonies were distinct. Subtleties in the processing and playing of the electric guitar were evident with these speakers. "Greenman" was thick at the upper bass, but detail and instrumental separation between the bassoon, strings, and mandolins was handled cleanly. Also of note was the flugel horn part on "The Last Balloon"which was quite realistic sounding.
Nine Horses: Snow Borne Sorrow
 Nine Horses is the latest musical venture from David Sylvian and many of his frequent collaborators. It is an eclectic mix of atmospheric, world music, and jazz. The album brims with detail and subtlety within the layers of vocals and instrumentation.
David Sylvian's generous baritone both benefited and suffered from the sonic character of the XLS340's: vocals were simultaneously rich but chesty. The palpability of the vocal presentation gave a definite quality of presence to Sylvian. The sonics on this album were smooth with these speakers, the multitude of instruments used imaged well, instrumental timbres were realistic, and they were all well separated. Bass and percussion displayed some looseness at the midrange/bass boundary.
The album opens with "Wonderful World". Vocals were smooth and had presence, but were heavy. Individual singers in the background chorus were also clearly defined. The XLS340's were able to unentwine the musical tapestry of electric and acoustic piano, strings, winds, bells, and keyboards allowing them to image properly while maintaining warmth. The saxophone part in "The Banality of Evil" was presented with exceptional realism, both in space and detail. Movements of the player's embouchure were audible in subtleties of the performance and a slight vibrato in the playing. "Snow Borne Sorrow" received due attention from the XLS340's with crisp transient response through all of the layers of electronic sounds that are built up to form this song, but the sound was also somewhat heavy at the upper bass. Vocals, overdubs, and background singers were separated and distinct, but Sylvian was again rendered as chesty. The trumpet and other wind instruments in this piece had a solid presence with subtleties of performance well defined.
Frank Zappa: Hot Rats
 Hot Rats is probably the best known of Frank Zappa's exploits in jazz composition; the album is the original home to "Peaches en Regalia" which found its way into performance often. The goal of owning high-end gear is to make every recording sound live, to be able to separate every sound from all the others, and to hear every nuance of each sound; a much taller order with older recordings. I choose this album because older recordings are sometimes more sensitive to equipment quality; I personally have found that good quality gear can find buried strengths in a recording that never have a chance to surfaces with run of the mill equipment. As an older recording, quality is actually good, considering its era, but it still suffers of sounds that blur together, some brightness in the treble, and a bit of looseness in the bass.
In the upper register, the XLS340's did well: they were able to pull presence and space out of the individual instruments while minimizing some of the brightness and smooth out the overall sound of this recording. Instruments were more distinct and detailed that I have heard on some gear. On "Willie the Pimp" Captain Beefheart sounded as smooth as one can expect him to sound. The guitar and violin unison was sonically separable, and inner parts of chords during the guitar solo were also clearer than typical. On "Son of Mr. Green Genes", upper treble was open, the baritone sax was given life and made present, and inner wind parts were distinguishable.
Prokofiev: Scythian Suite; Stravinsky: Le Sacre Du Printemps (The Rite of Spring) Dallas Symphony Orchestra, Eduardo Mata (Dorian Records)
 Both of these pieces were challenging musical composition for their time. The 1913 premiere of "Le Sacre Du Printemps" at Sergey Diaghilev's Ballets Russes prompted a riot and much controversy. Not to be outdone, Prokofiev attempted the same feat the following year with "Ala and Lolli", the original version of the "Scythian Suite" for ballet. Perhaps fearing that Prokofiev could repeat the previous years incident, Diaghilev asked Prokofiev to abandon the piece and commissioned another. While the ballet was not performed, Prokofiev did not abandon the piece that premiered in its revised form for orchestra in 1916.
These pieces careen suddenly between furioso and dolce. I selected them because they are both dynamic and challenging in terms of reproduction. It was an afterthought on my part that these masterworks of the twentieth century are case in point for music not being inherently harmonious as was intended by the composers.
Once again, treble was clear and free of any graininess with the XLS340's. In this register, the sound was crisp and exposed detail. Instrumental separation between upper strings, brass, and woodwinds revealed details within the inner parts. Hall ambiance was well reproduced by the speakers presentation, but sounded somewhat recessed during quieter passages. I associate this with my observation about the speakers requiring a certain amount of push that would not be present in quiet orchestral passages. The midrange had its typical fullness, but again at the bass boundary, while detailed, there was some looseness at the upper end. In particular, I noted bass drum parts that were less controlled than my expectations during both pieces.
Loudspeaker Measurements
Measurements were performed using the Sample Champion program developed by Paolo Guidorzi of Purebits. The program is a Maximum Length Sequence (MLS) program that can generate an impulse response from this pseudorandom signal. The Fast Fourier Transformation is applied to the impulse response to generate the system frequency response. The operating principle is the same as that of the well known MLSSA program.
I received speakers with the sequential serial numbers: VY1307 and VY1308. I have used these serial numbers to identify each test measurement taken.
Test samples were taken using 16 bit resolution with a 48 kHz sampling frequency. Fast Fourier Transformations were performed at 64K allowing for a frequency resolution of .73 Hz, which is more refined than even 1/24th octave resolution at the lowest octave; the A0 key on the piano has a fundamental frequency of 27.5 Hz. Quasianechoic response was compiled using a Blackman-Harris, half right window based on crossover frequencies provided in the owner's manual. All measurements were taken with the phase response jumpers set to the center position unless noted otherwise.
Figure 1: Impule response of unit 1307.
The first figure is the normalized impulse response captured from unit 1307. A theoretical impulse response should appear as a single pulse up from zero and back for a single driver. This is a composite response for a three-way speaker system, and while the multiple drivers each have their own peak, a speaker with well damped behavior should have its dynamic response die out with few additional oscillations.
Figure 2: Freqeuency response of unit 1307 on axis and 30 degrees of axis.
The second figure is of the frequency response for 1307 for on axis (green trace) and 30 degrees off axis (red trace). Initial lobbing of the response begins between 1000 and 2000 Hz, near the crossover frequency for the tweeter array.
Figure 3: Comparison of units 1307 and 1308.
I also compared frequency response for the two units, 1307 (green trace) and 1308 (red trace), shown in the third figure. Response variations between the two units are typically within +-2 dB over the quoted frequency response except for a bump centered near 2300 Hz in the response of 1308.
Figure 4: Cumulative spectral decay of unit 1307.
The next figure shows the cumulative spectral decay based on the impulse response shown in figure 1 windowed over 4 milliseconds for quasianechoic response. The plot shows decay over a 60 dB range for frequencies in the midrange and treble regions.
Figure 5: In room response of units 1307 and 1308.
The final plot is of in room response. Unit 1307 (green trace) was measured from the left stereo position while 1308 (red trace) was measured for the right stereo position. Both speakers were measured with their phase response jumpers adjusted to the corresponding left and right positions.
Conclusions & Recommendations
The McIntosh XLS340's are at a price point where speaker manufacturers present statement or near statement products. There is stiff competition as companies roll out their best. Any consideration for such a purchase requires personal auditioning, perhaps more so than with lesser products. For most people with typical incomes, such a purchase is a rare event and one may have to live with their choices for a considerable time.
Concepts such as value require a more careful definition to be correctly applied with products in this category. One does not buy such a product with bang for the buck in mind. A broad definition of value does not apply simply because diminishing returns are significant at the top. On the other hand, if framed only as relative comparison to other products that are peers, a useful measure is still possible.
As for expectations of build quality based on reputation of the manufacturer and price point, the XLS340 speakers are certainly well made. Flexibility is also a strong point; with the ability to use the XLS340's as floor standing, wall mountable, or in wall speakers with variable orientation there are few limitations.
The XLS340's have much to recommend, but not without some caveats. In the upper midrange and treble, the speakers have many of the fine sonic qualities that one would expect from speakers in this class. But whether by design or otherwise, these speakers will require a good subwoofer, which is potentially an added expense. Not an issue for home theater were use of a sub should be anticipated, but for stereo applications, something to consider. Without a sub, bass output is limited and uneven. With a subwoofer, I obtained the best results using proper bass management; the combined sound becomes much more natural and convincing. At issue here is that most two channel listening systems, which are still regarded by many as the best suited for serious music listening, do not typically have bass management.
The ratings I have given the XLS340's have to reflect that McIntosh emphasizes that this design is capable of accurate musical reproduction but does not suggest any need to include a subwoofer for accurate deep bass reproduction. Value is also impacted because at this price, many competitors offer models capable of full range bass reproduction under anechoic conditions, often deeper than many of the dedicated subwoofers available on the market can go, but these products typically cannot be hung from the wall. Life is full of trade offs, even at the top.
The Score Card
The scoring below is based on each piece of equipment doing the duty it is designed for. The numbers are weighed heavily with respect to the individual cost of each unit, thus giving a rating roughly equal to:
Performance × Price Factor/Value = Rating
Audioholics.com note: The ratings indicated below are based on subjective listening and objective testing of the product in question. The rating scale is based on performance/value ratio. If you notice better performing products in future reviews that have lower numbers in certain areas, be aware that the value factor is most likely the culprit. Other Audioholics reviewers may rate products solely based on performance, and each reviewer has his/her own system for ratings.
Audioholics Rating Scale
 — Excellent
- — Very Good
- — Good
- — Fair
- — Poor
| Metric | Rating |
|---|---|
| Build Quality | |
| Appearance | |
| Treble Extension | |
| Treble Smoothness | |
| Midrange Accuracy | |
| Bass Extension | |
| Bass Accuracy | |
| Imaging | |
| Soundstage | |
| Dynamic Range | |
| Performance | |
| Value |
Professionally, David engineers building structures. He is also a musician and audio enthusiast. David gives his perspective about loudspeakers and complex audio topics from his mechanical engineering and HAA Certified Level I training.
View full profile