
Onix x-ls Bookshelf Loudspeaker Review
- Product Name: x-ls
- Manufacturer: Onix
- Distributor: AV123
- Performance Rating:


- Value Rating:
- Review Date: February 09, 2006 19:00
- MSRP: $ 199
Sensitivity (2.83 V/1m, averaged, from 300 to 3000 Hz): 87.5 dB spl
Rated Impedance: 6 Ω
Frequency Response (- 3 dB): 60 Hz to 23 kHz
Resonance Frequency: 42 Hz
Bass Principle: Bass reflex
Crossover frequency: 1.70 kHz
Connection: 5-way binding post
Product Weight: 18.2 kg (40 Lbs) per pair
Cabinet Dimensions (W x H x D): 216mm x 337mm x 305mm
Pros
- Very clean playback
- Well-balanced frequency response
- Stable soundstage
- Incredible value
Cons
- Noisy port; flared one end only
- Crossover network and network components not oriented to minimize crosstalk
Onix x-ls Build Quality
Not long ago, Gene offered me the opportunity to review a first production of a new loudspeaker system by AV123. I jumped at the opportunity as I'd seen their name pop up in a number of online forums and read the reviews of some of their other products. I was curious to see what the chatter was all about. Soon thereafter, The Onix x-ls, a 2-way, vented cabinet system, arrived.
AV123 has been in the internet-direct entertainment market since its founding in January 2000. Today they market, along with speakers, a selection of cables, electronics and a variety of useful extras. The company's founder, Mark Schifter, a consumer electronics industry veteran, has been responsible over the years for bringing to the market products that don't bust the budget and get the critics raving (eg: Audio Alchemy DDE v1.2 ) I figured with the company's founder carrying a pedigree like that there 舗 d likely be something to commend these speakers. And I wasn't disappointed, that's for sure!
First Impressions
When the X-LS arrived I was a bit surprised at the size of the shipping container: It seemed large for something housing a pair of 2-way bookshelf speakers. Popping the thing open I found packed within the outer container a second container and inside that were located the speakers. Size mystery solved. This packing approach is a great way to ensure your system arrives intact and in working order.
 Each speaker, wrapped in a plastic cover and well protected by the
container-within-a-container, arrived unscathed and ready to rock. Accessory-wise, the package included
spikes that can be bolted into the base of each cabinet, should you feel the need to use them. Along
with the spikes are supplied discs for use with the spikes, should you need to avoid poking holes in
whatever you have the speakers perched on. The speakers did not come equipped with grill clothes and
provided for no means to attach one. Cable attachment is accomplished with the usual 5-way binding
posts.
Each speaker, wrapped in a plastic cover and well protected by the
container-within-a-container, arrived unscathed and ready to rock. Accessory-wise, the package included
spikes that can be bolted into the base of each cabinet, should you feel the need to use them. Along
with the spikes are supplied discs for use with the spikes, should you need to avoid poking holes in
whatever you have the speakers perched on. The speakers did not come equipped with grill clothes and
provided for no means to attach one. Cable attachment is accomplished with the usual 5-way binding
posts.
A bit about the cabinet. The shipping documents indicated the finish was white maple and indeed it was. The white maple veneer is banded across the cabinet in a clever and aesthetically pleasing way that I've not seen done before. It all adds up to an intriguingly attractive product that would look good in a variety of decorating schemes.
Inside Look
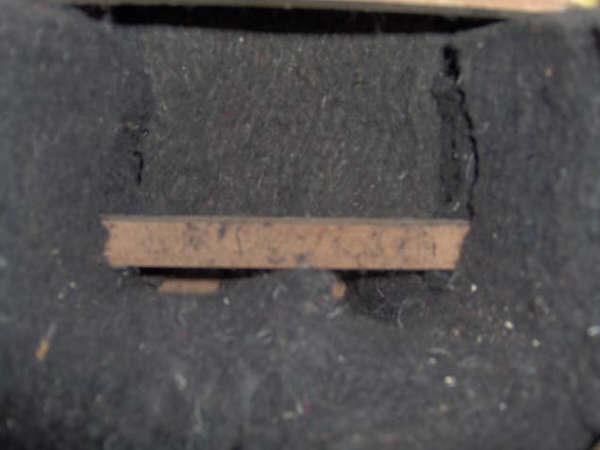 A quick look at the inside of x-ls
shows a well constructed MDF cabinet, cross-braced and further packed with damping material. The duct,
oriented so that its interior end terminates near the back of the shielded tweeter, is flared at its
exterior end only.
A quick look at the inside of x-ls
shows a well constructed MDF cabinet, cross-braced and further packed with damping material. The duct,
oriented so that its interior end terminates near the back of the shielded tweeter, is flared at its
exterior end only.
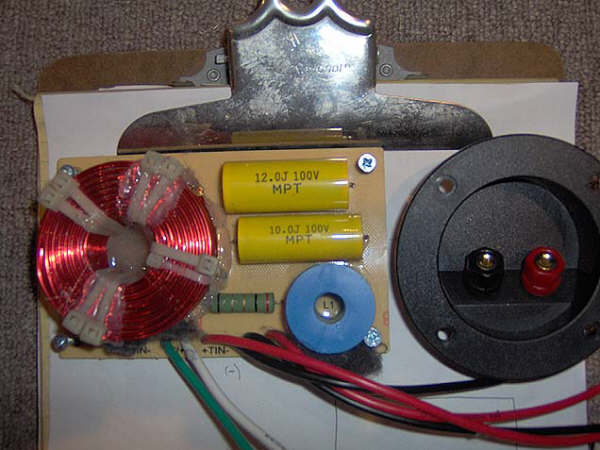
The crossover network is positioned at the front end of the cabinet's bottom panel. All components are tie-wrapped and/or glued to the circuit board. All connections are soldered and 12 AWG wire is used throughout. This is rare in speakers at any price since most use 14-16AWG. Impressive for a 199/pr of speakers!
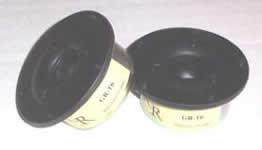
The tweeter used is a convex soft-dome unit, featuring a 25.4 mm voice coil, fully shielded and sporting a damped rear chamber.
Free air resonance is 1kHz and sensitivity clocks in at about 96 dB. Nonlinear distortion tests showed this to be exceptionally clean for a driver in this price range.
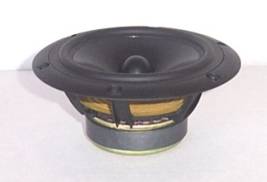 The
woofer, approximately 6.5"
in diameter, presents a curvilinear treated-paper composite cone. The
unit comes with a vented pole-piece, a bumped backplate, phase plug, vented Kapton voice coil and a
polymer chassis.
The
woofer, approximately 6.5"
in diameter, presents a curvilinear treated-paper composite cone. The
unit comes with a vented pole-piece, a bumped backplate, phase plug, vented Kapton voice coil and a
polymer chassis.
Like the tweeter with which it's partnered in this system, the woofer measured, in terms of nonlinear distortion, exceptionally clean for a driver this size in its price class.
The DIY versions of these drivers total out at just under $110.00, more than half the retail of this product!
Onix x-ls Measurements and Analysis
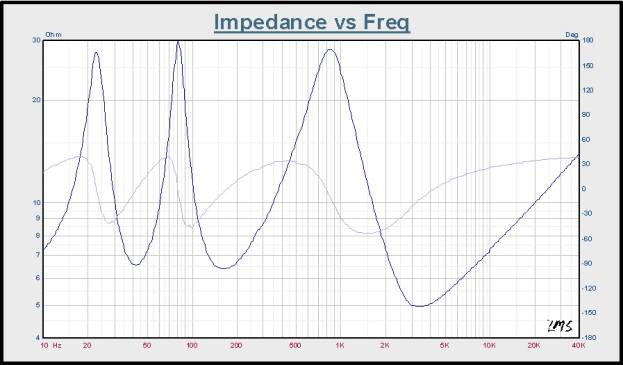
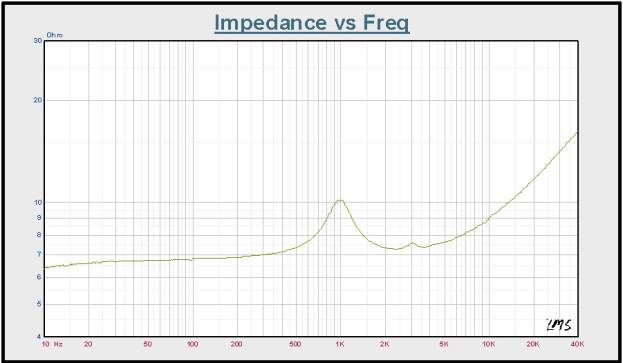
The impedance minimum 0f 6.56 ohms at 42 Hz indicates the vented box tuning frequency. There are two other local minima, found at 164 Hz (6.386 ohms) and 3.4 kHz (4.97 ohms). That the first two minima are proximal in magnitude indicates an efficient reflex action. The large impedance peak, found at ~ 850 Hz arises as a result the interaction of the crossover network's high- and lowpass sections, setting up a parallel resonance.
The impedance phase swings between +39° and -54° across the audible spectrum. With a lowest magnitude minima value of 4.97 ohms, the system nominal impedance (per IEC standards) value would be 6 ohms. Overall, the x-ls will present whatever amp that sits upstream of it a relatively benign load.
Impedance curves are useful in diagnosing pathologies such as pronounced mechanical resonances, defective drive units, etc. In this impedance curve we see no tell-tale symptoms indicating underlying pathologies.
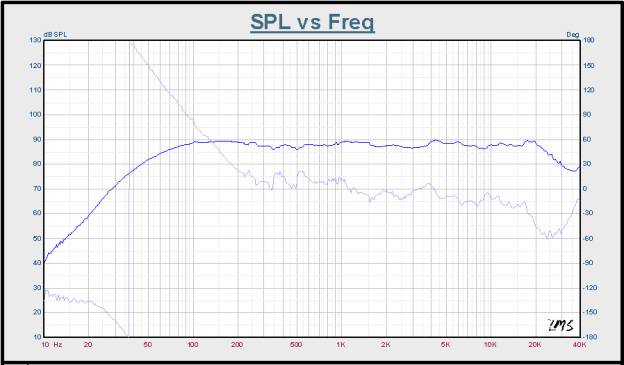
Figure 3: xl-s system amplitude response, scaled to 1m, 2.828 Vac drive level.
Figure 3 shows the x-ls full-range frequency response, obtained by combining a 1m, on-axis gated response with a nearfield woofer & port response, appropriately summed and scaled. System sensitivity averages 87.5 dB in the 300 - 3000 Hz segment of the system's passband, an average value for a system of this type. The data is 1/12 octave smoothed.
Relative to the 87.5 dB sensitivity value the low frequency, -3dB point is 60 Hz. The high frequency -3dB point is about 23 kHz. (Note: the slight up tick in response seen at 35 kHz and above is the result of the measurement microphone detecting the acoustic output of a motion detection security system that happened to be operating in the vicinity at the time of measurement. It's not a system-sourced pathology). Across the 60 Hz - 23 kHz passband, system response varies by ± 1.8 dB. Excellent!
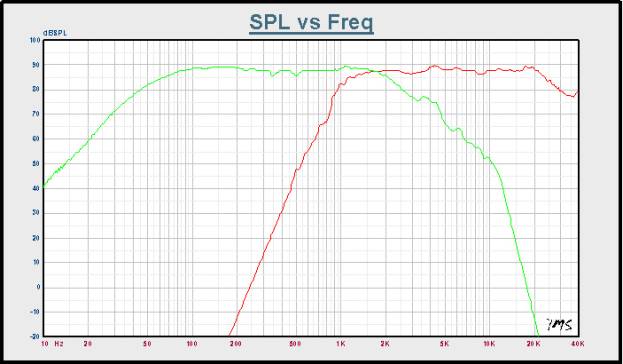
Figure 4: xl-s acoustic crossover frequency measurement, fxover @ 1.7 kHz
The acoustic crossover frequency was determined to be approximately 1.7 kHz (Figure 4) by measuring the on-axis response of the woofer & tweeter, separately.
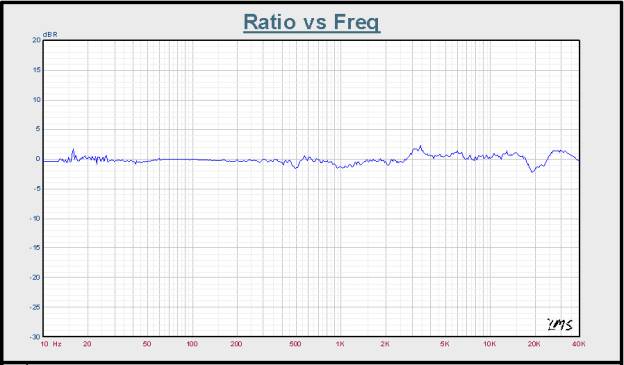
Figure 5: x-ls, system A & B amplitude response match comparison.
The x-ls pair were well matched acoustically and electrically for speakers in this price range, as indicated in figure (Figure 5) and (Figure 6), never straying more than ~ ± 2 dB across the audible spectrum. A good match, such as this, is indicative of a system capable of stable imaging.
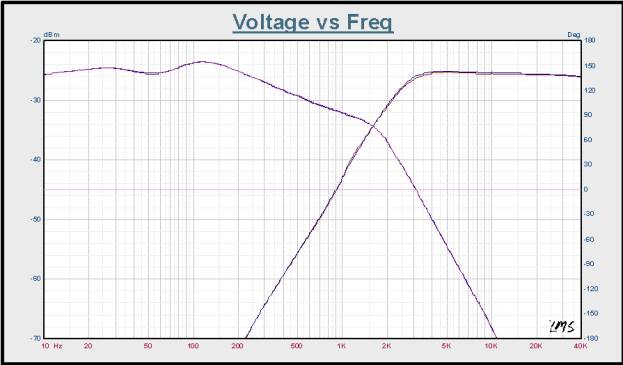
Figure 6: Voltage transfer function of each filter when it is loaded by its driver, both systems.
In Figure 7, we see the acoustic step response of the system. The woofer peak occurs some 3.10 ms behind that of the tweeter, as measured at the microphone position. We also see the typically fast tweeter rise time and the much slower rise time of the woofer. The system is not time coherent.
Only modest weight is given to this measurement as the presence of so many other acoustical artifacts tend to swamp the subtle effects of the time difference as shown in figure 7.
Figure 7: x-ls system step response
Onix x-ls Set-up, Listening Tests, and Conclusion
Prior to all critical listening sessions I prefer to do a substantial amount of recreational listening. While in recreational mode, I listened at different times to the x-ls placed on the floor, in a bookshelf and on stands that placed the tweeter at a height just above 1m. For all the critical listening sessions the x-ls were on the stands.
To determine the best location for speakers within the listening space I use a technique whereby an accomplice walks through the room and I, seated in the listening position, listen for all the telltale cues indicating the various room effects on my perception of said accomplice's voice. Using this technique it usually doesn't take too long to figure out the most neutral-sounding positions to locate the speakers in. Of course, there's no "perfect" locale; there's always the element of compromise involved. But, with a little time and effort it's not difficult to reach a judicious compromise where it comes to placement. Further fine tuning of the speaker's location happens fairly quickly, in a final position where the speakers remain for the rest of the listening sessions.
Listening Tests
For maximum musical satisfaction, I think it essential to pair a two-way system like the x-ls (with its 6.5" LF driver) with a subwoofer. For all listening sessions I wanted to include a sub that wouldn't change the essential character of the x-ls' sound, but instead supplement the listening experience.
I auditioned a small collection of subs, eventually settling on an unusually musical-sounding unit with a 10" driver, the Mirage Omni S10. The S10 and the x-ls proved to be both an exciting & satisfying combination.
Long before the critical listening began it was obvious the x-ls had some
outstanding strengths that put them in a class way above what you'd expect in the $200/pair
stratus of the consumer loudspeaker market. As I got to know them, I was surprised to discover strength
after strength and had to constantly remind myself these were only $200! Later, the microphone would
confirm what the ear already knew.
In the pro sound biz you often bump into ex-musicians-turned-techie. Harry Manx is the singular example I know who's a techie ( Rush, el Mocambo, etc) turned musician. And every time Harry blows through this part of the world I make a point to catch his act at a place called Reader's . Reader's is an amazing gem of a venue where eye-popping talent is booked on a regular basis. Housed in a structure that formerly was the home of a hardware store that had operated in that locale since the early decades of the 20th century, the ambience of the place is best described as 1940's road house meets MTV-unplugged.
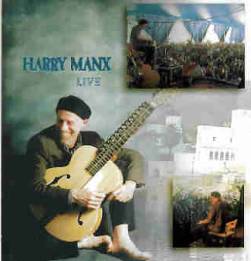
Harry's music is a mix of East Indian raga and American blues, played across a variety of instruments, western and otherwise. The Harry Manx Live CD is a favorite of mine as, sonically speaking; it's one of the most authentic capturings of a live show I've heard to date.
The quality of the recording, the production values and the x-ls made for one of those exceptional listening experiences that remind an individual of the true potential 2-channel payback has for reproducing music in an authentic way.
 The foremost strength of the x-ls is its ability to let you listen
through
to the music. When the music happens, the x-ls removes itself from the picture. (I've encountered
this ability twice before: once with a pair of 2-way speakers retailing in the several $k range).
Acoustic instruments recorded against a quiet background are by their very nature revealing as
there's little for any system weaknesses to hide behind. In listening to the Harry Manx CD, I was
so amazed by the x-ls performance, that the others listening and myself voted unanimously to
temporarily shelve the listening schedule and listen through the entire CD. I wondered if and when
they'd, sonically speaking, would fall down. It never happened. I and the others listening to the
x-ls in the semi-darkness of my home theatre often shook our heads in disbelief that we had before us a
$200 pair of speakers.
The foremost strength of the x-ls is its ability to let you listen
through
to the music. When the music happens, the x-ls removes itself from the picture. (I've encountered
this ability twice before: once with a pair of 2-way speakers retailing in the several $k range).
Acoustic instruments recorded against a quiet background are by their very nature revealing as
there's little for any system weaknesses to hide behind. In listening to the Harry Manx CD, I was
so amazed by the x-ls performance, that the others listening and myself voted unanimously to
temporarily shelve the listening schedule and listen through the entire CD. I wondered if and when
they'd, sonically speaking, would fall down. It never happened. I and the others listening to the
x-ls in the semi-darkness of my home theatre often shook our heads in disbelief that we had before us a
$200 pair of speakers.
Another immediately obvious strength of the x-ls is how clean they played. Combined with a respectable stable soundstage (and the right playback material) they have the ability to move the listener to the space where the recording was made. Later linear & non-linear distortion measurements would validate the subjective assessment.
Changing musical gears I next gave the Benoit/Freeman Project 2 a crack at the x-ls. If you 're not familiar with the disc, light jazz is a good description. It was a fun listen, but as the material was compressed to the degree it was, it didn't challenge (dynamically speaking) the x-ls in the way that the Harry Manx Live CD did. Still, the impressively clean nature of the x-ls gave the Benoit/Freeman disc a chance to show off the rich harmonic tapestry typical of their keyboard/guitar work in an authentic, satisfying way.
 Though only $199/pair, the x-ls were as capable of revealing the quality of a recording
as some speakers costing two or three times as much. This means, of course, the good stuff is going to
shine and the junk will, well, sound like junk. And compressed is going to sound compressed.
Though only $199/pair, the x-ls were as capable of revealing the quality of a recording
as some speakers costing two or three times as much. This means, of course, the good stuff is going to
shine and the junk will, well, sound like junk. And compressed is going to sound compressed.
Michael Roberts Paradiso is another favorite of mine for putting audio gear through its paces. Michael Roberts, a guitarist, plays a style of flamenco with South American influences and a dash of pop melodic sensibilities thrown in for good measure. Paradiso is one of those CDs that is easy to listen to from start to finish, with no filler in between. Here the x-ls ability to resolve detail came to the fore. For example, the well articulated, though usually subtle, snap of the guitar string as it's released - authentically rendered - is always a tough test. The x-ls did so and did it very cleanly, without any of the harshness common in speakers in this price range.
Conclusion
If you're in the market for a 2-way system and planning on including a subwoofer in your purchase plans, the Onix x-ls is definitely worthy of serious consideration. Given the remarkable-for-its-class collection of strengths and the budget-respecting price tag, AV123 has crafted a formidable product that's musically satisfying and sure to provide years of listening enjoyment.
The Score Card
The scoring below is based on each piece of equipment doing the duty it is designed for. The numbers are weighed heavily with respect to the individual cost of each unit, thus giving a rating roughly equal to:
Performance × Price Factor/Value = Rating
Audioholics.com note: The ratings indicated below are based on subjective listening and objective testing of the product in question. The rating scale is based on performance/value ratio. If you notice better performing products in future reviews that have lower numbers in certain areas, be aware that the value factor is most likely the culprit. Other Audioholics reviewers may rate products solely based on performance, and each reviewer has his/her own system for ratings.
Audioholics Rating Scale
 — Excellent
- — Very Good
- — Good
- — Fair
- — Poor
| Metric | Rating |
|---|---|
| Build Quality | |
| Appearance | |
| Treble Extension | |
| Treble Smoothness | |
| Midrange Accuracy | |
| Bass Extension | |
| Bass Accuracy | |
| Imaging | |
| Soundstage | |
| Performance | |
| Value |