
B&W CM1 Loudspeaker Review
- Product Name: B&W CM1 Speaker
- Manufacturer: B&W Group Ltd.
- Performance Rating:

- Value Rating:
- Review Date: October 25, 2006 20:00
- MSRP: $ 900/pr
| Frequency Response (+/-3dB): 55Hz-22kHz Extended Response (-6dB): 45Hz-50kHz Nominal Impedance: 8 W (5.1 W min.) Sensitivity (2.83V @ 1m): 84 dB Tweeter: 1” tube-loaded aluminum dome Mid/Woofer: 5” Kevlar cone |
Crossover Frequency: 4kHz, first order slope. Harmonic Distortion: <1%, 110Hz-22kHz (2nd and 3rd order harmonics at 90 dB, 1m). Amplifier Power: 100 W. Dimensions (HxWxD): 11” x6.5” x 10.9” Weight (each): 14.7 lbs Enclosure Type: Two way ported. |
Pros
- Precise, detailed treble.
- Timbral richness in the lower midrange.
- Decent bass output despite size.
- Superb build quality and finish.
Cons
- Small mid/woofer cone has to work a lot to make all that bass
- Limited maximum output.
CM1 Company History
Bowers & Wilkins, Ltd. is a well recognized name among audiophiles and classical music aficionados. The B & W 800 series loudspeakers have long been considered preeminent studio monitors for orchestral recording sessions dating back to the launch of the original 801 in 1979. The list of recording labels and studios that have used 800 series monitors includes Philips, Decca Records, Deutsche Grammophon, and EMI's Abbey Road Studios where, incidentally, the latest Star Wars movie, Revenge of the Sith was recorded and mixed using B & W loudspeakers. Because of the prominent use for orchestral recording, the speakers are often favored amongst avid orchestral listeners with the intent of replicating the recording session as close as possible by using the same speakers for reproduction as were used in production.
The origins of the company lie in the back room of John Bowers and Roy Wilkins hi-fi shop in Worthing, England where John began modifying and building loudspeakers due to dissatisfaction with the quality available at the time for classical music reproduction. These custom speakers developed a following that eventually lead to the founding of B & W Electronics, Ltd. in 1966. Since that time, B & W has built a reputation on quality products and a dedicated program of research and development. John Bower's close association with recording engineers who provided feedback on the designs has also lead to the widespread adoption of B & W speakers in classical music recording.
B & W has grown from speaker manufacturer into the current B & W Group. Over the years, B & W has offered amplifiers and other electronics under the now defunct Aura name and currently through such well known brands as Classe Audio and Rotel. The CM1 monitors, with the FS-700/CM stands, are the latest in a long history of loudspeaker designs by Bowers & Wilkins.
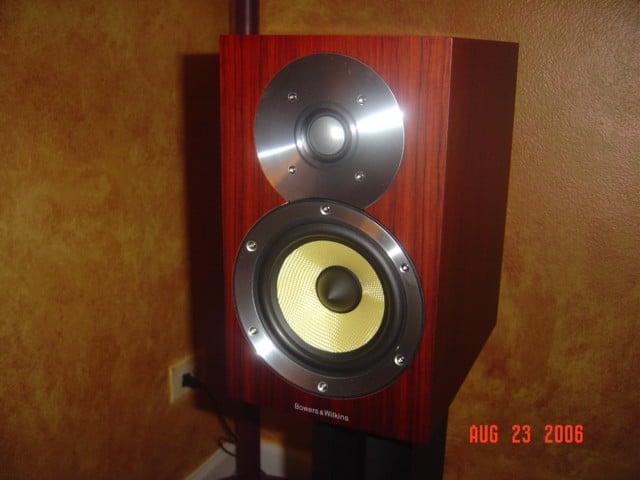
CM1 Design and Construction
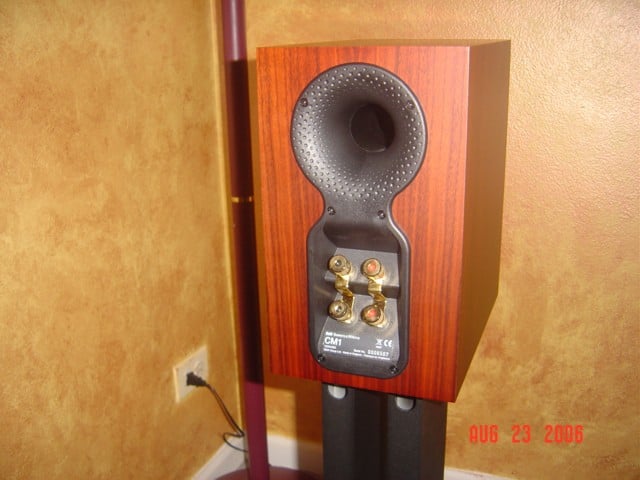
The B&W CM1’s are a small, monitor sized bookshelf speaker system. The speakers are a rear ported, two-way design utilizing a 1” aluminum dome tweeter and a 5” Kevlar mid/woofer driver. The cabinets are well made and of very sturdy construction. The CM1’s are available in several wood veneer finishes including: Wenge, Maple, and Rosenut, the review pair being the latter. I found the wood finish surface to be exceptionally smooth and the fit between veneer surfaces seamless; so smooth that I was left to wonder if the finish was man made until I confirmed it was not in product literature. Grilles for the CM1’s come in black or dark gray and are attached with internal magnets that leave no visible connection hardware on the face of the cabinets. The CM1’s are provided with a pair of gold binding posts at the rear of the cabinet to allow for bi-wiring; gold plated jumpers are also provided for those who wish to mono-wire the CM1’s to an amplifier.
 The CM1’s come with several placement options included in the speakers design.
The cabinets are constructed with threaded metal inserts that are
embedded in the bottom of the cabinets that allow the speakers to be
directly attached to the FS-700/CM stands. Also provided with the
speakers are self adhesive rubber pads for placement on tables or other
furniture.
The CM1’s come with several placement options included in the speakers design.
The cabinets are constructed with threaded metal inserts that are
embedded in the bottom of the cabinets that allow the speakers to be
directly attached to the FS-700/CM stands. Also provided with the
speakers are self adhesive rubber pads for placement on tables or other
furniture.
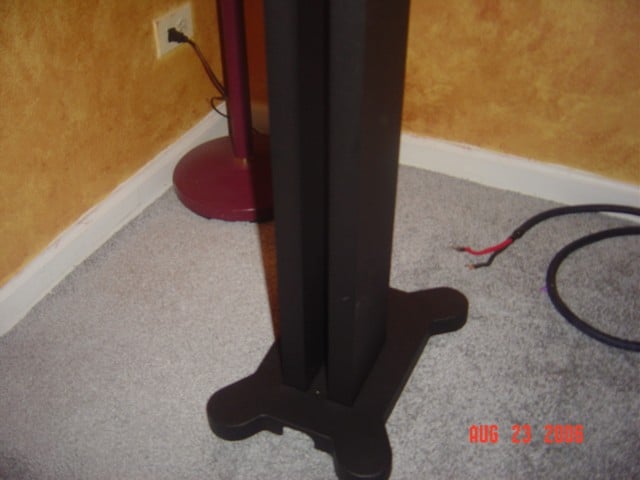
The FS-700/CM stands are constructed of aluminum with a dark charcoal gray powder coat finish. Each stand comes in three parts for assembly: a 3/16” (approximate) top plate, a 1/16” thick tubular leg with two longitudinal chambers, and a base casting with a minimum thickness of approximately 3/16” that thickens towards corners where the mounting feet are threaded to accept carpet spikes or flat pads for hard floors. The base also has an opening into the rear chamber of the leg to allow a discrete run of speaker wire up and out an opening just below the top plate. These are substantial stands with a heavy base that when coupled to the CM1’s through the mounting screws, will keep the speakers more safely situated than many other stand options.
Inside the cabinet, ¾” MDF construction under the wood veneer can be seen. The front baffle is of thicker construction to allow the woofer frame to be mounted and recessed. The 5” woofer features a substantial magnet. Internally, the cabinet is layered in absorptive foam that covers everything, including the crossover, which is set at the back in a recess in the cabinet. The Nautilus tube is mounted to the tweeter in line with the rear port.
B&W states in their literature that the CM1 loudspeakers were designed in tandem with the 805 speaker system. Because of this, the CM1’s are said to incorporates many of the same technical features of the 805 model including driver and crossover technology.
The crossover network is a minimalist fist order design that uses only one electronic component per driver to minimize the amount circuitry and its effect on the music signal. This approach to circuit design is considered desirable by the audiophile market where it is generally believed that more electronic components in the circuit path only serves to deteriorate the signal. The downside to such a minimalist approach is that it is more difficult to meld driver behavior for smooth response that often outweighs any advantages from simplicity in the electronics to the overall speaker performance.
The tweeter uses the Natutilus tapered tube, a tube loading assembly, derived from the flagship Nautilus speaker system, which incorporates an internal inverse horn concept to improve clarity. A short conical section is used to dampen back emissions from the tweeter by reflecting the waves inwards to an absorptive lining. The intent is to eliminate phase problems associated with the rear emissions when they are reflected forward from the back of a speaker.
B&W refers to the tuned port as a ‘Flowport,’ which unlike common designs is dimpled in a similar fashion to a golf ball. What the dimples do is affect the relationship between laminar (smooth) and turbulent airflow, characterized by the Reynolds Number in fluid mechanics, through the port. The dimples increase the critical velocity at which airflow would become turbulent and begin to make those unmusical noises that are often associated with poor port designs. Also included with the speakers is a pair of short foam tubes. B&W recommends inserting these appliances into the rear ports when the speakers are to be used close to a wall to help balance reflected bass output from the port with some added absorption.
B&W is also well known for its use of DuPont’s Kevlar, a synthetic material best known for its use in bullet proof vests, as a driver material dating back to the introduction of the DM6 loudspeaker 1976. It is an orthotropic fiber, commonly used in composites, that exhibits high internal damping, considerable tensile strength, light weight with a strength to weight ratio greater than steel, but relatively poor compressive strength due to its fiberous nature. Kevlar’s high internal damping lead B&W to patent the use of the material in speaker cones to control standing waves. Kevlar is an interesting choice for application in a dynamic driver, from an engineering standpoint; when I say interesting, I mean challenging.
Much ballyhoo is made about the fact that Kevlar is used in bullet proof armor, which incidentally, has no mechanical similarity as to why Kevlar works well for stopping bullets. The high internal friction of the material that damps out free vibrations is not the mechanism by which the force of an instantaneous impact is redistributed to prevent penetration of a projective. Marketing types don’t understand the difference and they don’t really care as long as it sounds impressive, and they hope the consumer doesn’t understand either.
Chemically, Kevlar is a member of the nylon family of polymers and is known as poly-para-phenylene terephthalamide or para-aramid. During manufacturing, the material is drawn into a fiber that aligns the polymer chains giving the material its mechanical properties and orthotropic behavior. Kevlar is available in three grades of increasing tensile strength and modulus: 29, 49, and 149; Kevlar 49 is the most common. For use in composites, Kevlar fibers are often woven into a textile and laminated in a polymer matrix.
The challenge comes in the form of the substantially more complex and difficult to predict mechanical behavior of woven composites. Most materials used for cones are isotropic, meaning they exhibit behavior that is mechanically similar in all directions. Radially around the cone, the uniform behavior reduces the number of mathematical variables and equations which making them relatively simple to predict. Various plastics like polypropylene (which is homogeneous), and even paper (which is an inhomogeneous short fiber composite), behave as isotropic macroscopically. Woven long fiber composites exhibit substantial mechanical variations at angles relative to the fiber axes. The discontinuous geometry of the woven fiber structure complicates the mathematics that have to account for independent properties of the constituent components of the textile, sensitivity to weave geometry, yarn construction, and bonding between the fibers and the matrix, and anisotropic behavior of the composite with respect to loading orientation.
For more on this topic, see the forthcoming: A Primer on the Mechanics of Composite Kevlar Drivers.
At no point in the above discussion am I saying that these challenges cannot be designed for with a satisfactory acoustic result or that B&W’s expertise is not such that they cannot overcome these challenges. Quite the contrary, as B&W seems to successfully taken advantage of this behavior.
Kevlar drivers have often been attributed with a slightly richer sound by many professional and amateur listeners. With circumferential variations in stiffness, the cone will have slight variations in the uniformity of sound radiation with the more flexible areas lagging the stiffer areas. This causes time dependent variations in deformation and movement of the cone and subsequent variations in the air pressure distribution of the acoustic emissions from the cone. What this means is that there will be just a little bit of phase shifting about the frequency of any given forcing function.
My current working hypothesis is that this is the source of the perception of the slightly fuller sound associated with Kevlar drivers used for midrange. These frequencies are where instruments reveal their timbres. Current psychoacoustics research into the precedence effect suggests that the ear will integrate slight phase discrepancies and interpret this as richer sound. Perhaps this can be thought of as akin to a chorus sound processing effect where a fuller sound is generated by introducing phase offsets in the signal that, as in a real chorus of voices or instruments, gives the listener the perception of a greater number of performers.
CM1 System Setup and Listening Tests
I received two boxes from the B&W Group, one containing the CM1’s, and the other containing the FS-700/CM stands. The speakers were double boxed and wrapped in foam with a plastic cover provided to protect the cones.
The stands were very straight forward to assemble and mount the CM1’s. Six Philips machine screws were provided to attach each plate at the ends of the legs along with two plastic inserts placed between each base and leg. The CM1’s were then attached to the stands using screws and a supplied Allen wrench.
I listened to the CM1’s with my PS Audio stereo setup and my Rotel A/V receiver in two-channel mode utilizing bass management and subwoofers. Not surprising, the CM1’s were most at ease when not asked to play low bass that was physically beyond the performance range of these small speakers. With 4 x 6800mF 63V and 2 x 470 mF 80V output capacitors per channel, the PS Audio is capable of delivering whatever bass a recording calls for and left the small mid/woofers jumping. The CM1’s did well to produce this bass to their frequency limits but larger driver excursion invariably leads to distortion. While they did not sound obviously distressed, the sound was more relaxed with the subs and a 60 Hz crossover in place. For full range sound, there is no getting around that these are mini-monitor speakers, so with that in mind, I did a majority of my listening on the Rotel with the crossover and subs.
Treble was precise and clear; there was neither too much, nor too little treble in the CM1’s reproduction. Albums that contained well recorded ambient content were allowed to release these subtle cues and this of course gave life to the recording and aided the illusion of the sound stage. Through out my listening, I observed a wide, scrupulously defined soundstage with good instrumental localization and adequate depth. Instruments were cleanly separated with the CM1’s easily performing better than many comparable speakers in this regard.
I found the midrange to be warm and well balanced across its frequency spectrum. The sound here was full, particularly with orchestral music. My opinion is that this comes from a slight bit of emphasis due to the mechanical behavior of the Kevlar driver material under dynamic loading. This is by no means an unpleasant effect and I believe that it tends to work especially well with orchestral music where the already complex acoustic field of the orchestra hall may not only hide such a subtle discrepancy, but may be enhanced by it.
Editorial Note
Reality is that there is no such thing as a loudspeaker without coloration; it is a theoretical ideal that is striven for but impossible to achieve. Every speaker design is a unique combination of materials and geometries: cone, suspension, frame, and cabinet, each with their own intrinsic resonant and dynamic behavior that has absolutely no relation to the vibrational characteristics of the instruments that the loudspeakers are charged to recreate.There really are basically only two solutions to problematic behavior in system design: minimize unwanted behavior or find a way to take advantage of it. Some designs are better at minimizing their inherent colorations than others, and some designs are better at making the best of the inevitable colorations in favor of the reproduced music. This is the science and art of audio engineering. It is the reviewer’s opinion that the Kevlar solution favors the latter approach.
There was a fair amount of bass output from the CM1’s; a very good amount considering the speakers size. Obviously, the bass from the CM1’s was not earth shaking, but when they were used alone, there was enough to make a good showing. The speakers do a reasonable job of maintaining the illusion of being larger than they are unless directly compared to a larger speaker of good quality.
While I generally found reproduction through these mid/bass drivers to be full and retain detail, the little drivers could get slightly punchy under certain musical circumstances. I also did find a very subtle overdamping to the sound. This manifested, for example, with some percussive sounds that had a little too much thud when there should have been a little more extended instrumental ring in the upper harmonics of the recording. I attribute this to the highly damped nature of these drivers and I will point out that damping is energy dissipation. While it is commonly spoken of in reference to controlling free vibration (known as unwanted driver ringing), it also dissipates energy under forced vibration (often referred to as reproduced music in audio circles). The affect is that some subtler sounds may be muted or rounded off, such as upper harmonics, when reproduced; over damping will blunt these sounds because damping does not wait for the driving force to stop to kick in. It resists any motion. Again, this is very subtle and not inherently bad in so much as it does serve to keep the sound clean by controlling free vibrations in the driver.
A
speaker of this size is intended for use in two common situations: when
space restrictions dictate or in a satellite/subwoofer combination. If
one wants some bass but can’t have anything bigger, these speakers are
about as good as one can do at this size. The CM1’s are also an
excellent alternative to those ‘cube’ speakers: they look nicer, sound
nicer, and are not really that much bigger. For those who think
otherwise about the size , it comes down to priorities: why even bother
with speakers if the only goal is to hide them and damn the sound
quality? Just jamb some ear buds in and avoid the space issue
altogether. Nothing will take less space than that.
Thom Yorke: The Eraser
The
recently released solo album by Thom Yorke, of Radiohead fame, is full
of demanding electronic noises that test transient response with sounds
that are densely composited and varied. While I am fairly sure there
is nary an acoustic instrument to be found on this album, with one
possible exception, I may subsequently describe some sounds using their
nearest acoustic equivalent.
The CM1’s reproduced this album with sharp transients and crisp, transparent treble. The sound was precise and at ease throughout my listening allowing for clean instrument separation. Layers of electronica, noises, buzzes, clicks, fuzz, pitch bends, percussion, and perhaps the occasional acoustic instrument came apart for inspection in this complex acoustic tapestry. Midrange reproduction was full with perhaps the slight bit of emphasis, as previously noted, which if anything added to Yorke’s vocal layers. Sound staging was solid and centered. It was both believable and well formed providing localization and envelopment on a wide stage that also had adequate depth.
The title track conveyed many of the CM1’s qualities described above. Treble was clean at the top end and very precise with case in point being reproduction of cymbals; and yet the sound quality was simultaneously at ease. I found good instrumental separation that exposed inner parts with background vocals and synthesizer chord fills. ‘The Clock’ was rendered with sharp percussive transients and excellent detail, particularly in the guitar where different fuzz lines were distinguishable. There was percussion I would describe as wood blockish that was portrayed with excellent space and depth by the CM1’s suggesting a large listening space. “Harrow Down Hill’ opens with a tight, picked bass line was well handled by the CM1’s retaining fullness and detail to the point where one could hear the pick on the stings. Vocals and synthesizer chords had presence in space with an ambient and open sound quality through the CM1’s. I found the reproduction to be detailed and clean, conveying a sense of envelopment while remaining at ease.
Daniel Lanois: Shine
Perhaps better known as a producer, with album credits including Peter
Gabriel, U2, Bob Dylan, and Emmylou Harris, Daniel Lanois’ 2003
release, ‘Shine’ once again illustrates a composer and guitarist of
extraordinary musical talent. This is a carefully crafted album that
places a wide range of elements taken from traditional musical forms
into an experimental and atmospheric tapestry. Lanois’ compositions
are layered with melodic lines constructed of multiple instruments that
slip in and out of the performance space and wound into a seamless
whole. With good quality reproduction, this recording retains the
original musical life and can make a substantial presence in ones
listening room. The CM1’s were able to compliment this recording with
all of its nuances.
The sound quality of the CM1’s could again be described as at ease reproducing this album. Detailed instrumental arrangements were cleanly separated and presented with a high level of resolution. I found reproduction of vocal and instrumental timbre to have a natural sound that retained fullness and palpability. Layers of instruments with subtle interrelationships were not lost in the CM1’s ability to convey detail and microdynamics. Sound staging and localization painted the ever changing array of instruments that moved in and out of the music that were set about the stage.
‘I Love You’ has shifting percussion that had both space and depth using the CM1’s. The vocals were warm and detailed illustrating the multiple layers present. Emmylou Harris makes a guest appearance with supporting vocals that are often inseparable except at the choirs, but with the CM1’s she could be heard intertwining with other vocal lines throughout this piece. This is one of the finer points of reproduction lost on many a speaker. ‘Sometimes’ had presence, detailing rich vocal parts with natural timbre arrayed around the stage. Open, detailed treble allowed for instrumental separation of multiple acoustic and slide guitars, vocal layers, and percussion including layers of cymbals and maracas. Dynamic transitions in this piece were unstressed on these speakers. Lanois multilayered vocals and guitar in ‘Slow Giving’ were presented as palpable in the room with a wide, coherent sound stage; the level of micro dynamics and detail supporting the illusion. The layering was rich but still clearly separable into the component parts. The CM1’s also performed well with dynamic contrast and transitions in this piece.
CM1 Measurements and Analysis
Measurements were performed using the Sample Champion program developed by Paolo Guidorzi of Purebits. The program is a Maximum Length Sequence (MLS) program that can generate an impulse response from this pseudorandom signal. The Fast Fourier Transformation is applied to the impulse response to generate the system frequency response. The operating principle is the same as that of the well known MLSSA program.
I received speakers with the sequential serial numbers: 6507 and 6508. I have used these serial numbers to identify each test measurement taken.
Test samples were taken using 16 bit resolution with a 48 kHz sampling frequency. Fast Fourier Transformations were performed at 64K allowing for a frequency resolution of .73 Hz, which is more refined than even 1/24th octave resolution at the lowest octave; the A0 key on the piano has a fundamental frequency of 27.5 Hz. Quasianechoic response was compiled using a Blackman-Harris, half right window based on crossover frequencies provided in the owner’s manual.
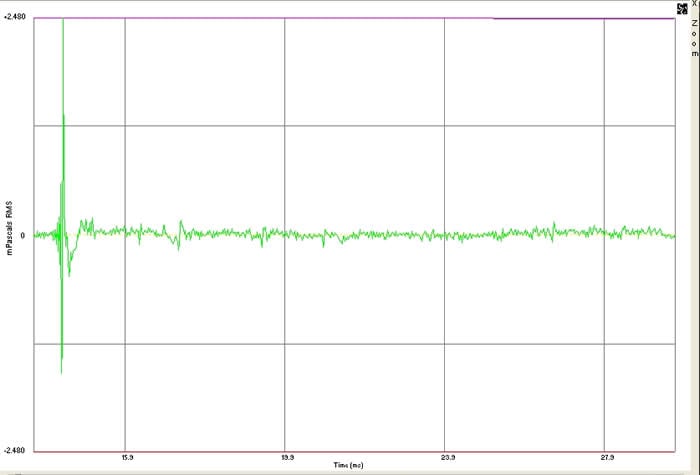
Figure 1: Impulse response of unit 6508.
The first figure is the normalized impulse response captured from unit 6508. A theoretical impulse response should appear as a single pulse up from zero and back for a single driver. This is a composite response for a two-way speaker system, and while the multiple drivers each have their own peak, a speaker with well damped behavior should have its dynamic response die out with few additional oscillations. The plot shows behavior typical of a two way system, the initial spike from the tweeter followed by a smaller hump from the mid/woofer, which has a slower rise time than the tweeter. There is rapid decay for both drivers, indicating a high level of damping. This is consistent with a design that uses an inverse horn loaded tweeter that damps out back reflections and the Kevlar mid/woofer; a material with has a high internal damping.
Frequency response plots were generated for 1 meter impulse response measurements time windowed over a 4 millisecond span. Bass response was measured from summed woofer and port near field measurements corrected to the far field.
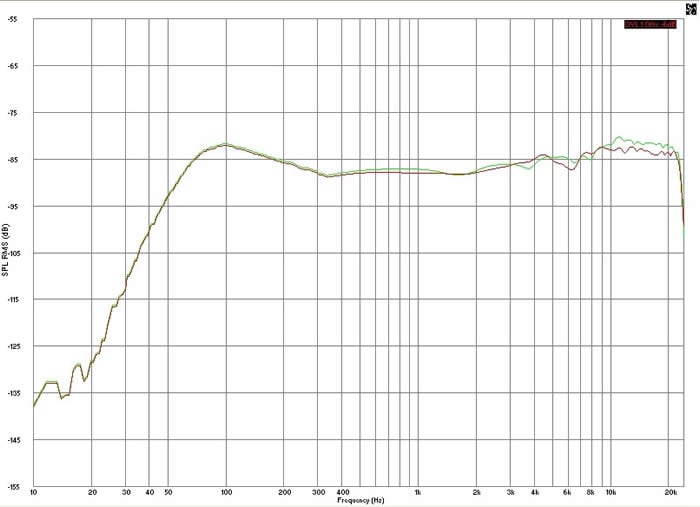
Figure 2: Frequency response of unit 6508 on axis and 30 degrees off axis.
The second figure is of the frequency response for 6508 for on axis (green trace) and 30 degrees off axis (red trace). Some non-smooth frequency separation begins between 3000 and 4000 Hz, near the crossover frequency, while lobbing of the response begins around 8000 Hz.
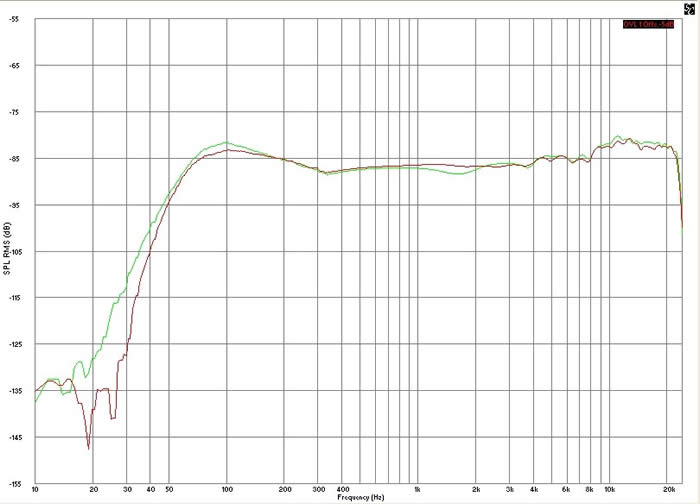
Figure 3: Comparison of units 6508 and 6507.
I also compared frequency response for the two units, 6508 (green trace) and 6507 (red trace), shown in the third figure. Response variations between the two units show fairly good correlation over the quoted frequency response. The largest variations occur near 100 Hz and 1500 Hz, in the range of the mid woofer where response will be more sensitive to any geometric variations in the Kevlar weave.
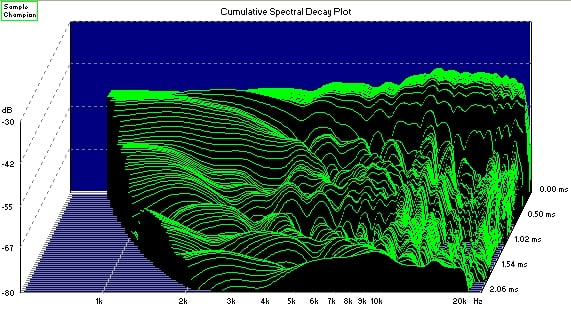
Figure 4: Cumulative spectral decay of unit 6508.
The next figure shows the cumulative spectral decay based on the impulse response shown in figure 1 windowed over 4 milliseconds for quasi-anechoic response. The plot shows decay over a 50 dB range for frequencies in the midrange and treble regions. The speaker shows good decay with fairly smooth behavior over the time interval.
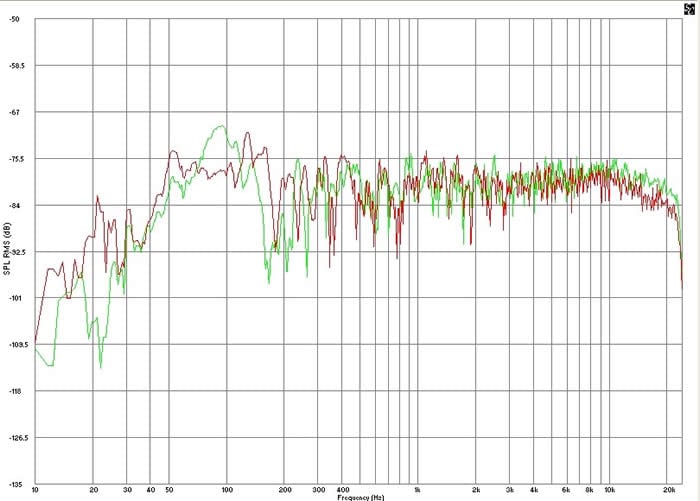
Figure 5: In room response of units 6508 and 6507.
The final plot is of in room response. Unit 6508 (green trace) was measured from the left stereo position while 6507 (red trace) was measured for the right stereo position. From the plot, significant in room roll off can be seen occurring just below 50 Hz.
CM1 Listening Tests and Conclusion
Mussorgsky (Orchestration: Revel): Pictures at an Exhibition; Bartok: Concerto for Orchestra
Chicago Symphony Orchestra, Sir Georg Solti (London Records)
These
pieces were recorded at two fine venues in Chicago, ‘Pictures…’ at
Medinah Temple and ‘Concerto…’ at Symphony Hall. I have performed in
the auditorium at the Medinah Temple, back when I was in college, but
it is now gone. A victim of commercialism, it is now a Bloomingdale’s;
damned New Yorkers. Seems everything can be bought and sold anymore.
Another piece of history lost.
As a subsidiary of the Decca Record label, this London recording may well have been recorded and mastered on B&W speakers. The music did sound comfortable on the CM1’s.
The CM1’s sounded bigger than they were, recapturing the majesty of these grandiose pieces in good measure, handling dynamic swings from solo instruments to full orchestra well. The slightly more laid back sound of these speakers put me at mid hall with the orchestra slightly below, consistent with where it should be with the slope of hall seating. Ambience and decay were reproduced with sound staging good enough to recreate the envelopment of the hall from the actual event. At the detail level, inner parts were discernable as well as nuances of detailed interplay between instruments.
‘Pictures at an Exhibition’ opens with the trumpet fanfare of ‘Promenade’. Full brass and the life of the hall came to my ears. We segue into ‘Gnomus’ were the inner details of the flutes could be heard. The character of bow on string and the musical flavors of the wooden bodies of the violins came through the CM1’s. ‘Promenade – Tuileries’ allowed the CM1’s to show off their ability to resolve fine detail with light and delicate reproduction of the interplay between oboe, flutes, and pizzicato strings. With ‘La Cabane Sur des Pattes de Poule’, the CM1’s supported the depth of the opening tympani and low string section. Transients in the brass were clean and instrumental timbres were natural. Sudden jumps between sections of the orchestra tested the CM1’s ability to handle macro dynamics and flittering instruments behind the flutes gave a good showing of micro dynamics, the CM1’s did well throughout. ‘La Grande Porte de Kiev’ was able to close with majesty and bombast without being cramped by the CM1’s.
Bartok’s ‘Concerto for Orchestra’ also was presented well by the CM1’s. Sound rich with the details of inner parts and hall ambience came through the speakers on ‘Introduzione’. Delicate micro dynamics between low strings to the flutes and upper strings were preserved in quiet sections while fanfares carried dynamics and separation while sounding full. Interplay of dissonant trumpet chords in ‘Presentando le Coppie’ was delicate and detailed. The ‘Finale’ also displayed the CM1’s ability to present detail, hall ambience, and separation simultaneously handling dynamics and transients while providing a full sound.
Conclusions & Recommendations
The B&W CM1 loudspeakers may definitely be considered a successful design that can suit a number of different usage goals. The build quality of the CM1’s is excellent: the construction is solid and the finishes are of high quality. The sound quality is notable with a character that is at ease and warm, yet still detailed. The CM1’s will fare well against similarly price competitors.
My opinion is that the midrange warmth, often attributed to Kevlar drivers may perhaps be artificial but it is well implemented by B&W. This effect is uniform in nature; it does not hover around particular frequencies coloring them. I find the effect to be more along the lines of enhancement rather than of distorting or editorializing.
I will get off the audiophile high horse long enough to say this: absolute reproduction accuracy is an ideal that should be pursued, but realistically, it is not achievable. No equipment is perfectly uncolored and most recordings are less than ideal. For whatever reason: artistic intent, equipment limitations, bad studio acoustics, or technical incompetency, few recordings fit well within the ideal. With bad production, what can we realistically expect from reproduction? Many bad speakers add content in a non uniform fashion that skews the sound; for those rare cases where sound can be enhanced in a uniform way, it may not be all bad.
The ideal is also part of a double standard for if the sound is edited before the speakers, by say digital processing … Dolby Pro Logic IIx, DTS Neo6, stadium, club, etcetera… then it seems to be considered acceptable by many listeners. But these are not part of artistic intent unless the music was actually recorded as multi-channel and one is listening in the studio or a room with identical acoustics, on identical electronics, through identical monitors, then even the most dead on accurate speaker system is part of an editorial of the original production.
These speakers are an excellent choice for a satellite/sub arrangement or for use as surround channels in a home theater. And, if one enjoys orchestral music, it was likely recorded on B&W monitors; so to get as close to the actual recording as possible, one should consider owning some B&W’s.
The Score Card
The scoring below is based on each piece of equipment doing the duty it is designed for. The numbers are weighed heavily with respect to the individual cost of each unit, thus giving a rating roughly equal to:
Performance × Price Factor/Value = Rating
Audioholics.com note: The ratings indicated below are based on subjective listening and objective testing of the product in question. The rating scale is based on performance/value ratio. If you notice better performing products in future reviews that have lower numbers in certain areas, be aware that the value factor is most likely the culprit. Other Audioholics reviewers may rate products solely based on performance, and each reviewer has his/her own system for ratings.
Audioholics Rating Scale
 — Excellent
- — Very Good
- — Good
- — Fair
- — Poor
| Metric | Rating |
|---|---|
| Build Quality | |
| Appearance | |
| Treble Extension | |
| Treble Smoothness | |
| Midrange Accuracy | |
| Bass Extension | |
| Bass Accuracy | |
| Imaging | |
| Soundstage | |
| Dynamic Range | |
| Performance | |
| Value |
Professionally, David engineers building structures. He is also a musician and audio enthusiast. David gives his perspective about loudspeakers and complex audio topics from his mechanical engineering and HAA Certified Level I training.
View full profile