
Yamaha RX-V2500 Receiver Review
Yamaha RX-V2500 Receiver
- Product Name: RX-V2500
- Manufacturer: Yamaha
- Performance Rating:


- Value Rating:
- Review Date: November 01, 2004 18:00
- MSRP: $ 1099
|
7-Channel Powerful Surround Sound (130W x 7 RMS) [8 ohms, 20 Hz-20 kHz, 0.04% THD] Digital ToP-ART and High Current Amplification Pure Direct Switch for High Quality 2-Channel and Multi-Channel Sound Reproduction 192 kHz/24-Bit DACs for All Channels YPAO Automatically Sets Best Sound for Any Room, Any Speaker Placement Dialogue Lift for Enhanced Dialogue Sound 9-Channel Speaker Outputs with Zone 2 Out On-Screen Display with GUI (Graphical User Interface) Main / Zone 2 Front Panel Power Switching Zone 2 S-Video Output Terminal |
Accurate Touch Volume Control Audio Delay for Adjusting Lip-Sync (0-240 ms) Digital Tone Controls for Bass and Treble Rec Out/Zone 2 Selector Selectable 9-Band Subwoofer Crossover Subwoofer Phase Select Speaker A, B or A+B Selection (Front L/R) SILENT CINEMA and Virtual CINEMA DSP Direct-Access (Macro-Command,
Learning and Dimensions: 17.125" W x 6.75" H x 17" D |
Pros
- Three (3) HDTV-compatible component video inputs
- Accurate YPAO automatic speaker setup
- Presence channels & Yamaha DSP
- System memory with 6 storage banks (2 retrievable from remote)
- Dialogue lift with presence channels
- Independent volume trim for each input!
Cons
- Auto Setup sets aggressive crossover frequency
- No IEEE 1394/Firewire interface
- Remote button labels limit usefulness of backlighting
- No parametric EQ bands below 62.5Hz
Yamaha RX-V2500 Introduction
2004 marked a year when SpaceShipOne broke the status quo and became the first private company to successfully launch a reusable manned vehicle into space and return it safely home. That kind of innovation and leadership garners a tremendous amount of respect. Yamaha Electronics Corporation seems to understand the importance of product innovation and leadership. With the RX-V2500, it is apparent they continue to make tremendous strides towards product improvement and the development of new technologies.
It's been over two years since a Yamaha RX-V series receiver has occupied Reference System 3. As you can imagine, I was pleased to be able to integrate the RX-V2500 and see what surprises Yamaha has come up with in the last several revisions since my experiences with the RX-V3000 receiver.
Having just reviewed the Denon AVR-3805, I was anxious to test out Yamaha's YPAO system to see if it was a more productive setup and parametric EQ option for basic room correction. I also wanted to see how well the 130 watts/channel amplification could drive the 4-ohm RBH Sound 1266-LSE main speakers which require quite a bit of power to sound their best.
Yamaha has certainly not been sitting on its laurels of late. In fact, Audioholics completed a rather thorough review of the RX-V2400 receiver when it came out and I was pleased to note the following improvements from that model:
- Additional 10 watts/channel for 130watts/channel (20Hz - 20kHz, 0.04% THD, 8-ohms)
- DTS: Neo 96kHz
- Pure Direct Mode
- GUI Interface
- Updated YPAO Equalization modes and shortened test time
- Manual PEQ settings
- Subwoofer phase select
- Additional component video input
- New remote control with backlit buttons
- Shuttered optical connections
- Improved components
The Yamaha RX-V2500 receiver was powering RBH Sound 1266-LSE Signature Series speakers in a 12 x 20 listening room in Audioholics' Reference System 3. Below is the configuration utilized for this review:
I'll address power issues later, but the Yamaha sufficiently powered my 4-ohm main speakers without any noticeable strain.
Yamah RX-V2500 Listening Environment and First Impressions
The Reference System 3 listening room is characterized by a series of natural diffusers and a good combination of absorptive materials. It is often necessary to hang draperies and build or purchase fancy bass traps to eliminate problems in a room. When possible, I prefer to do it naturally; and as I built my home, I was able to construct a room where the furniture and natural materials could do most of the work for me. Bookshelves serve as diffusers, and 9' flat ceilings with berber carpet produce a room that is lively, but not highly-reflective.
The central listening position is on a sofa located in the center of the room, 11 feet from the front wall, and 8 feet from the rear wall. The RBH Sound 1266-LSEs are approximately 7.5' apart and the 61-LSE surrounds are 7' apart on the rear wall and faced directly forward to maximize their excellent imaging characteristics. An RBH Sound 1010-SEP subwoofer was situated in a corner just outside of the left 1266-LSE and was used for this review. Wharfedale Diamond 7.1 speakers were mounted above and outside of the main speakers at a height of 8' for use as presence channels for Yamaha DSP.
First Impressions
While I'll cover more of these topics in greater detail later, there were some things that quickly jumped out at me upon first setting up and using the Yamaha RX-V2500 receiver.
-
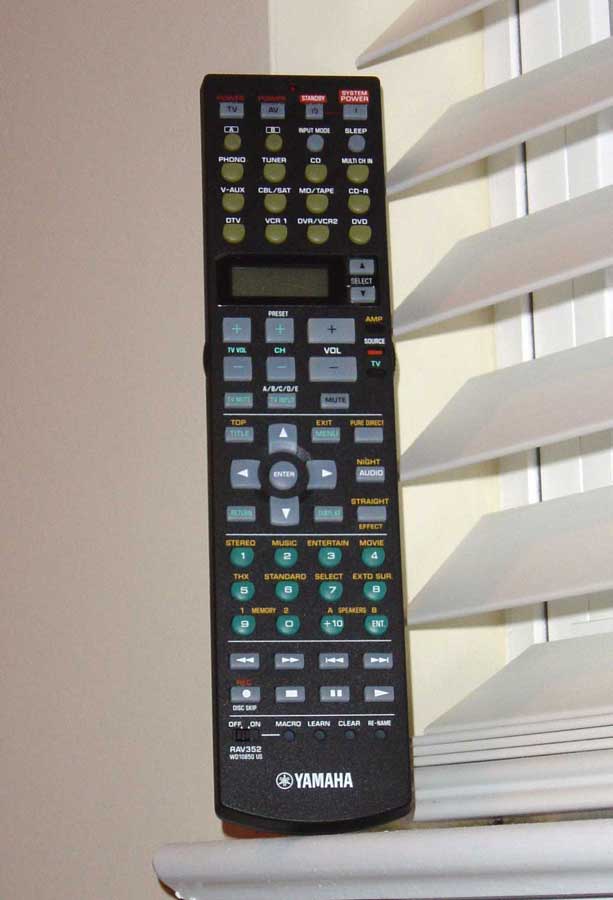
Remote Control
First off was the updated remote control. Upgraded even from the RX-V2400, the new RAV352 remote is a much more ergonomic remote than its predecessor I utilized with the RX-V3000. This device is narrower, providing a better fit for the hand. In addition, ALL (yes, all) buttons on the remote are backlit, though not all are self-labeled and most are difficult to read because they are labeled with white rather than black. There is now a sliding switch on the right side of the remote that directs control to either the receiver ("amp"), source, or television. The rest I'll cover in a few pages. - Power
Yamaha is on a power trip - they keep adding more to their receivers and I'll take all they will give me. This new receiver priced at just $1099 boasts 130 watts per channel however if this were an all channels driven rating (which it is not) Yamaha would require a much larger package, bigger power supply, and probably more money. -
YPAO
Yamaha, at least on first impression, seems to take a more serious approach to room EQ. The YPAO system puts out pink noise and short sweep tone bursts in order to evaluate the speakers' frequency response and set system parameters. The YPAO system also sets the satellite to subwoofer crossover frequency for the system which makes sense since other parameters would be affected by this. -
GUI
The new graphical user interface for the RX-V2500 absolutely knocked my socks off. It is ergonomic, and for the most part, well-organized. All of your manual and automatic receiver setup functions can be accessed via the GUI. In addition, you can now store 6 independent receiver settings for instant recall (2 settings can even be invoked directly via the remote.)
Yamaha RX-V2500 System Setup and YPAO Room EQ
System Setup: Manual
For tweakers and seasoned home theater enthusiasts, no one can calibrate your system better than you - right? Well, let's start with a manual setup of the receiver, then. The new GUI allows you to set up Sound, basic System Configuration, and Receiver Options.
I started with the Basic System Configuration options and set my system to the following using an SPL meter and tape measure. I utilized the Yamaha's internal test tones which had to be enabled via the GUI:
|
Speaker |
Size |
Level |
Distance |
|
Front L |
Small |
-0.5 |
10.0 |
|
Front R |
+0.5 |
10.0 |
|
|
Center |
Small |
0.0 |
10.0 |
|
Surround L |
Small |
0.0 |
8.0 |
|
Surround R |
+1.0 |
8.0 |
|
|
Presence L |
Yes |
+2.5 |
13.0 |
|
Presence R |
+2.5 |
13.0 |
|
|
Subwoofer |
- - |
-2.0 |
11.5 |
Surround Back:
None
Crossover frequency:
60Hz
Bass out:
SWFR
Subwoofer Phase:
Normal
Now that my loudspeakers and subwoofer were configured I moved on to setting up and verifying my inputs and routing video via the GUI. I configured the Yamaha to handle component video from the Denon DVD-3910 and Scientific Atlanta Explorer 8000HD DVR. I also set all of my digital and multi-channel audio inputs including the coax S/PDIF feed from my HTPC, which stores my entire CD library.
Manual setup couldn't be any easier, save for adding voice commands, and the whole system was configured in less than 10 minutes. That even included renaming several of the inputs and adjusting their volume trims to blend the levels of my various sources.
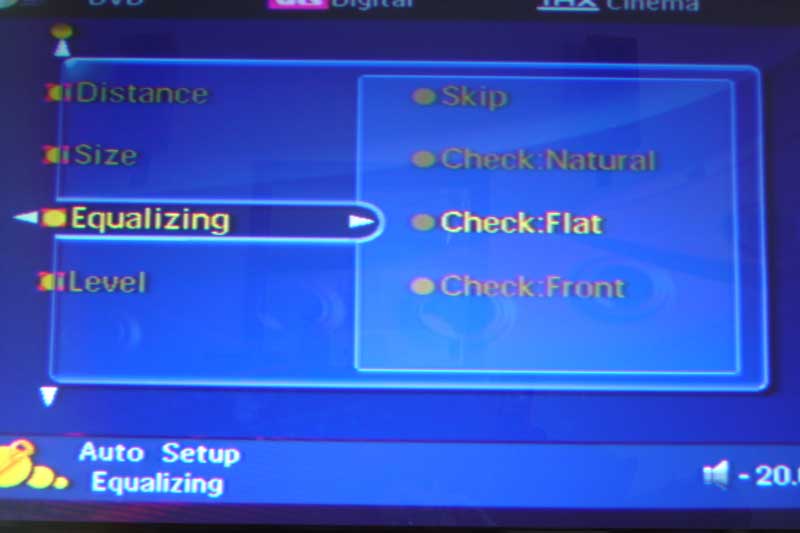
System Setup: Automatic
If you think Manual Setup is easy, try plugging in the microphone , pressing one button and waiting approximately 3 minutes - now that's easy! Yamaha's Auto Setup feature is accessible directly from the GUI and is very literally a one-step process. It can also be configured to limit setup to all or some of the following parameters:
- Wiring
- Distance
- Size
- Equalizing
- Level
Of these options only wiring (potentially) and equalizing cannot be done with visual inspection, test tones and an SLP meter. What's really convenient and impressive is that you really can trust the Yamaha to do an accurate job of setting the basic parameters. The EQ settings generated by the YPAO system we'll discuss a bit further on. Here is the comparison of the results I achieved manually compared to the Auto Setup system:
|
Manual Setup
Surround Back:
None
|
Auto Setup
Surround Back:
None
|
Notably, the Auto Setup was with 0.5dB of my manually configured settings. This difference is possibly attributed to my physical presence during measurements as opposed to an unobstructed microphone, or it could simply be a difference between the calibrations of the Yamaha microphone and the RadioShack SPL meter.
Note: The Yamaha Auto Setup incorrectly stated that my main speakers were both wired out of phase. This was not entirely incorrect. In fact, the RBH 1266-LSE 12" drivers are wired out of phase for correct acoustical summing at the crossover point of the 12" aluminum woofer and midrange/tweeter combo.
YPAO Parametric Room EQ Settings
 YPAO allows you to set equalizing to the
following parameters intended to aid in correcting the system for both room anomalies and differences
in loudspeaker frequency response. One thing I found odd was the wording of the EQ modes. Wording in
the manual almost suggests that Yamaha's YPAO is focused on taming the anomalies associated with
mismatched and non-flat speakers, rather than compensating for room deficiencies. This is largely
semantics as 50% of what reaches the microphone is coming from the room. However in our desire to
educate consumers, it's always nice to maintain the perspective that EQ is attempting to compensate for
the room, not loudspeaker deficiencies. The available modes are:
YPAO allows you to set equalizing to the
following parameters intended to aid in correcting the system for both room anomalies and differences
in loudspeaker frequency response. One thing I found odd was the wording of the EQ modes. Wording in
the manual almost suggests that Yamaha's YPAO is focused on taming the anomalies associated with
mismatched and non-flat speakers, rather than compensating for room deficiencies. This is largely
semantics as 50% of what reaches the microphone is coming from the room. However in our desire to
educate consumers, it's always nice to maintain the perspective that EQ is attempting to compensate for
the room, not loudspeaker deficiencies. The available modes are:
-
Check: Natural
This mode averages out the frequency response of all speakers so that higher frequencies are less emphasized. This setting is only recommended if the Flat setting (or EQ off) seems too subjectively bright for your tastes.
Evaluation Summary: This mode seemed to roll off a bit of the high end as indicated and for me did so in a way that was unnecessary, resulting in my above recommendation to only use this if you are trying to tame a bright room or if you prefer an artificially warmer sound.
-
Check: Flat
If your home theater system is comprised of similar quality speakers, ten this setting will average the frequency response of all speakers. While it sounds like the system is bringing all the speakers into alignment, the gist here is that YPAO is attempting to resolve to a flat frequency response each speaker in the room.
Evaluation Summary: Unlike other room EQ systems I've recently tested, the YPAO system using this mode gave a pleasing result, as opposed to a Phil Spectre wall of sound. The sound stage was preserved, while my Wharfedale Diamond 7.1 presence channel speakers were EQ'd to more closely blend in with the system. One of the positive results was that I was able to utilize the Dialogue Lift function of the RX-V2500 without a noticeable and distracting change in timbre.
-
Check: Front
If your main speakers are of significantly better quality than the rest of the system this setting will attempt to adjust the frequency response of the other speakers to more closely blend in with the front channels.
Evaluation Summary: I alternated between this mode and the Flat setting and felt that these settings would be most beneficial for those looking for a room EQ solution that was the least intrusive to the best possible sound of the system.
Editorial Note
It's important to note that the YPAO system does not perform any corrections to frequencies below 62.5Hz, meaning that it really cannot correct for the lowest 1 ½ octave subwoofer peaks or room modes. In addition, Yamaha's EQ system is 1/3 octave bandwidth with fixed frequencies for each of the 7 EQ bands.
Now let's take a look at how the YPAO system measures in Reference System from the listening position:
Editor's Note: Reference System 3 shows a 7dB dip at 280Hz, however the room's remaining frequency response is +/- 3dB across the rest of the listening range. The 280Hz dip was from my presence in the room 4 feet behind the measurement microphone position. This demonstates how well the YPAO is actually working, though no mention regarding leaving the room during the measurement procedure was found in the instruction manual.
Measurements were taken using the supplied Yamaha YPAO microphone situated on a boom mount at the listening position. This represents an off-axis frequency response measurement since the tested loudspeaker was the right front channel. Notably, the high frequencies indicate this off-axis response with a gradual roll off starting at around 5k. The first thing you may note is that the flattest overall frequency response occurs with the Manual setup. This represents a bypass of the YPAO system. The "Front" mode is almost an exact match to the Manual settings, which is expected since that mode leaves the main channels alone.
What you can see happening with the Flat mode is the YPAO system attempting to do some correction at the high frequencies as well as bump up the 350-400Hz range. As I mentioned, the result was pleasing and I noticed no significant decrease in soundstage or imaging.
The Natural mode, as indicated here, rolls off a bit more of the high frequency information starting from 2kHz, though gently, in order to perhaps compensate for brighter systems (or rooms). While I don't personally find this mode useful in my listening room, it would probably be much better than using a tone control to tame a bright listening room.
It's hard to tell the whole story with a single microphone at the listening position, but this should give a fairly accurate picture of what YPAO is doing in terms of its effects on your main speakers. The measurements required to tell you how it affects the entire system would be nearly insurmountable and better left to subjective listening evaluations.
Yamaha RX-V2500 Listening Tests - Music and Movies
Listening Tests - Music
Our prior review of the RX-V2400 detailed some subjective tests for that model and the evaluation of this unit agrees with our previous assessment. This receiver is clear and powerful. Even when feeding it analogue 5.1 sources from the Denon DVD-3910, the noise floor on this unit was extremely low. For a receiver at this price point to be able to drive a pair of 4-ohm, 88dB sensitivity reference speakers tells you something about the quality that goes into Yamaha products.
![[KAJECover200]](image011.gif/image) DVD-Audio: KAJE
DVD-Audio: KAJEI listened to several multi-channel discs including the new DVD-Audio disc from KAJE . Tracks 1, 6 and 10 feature some outstanding vocals along with some incredibly diverse and creative instrumentation. The RX-V2500 was able to clearly articulate the top end while not missing a beat on the smooth bass lines, exercising the 12" low frequency drivers of the RBH Sound 1266-LSEs with ease. On other tracks the performance of the Yamaha receiver was equally impressive with rich dynamics and an unrestrictive soundstage.
The solid bass lines of Track 12 really exercised the system in general and I couldn't help but crank up the music until the Yamaha was pushing over 95dB at the listening position. After a while I stopped and noticed the automatic fan mode had engaged. I felt the top of the unit and noted that it was warm, but not hot, to the touch. While not surprising at all, just be sure to have some ventilation around the top and rear of the unit as you would with any high performance amplifier. Keep in mind also that larger rooms demand higher continuous power output levels to achieve the same listening levels of a smaller room, so if you plan on cranking this receiver to insane levels for long periods of time in a large room, you may want to consider supplementing your system with a robust dedicated amplifier.
I next turned up Track 7 "I Can't Tell You Why" of the Eagles: Hell Freezes Over DTS DVD. Vocals sounded natural and uncompressed and the drums had a very smooth sound that arrived at the listening position unimpeded, as I expected. There were no surprises as I moved on to Track 13 "Life in the Fast Lane" and listened to Don Henley's lead vocals rough their way through the song while Joe Walsh creatively nursed his guitar to speak. Overall, multi-channel music sounded natural and convincing even at high SPLs.
 Two-Channel
I listened to a host of my favorite
2-channel selections, including James Taylor's
Greatest Hits
and some relative unknowns such
as Laura Story's
Indescribable
, which has
become one of my recent favorites. Add to these selections tracks from Steely Dan, Seal and Toto and
you have a well-rounded suite of listening material.
Using Yamaha's Pure Direct mode I was able to really experience what the RX-V2500's amplifiers were capable of putting out. Pure Direct puts the unit in 2-channel bypass mode with no sub output. With my main speakers set to Large the Yamaha's amp was working hard, driving full range frequencies to both of my 4-ohm RBH 1266-LSE mains. This receiver can play loud and was able to accurately reproduce bass transients in a way that was remarkable for a receiver priced just over $1000. The overall sound was capable of being precise and detailed while still retaining the ability to power through demanding material.
Listening Tests - Movies
I wanted to give the Yamaha RX-V2500 amplifiers a thorough workout by driving all of its channels at fairly high SPLs. Placing a few select DVDs into the DVD player, I sat back to watch some high-impact movie scenes. Remember that for these tests, the Yamaha had configured all of my speakers to "Large", including the surrounds, so the amplifier was sending full range signal to all the speakers, including the low frequency information. The only sound going to the subwoofer was the dedicated LFE track. I engaged the Presence Channels and turned off the EQ for these tests as well.
In addition to playing my all-time favorite film, The Fifth Element, I popped in the newly-released Star Wars Episode IV: A New Hope to see how it sounded coming through the Yamaha. I wasn't disappointed. When explosions and laser fire weren't arcing through the speakers, John Williams' score was certain to be bellowing through on all sides. These movies do a great job at surrounding the listener and really pulling you into the action. With Yamaha's presence channels activated, the experience was, quite literally, lifted onto the big screen as we watched the films on a 100" diagonal Stewart Filmscreen Studiotek 130 powered by Yamaha's LPX-510 LCD projector. Turn on one of the 70mm Cinema DSP modes and you may never again watch a movie in your home without Yamaha DSP!
For some additional explosive action, I continued my listening sessions with Farscape: The Complete Third Season . Farscape is, in my opinion, one of the greatest series ever to arrive on television. The quality of the show is equaled by the soundtrack and score which came through with flying colors, at times audibly transforming my listening room into the living ship that is one of the primary Farscape sets.
Back when I had my RX-V3000, I would use some of the attack scenes in Pearl Harbor to demonstrate what the Presence Channels and Yamaha's Cinema DSP could do. I felt it appropriate to review the same scenes with the RX-V2500 to see how they fared and if my experience was as dramatic as it had been with the older receiver. I was not disappointed. In fact, I was again blown away by the stark contrast between standard 5.1 content and a 5.1+2 mix with Cinema DSP. For those utilizing a front projection system, Cinema DSP simply makes the movie going experience more epic with a wider soundstage and a great illusion of being part of the action. In addition, for those of you with an elevated screen, you can utilize the RX-V2500's Dialogue Lift to place some of the center channel content into the presence channels. The result is dialogue and action that is more aligned with the projector screen (rather than below it). When utilizing Dialogue Lift I actually preferred to engage the YPAO EQ into "Front" mode so that the Presence channels were EQ'ed to more closely match the timbre of my main speakers.
For movies I consistently found the General Cinema DSP mode to enhance the presentation without becoming distracting or artificially corrupting the surround track.
Editorial Note: Presence Channels
The Yamaha RX-V2500 allows you to select either Presence channels or Back Surround channels, not both. Even if you have an external amp, there is no facility for providing preamp outputs to both Presence and Back Surrounds at the same time. It would be great to see Yamaha to allow for both (even if one set is not amplified) in future iterations of this model.
Yamaha RX-V2500 Benchmark Tests - Part 1
There has been much discussion on many of the audio forums lately regarding mid priced A/V receivers power capabilities as well as their abilities to drive low impedance loads. Much of the controversy steams around the infamous "All Channels Driven Test" which simulates a best case test load in a worst case environment and by all intents and purposes an unrealistic real world scenario. For more information on this, the reader is encouraged to read our articles on the All Channels Driven Test Controversy and Product Managing Receiver Platforms.
With that, lets all first remember that receivers in the $1k price range from the leading companies today are an absolute bargain regarding their processing power, features, and performance. I like to think of them as an excellent Preamp/Processor (usually rivaling many costlier Pre/Pros) with a free amp thrown in. Whether the amp section within the said receiver is "good enough" depends on the following variables:
- Loudspeaker Impedance
- Loudspeaker Efficiency
- Room Size
- Room Acoustics
- Listening Preferences
- Whether or not you apply bass management to your Loudspeakers and utilize a dedicated powered subwoofer(s).
As you can see, there are a number of variables and the answer is simply not that straight forward. Let's continue on and establish some of the critical test criteria for gauging amplifier performance.
THD and IMD Distortion - This is a measure of how well an amplifier can faithfully reproduce a signal without introducing any artifacts or harmonics. While this is an important metric to consider, most solid state amps these days boast pretty low figures here (usually well below audibility) and are rarely a real world problem for well designed amplifiers.
Signal to Noise Ratio - This is a measurement of importance to consider as it is a ratio of the magnitude of the signal and background noise. Many amplifier manufacturers publish their SNR figures at full power, which can be misleading and hard to compare between different amplifiers at differently rated power levels. Many also apply weighing filters to yield better results such as dBa or dBc. This can make over a 10dB difference compared to unweighted measurements and should be noted when comparing various amplifiers. It is best to look at 1 watt levels (where the amp spends most of its time) and interpolate the SNR at the amplifiers full rated power. We will leave this topic for another article in the near future.
Frequency Response - This is a measure of how well an amplifier will reproduce a signal without attenuation or boosting with ideal being flat within the range of human hearing 20Hz to 20kHz +/- 0dB. This again is rarely a problem with well designed amps and there should be little reason why an amplifier cannot maintain at least +-.5dB from 20Hz to 20kHz. Some amps do result in excessive power fall off at high frequency due to slew rate induced distortion and this is something to watch out for. Thus why we check frequency response at 1 watt and full power for our amplifier testing.
Amplifier Output Impedance - This again is an important metric as it determines the amount of interaction or frequency response variation an amplifier may produce when driven by a reactive loudspeaker load. Usually lower is better, but some do prefer high output impedance tube amps for example since they can excessively roll off high frequency response and result in a warm sound. Note, sonically preferring something doesn't necessarily mean its more accurate or precise.
Damping Factor - This specification is somewhat overstated by most manufacturers and the reader is encouraged to reference our article: Damping Factor - Effects on System Response for more information. I still like to check for this as it is a good indication of amplifier output impedance and power supply capability. However, in real world scenarios, cable impedance usually nullifies the benefits of a very high damping factor and thus beyond a certain value as stipulated in the aforementioned article it becomes mostly academic.
Amplifier Measurement Techniques
Required Test Equipment
- Non inductive Resistors (8 ohms, 4 ohms)
- Oscilloscope
- Short 10AWG Speaker Cables
- Function Generator
Measuring Output Impedance and Power of Amplifiers
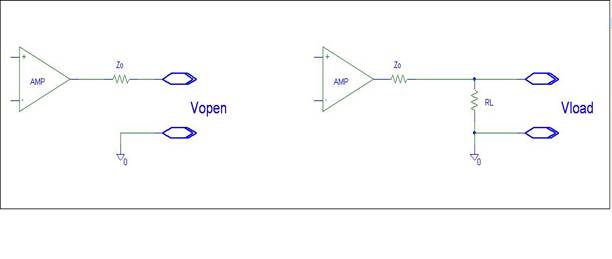
Step 1: Adjust the function generator until you read 2.82Vrms on the Unloaded amplifier as depicted in the left figure above. Record these results in Table 1. under 'Vopen' over the entire frequency range.
Step 2: Attach a non inductive Load to the amplifier and re-measure the output voltage over frequency and record the data in the appropriate 舠 Vload 舡 column specific to the load impedance used in this test in the three Tables below. Do NOT vary amplitude of the function generator, only Frequency.
Step 3: Calculate the amplifier output impedance (Zo) with the following relationship.
VLoad = (RL / RL+Zo)*Vopen
Solve for Zo = > Zo = RL*Vopen/VLoad - RL
and
System Damping Factor = (RL+Rcable) / Zo
Step 4 : Plot the data from the Tables into Figures in excel.
Step 5 : Find the maximum unclipped voltage the amplifier can provide into the specified test load.
Step 6: Record the voltage over the specified frequency range.
Step 7: Detach the test load and record the voltage 'Vopen' vs frequency repeating step 3 to calculate output impedance.
Note: The following variables limit the absolute accuracy of this test method:
- Cable impedance and stray inductance in resistor
- Variance in line voltage (since all tests are done without a line stabilizer)
However, this is more of a real world than typical ideal test condition, thus for all intents and purposes serves well for this application.
Test Notes:
- The 8ohm test load + test cable measured: Rdc = 8.04 ohms ; Ls = 5uH (1kHz)
- The 4 ohm test load + test cable measured: Rdc = 4.03 ohms ; Ls = 3.8uH (1kHz)
- All measurements were done in 'Pure Direct Mode'
- Line Voltage was NOT held constant and varied between 117-119VAC
- All tests were conducted on the main channels of the RX-V2500
- All tests were conducted using EXT Multi-CH Inputs and Outputs when appropriate
Measurements and Analysis for Yamaha RX-V2500 A/V Receiver
Line Level, 8-ohm Load (RL=10kohm)
|
Frequency |
Vopen |
VLoad |
Zo |
Freq Resp |
Damping Factor |
Vout |
Freq Resp |
|
20 |
2.81 |
2.77 |
0.116 |
-0.09 |
69 |
0.99 |
-0.09 |
|
100 |
2.8 |
2.79 |
0.029 |
-0.03 |
279 |
0.99 |
-0.09 |
|
250 |
2.81 |
2.8 |
0.029 |
0.00 |
280 |
0.99 |
-0.09 |
|
500 |
2.82 |
2.8 |
0.057 |
0.00 |
140 |
0.99 |
-0.09 |
|
1000 |
2.83 |
2.8 |
0.086 |
0.00 |
93 |
0.99 |
-0.09 |
|
2500 |
2.82 |
2.79 |
0.086 |
-0.03 |
93 |
0.99 |
-0.09 |
|
5000 |
2.81 |
2.8 |
0.029 |
0.00 |
280 |
1 |
0.00 |
|
10000 |
2.82 |
2.79 |
0.086 |
-0.03 |
93 |
1 |
0.00 |
|
16000 |
2.82 |
2.77 |
0.145 |
-0.09 |
55 |
0.99 |
-0.09 |
|
20000 |
2.79 |
2.76 |
0.091 |
-0.14 |
88 |
0.99 |
-0.10 |
Table 1. 1 Watt Amplifier Tests & Line Level Measurements
|
|
|
|
8ohm; 1CH |
8ohm; 2CH |
1CH | 2CH |
|
|
Frequency |
Vopen |
VLoad |
Vload |
Zo |
Power |
Power |
Damping Factor |
|
20 |
34.5 |
34.4 |
33 |
0.023 |
147 |
135 |
344 |
|
100 |
34.5 |
34.2 |
32.6 |
0.071 |
145 |
132 |
114 |
|
250 |
34.8 |
34.4 |
32.8 |
0.093 |
147 |
134 |
86 |
|
500 |
34.8 |
34.4 |
32.9 |
0.093 |
147 |
135 |
86 |
|
1000 |
34.6 |
34.5 |
33 |
0.023 |
148 |
135 |
345 |
|
2500 |
34.7 |
34.4 |
33.1 |
0.070 |
147 |
136 |
115 |
|
5000 |
34.7 |
34.2 |
33 |
0.118 |
145 |
135 |
68.4 |
|
10000 |
34.5 |
34.3 |
33.1 |
0.047 |
146 |
136 |
172 |
|
16000 |
34.4 |
34.2 |
33 |
0.047 |
145 |
135 |
171 |
|
20000 |
33.8 |
33.3 |
32.2 |
0.126 |
143 |
134 |
64 |
Table 2. Full Unclipped Power Amplifier Tests for 8 ohm load
Full Power, 4-ohm Load
|
|
|
|
|
|
4ohm; 1CH |
4ohm; 2CH |
|
|
Frequency |
Vopen |
VLoad |
Vload |
Zo |
Power |
Power |
Damping Factor |
|
20 |
34.5 |
28.3 |
21.9 |
0.883 |
199 |
119 |
5 |
|
100 |
34.5 |
28.4 |
22 |
0.866 |
200 |
120 |
4.7 |
|
250 |
34.8 |
28.5 |
22 |
0.891 |
202 |
120 |
4.5 |
|
500 |
34.8 |
28.5 |
22 |
0.891 |
202 |
120 |
4.5 |
|
1000 |
34.6 |
28.3 |
22 |
0.897 |
199 |
120 |
4 |
|
2500 |
34.7 |
28.3 |
21.9 |
0.911 |
199 |
119 |
4 |
|
5000 |
34.7 |
28.4 |
21.8 |
0.894 |
200 |
118 |
4.51 |
|
10000 |
34.5 |
28.1 |
22 |
0.918 |
196 |
120 |
4 |
|
16000 |
34.4 |
28.1 |
21.6 |
0.904 |
196 |
116 |
4 |
|
20000 |
33.8 |
28.0 |
21.1 |
0.839 |
196 |
115 |
5 |
Table 3. Full Unclipped Power Amplifier Tests for 4ohm load
Yamaha RX-V2500 Benchmark Tests - Part 2
Figure 1. Line Level Attenuation vs Frequency Response
Before measuring amplifier performance, I thought it was good practice to first sweep the preamp section of the RX-V2500. As you can see, the RX-V2500 frequency response via the line level outputs into a 10kohm test load was 20Hz to 20kHz +0 / -0.1dB. This is a very good response and indicates the RX-V2500 would serve as a great preamp / processor to those wishing to use separate power amplifiers.
Figure 2. Amplifier Output
Impedance vs Frequency at 1 Watt
The RX-V2500 has relatively low output impedance when driving an 8 ohm load. The rising impedance with frequency could be attributed to zobel compensation and/or series inductance after the feedback path for added stability which is normal practice in many receivers and power amps and especially not an issue for a receiver in this price range.
Figure 3. Damping Factor vs
Frequency Response @ 1 Watt into 8 Ohms
The RX-V2500 had sufficient damping factor as per Damping Factor – Effects on System into an 8 ohm load. Yamaha does specify a damping factor of 140, but don’t really say how exactly it was measured and at what power levels and frequencies.
Figure 4. Attenuation vs Frequency
Response @ 1 Watt 8 Ohms
The Yamaha RX-V2500 exhibited good frequency response into an 8ohm load at 1 watt as indicated by our measurement of: 20Hz to 20kHz +0 / - 0.15dB. Note that this does not factor in losses due to cable impedance and stray inductance from the test load. In reality I would suspect the loss at 20kHz would be more like - 0.1dB, just like the preamp line level path I previously measured.
Figure 5. Damping Factor vs
Frequency Response @ Full Power
This test is most interesting as it shows the RX-V2500 has excellent damping factor into an 8 ohm load, but goes to a meager average range of 5 when driving a 4 ohm load at full power. I suspect the damping factor may be slightly better than measured here as the cable impedance is certainly coming into effect here. This does demonstrate the amplifier is not acting like an ideal voltage source (even very few dedicate amps do) and is getting loaded down by the low impedance. What is also likely is the limiting circuitry is raising the output impedance to limit delivered power to the low impedance load. This however, is not surprising or disappointing for a receiver in this price class, especially since it is not specified to drive 4 ohm loads but as you will see below, does a commendable job doing so.
Figure 6. Maximum Unclipped Power
vs Frequency
The Yamaha RX-V2500 does a bang up job in power delivery into 8 ohms. While it is specified to deliver 130wpc into 8 ohms, I actually measured a whopping 148wpc with one channel driven and 135wpc into 8 ohms with 2 channels driven unclipped!
What’s even more impressive is that it did so with only 0.05dB additional attenuation at 20kHz when compared to the 1 watt frequency response test. What this demonstrates is excellent frequency response uniformity at all power levels. Kudos to a receiver that delivers all the latest bells and whistle with a free 7CH amp thrown in!
Driving 4 ohm loads is certainly not the RX-V2500’s forte, but it did a commendable job considering. It was able to deliver 200wpc with one channel driven and about 110wpc with 2 channels driven unclipped. Initially I cranked more power out under these test conditions from 20Hz to about 15kHz but then found major slew induced distortion at higher frequencies followed by a rapid shut down of the receiver. This is very good news actually since the amplifier automatically shuts down once bandwidth uniformity has been compromised for being driven too hard and is a good preventative measure for protecting both the amplifiers and the loudspeakers. This shouldn’t be a real world problem because at high frequencies very little power is being delivered to the speaker system since music is mostly harmonic in nature above 13kHz or so. The real power demand is in the bass and in most home theater systems a dedicated subwoofer or two is used to alleviate this problem.
Considering this, I backed off on the Yammie until I had a pristine unclipped waveform at 20kHz to come up with the measurements published herein. It should also be noted that anytime I drove 4 ohm loads at full power, the fan came on shortly after. I caution those using 4 ohm speakers to make sure you have plenty of ventilation and airflow.
Recommendations
The Yamaha RX-V2500 has respectable amplifier performance for a receiver in its price class and should serve most home theater environments quite well. I advise against using low efficient 4 ohm speakers in environments where you like to play your music loudly and your room dimensions exceed 2000 ft^3. For best results, my advice is to use reasonably efficient (88dB or higher) 6-8 ohm speakers (4 ohm may be used if their efficiency is 90dB or greater and you provide adequate ventilation) and apply bass management to all channels and route the power hungry bass information to a dedicated subwoofer or two. If you find you need more power in the future, simply preamp out to a dedicated amp and you have yourself a great processor with all the latest surround formats on board.
Yamaha RX-V2500 RAV352 Remote Control and Conclusion
 The Yamaha RAV352 remote control has some great
benefits and a few
"why did they do that?"
near misses:
The Yamaha RAV352 remote control has some great
benefits and a few
"why did they do that?"
near misses:
Pros
- Very easily programmed
- Fits nicely in the hand, new thinner design
- Dedicated receiver volume
- Source switch for controlling inactive components
Cons
- Seafoam button labels unreadable in dark, even with backlight
- Backlight barely lights up keypad
- Keypad does not adhere to standard layout
As I hinted at earlier, I liked what Yamaha had done with the RX-V2500's redesigned remote control. The RAV352 fits assertively in the hand so that most commonly used keys are positioned within easy reach of the thumb. This includes volume, channels, Menu, navigational and the Enter button. Even DSP functions are within easy reach without having to maneuver the remote control. The only drawback to that is that with a DVR I am constantly using the fast forward and rewind buttons - all of which are located below the keypad/DSP section.
The fact that all keys are now backlit (activated via a button on the left side of the remote) would be cause for small celebration except that the remote stopped just short of the first down and opted to include "sea foam" colored labels on many of the primary buttons - rendering them nearly invisible in the dark, even when backlit. One other thing to note is that the numeric keys (which are not arranged in the familiar 4 rows of 3 format) are also poorly and unevenly backlit. It's a crime. Perhaps all of the manufacturers are finally catching on to the fact that many remotes may be used in the dark, though apparently RX-V1500 owners will not be as fortunate to receive a fully backlit remote. I say light the remote hard , and light it up blue with low power, high-performance LEDs. If you're going to light it, make sure all the buttons are visible and that you can use the remote to summon for help in the event that you are lost at sea.
Programming the remote is simple. The only difficulty I had was that the programming buttons were somewhat good at eluding the tip of my ballpoint pen. Often times it would take me 4-5 tries to lock in a learned device. A paperclip may render this comment moot.
I also like the feel of the buttons themselves. The no-slip texture is easy on the hands and helps ensure you select the right buttons. Users of previous Yamaha remotes will need to get used to flipping the new AMP/SOURCE/TV switch which is a nice development that instantly directs remote control commands between the receiver, currently selected source, or television (as programmed into the DTV source.)
Separate power buttons for the receiver, source and television help ensure that you'll never mistakenly turn off the wrong device.
Conclusions and Overall Perceptions
Certainly the Yamaha RX-V2500 is not the year's greatest achievement - I mean, it's not like they launched a commercial spaceship into orbit, right? It is, however, quite possibly the most amazing receiver you will find for just over $1000. With a fairly accurate YPAO system and room corrective EQ that doesn't sound half bad, this is a receiver to be reckoned with - and you can bet other manufacturers are watching. Yamaha has consistently provided improvements to its lineups over the years, but since 2003 they have been on a mission - and technological progress and excellence appears to be their goal. As we concern ourselves more and more with room acoustics and technology that makes it easy to setup and manage our home theater systems, products that incorporate technologies like Yamaha's GUI and YPAO systems are imperative. And what's more, they are going to be expected. We're happy that there are a few leading companies out there bringing these technologies home and daring the market as a whole to keep up.
The Score Card
The scoring below is based on each piece of equipment doing the duty it is designed for. The numbers are weighed heavily with respect to the individual cost of each unit, thus giving a rating roughly equal to:
Performance × Price Factor/Value = Rating
Audioholics.com note: The ratings indicated below are based on subjective listening and objective testing of the product in question. The rating scale is based on performance/value ratio. If you notice better performing products in future reviews that have lower numbers in certain areas, be aware that the value factor is most likely the culprit. Other Audioholics reviewers may rate products solely based on performance, and each reviewer has his/her own system for ratings.
Audioholics Rating Scale
 — Excellent
- — Very Good
- — Good
- — Fair
- — Poor
| Metric | Rating |
|---|---|
| Frequency Response Linearity | |
| SNR | |
| Output Impedance | |
| Measured Power (8-ohms) | |
| Measured Power (4-ohms) | |
| Multi-channel Audio Performance | |
| Two-channel Audio Performance | |
| Video Processing | |
| Bass Management | |
| Build Quality | |
| Fit and Finish | |
| Ergonomics & Usability | |
| Ease of Setup | |
| Features | |
| Remote Control | |
| Performance | |
| Value |
Clint Deboer was terminated from Audioholics for misconduct on April 4th, 2014. He no longer represents Audioholics in any fashion.
View full profile