
Onkyo TX-SR805 AV Receiver Review
Onkyo TX-SR805
- Product Name: TX-SR805
- Manufacturer: Onkyo
- Performance Rating:


- Value Rating:
- Review Date: November 09, 2007 16:50
- MSRP: $ 1099
Amplifier section
130wpc x 7 @ 0.05% THD
THX Certified Ultra2
Onkyo Wide Range Amplifier Technology (WRAT)
Amplifier frequency response
5Hz-100kHz
Discrete circuitry using dual
push-pull design
Certified 4 ohm performance
High Current Power Supply with
instantaneous current capability rated at 60A
S/N ratio (line in IHF-A) 110dB
Assignable channels for bi-amped
front channels or powered zone2
Detachable AC Cord
Audio/Video Processing
HDMI 1.3a with repeater and
1080p bandwidth
HDMI Deep Color (36bit) support
3 x 32bit Texas Instruments DSP
processors
Faroudja Edge Directional
Correlation Deinterlacing (DCDi)
Dolby Digital Plus, Dolby
TrueHD, and DTS-HD Master Audio decoding
THX processing: Boundary Gain
Compensation (BGC) and Advanced Speaker Array (ASA)
Neural THX Surround decoder
with XM HD Surround Sound support
Audyssey MultEQ XT (8
positions) or manual 7 Band Speaker EQ
Auto Speaker Calibration
w/microphone using Audyssey MultEQ XT
Direct/pure audio modes
192K/24 Bit Burr Brown DAC for
each channel
Independently assignable audio
channels
Independent crossover frequency
adjustment for LR, C, SR, SB channels at
40/50/60/70/80/90/100/120/150/200Hz
Independent bass/treble control
for all channels
Double Bass Function
AV Sync up to 250ms in 5ms
increments
Powered zone2 with volume,
balance, bass, and treble
Audio/Video Connectivity
HDMI ports 3 input/1output
Component video 3 input/1output
@ 5Hz-100MHz bandwidth
Composite/S-Video 6
input/1output each
Digital audio 3 optical/3
coaxial inputs, 1 optical output
2 channel analog audio 9
input/2 output including phono in (MM)
7.1 multi-channel analog
input/output
Zone2/zone3 stereo line out
·
Auxiliary front
panel A/V inputs
¼” Headphone jack
iPod ready using separate Onkyo
DS-A2
XM Radio ready connection
SIRIUS Radio ready connection
Miscellaneous
On screen display
Integration Access RS-232
IR input/output Onkyo-RI System
Control
12V Trigger (Zone2)
IntelliVolume
Late Night Mode (high/low/off)
Programmable/Learning back-lit
remote control
Color-coded speaker terminals
Solid aluminum front panel and
door
2 year warranty
Dimensions
(WxHxD): 17 1/8” x 7 5/8” x 18 1/16”
Weight: 50.9 pounds
Pros
- Features and flexibility exceeding price competitors
- HDMI 1.3a compliant
- Dolby TrueHD and DTS Master Audio decoding
- Audyssey MultEQ XT improves focus and coherence
- THX Ultra2 Certified
- Larger power supply than competitive products
Cons
- Runs hot
- LFE does not support identical crossover frequencies as main channels
- Single subwoofer out connection
- Occasionally drops HDMI signal when exiting setup
- Automatic speaker setup missed a few settings
Onkyo TX-SR805 Introduction
 As both a former
Onkyo owner and as a recent inductee into the early adopter club of HD optical
disc formats, the arrival of Onkyo’s newest receivers, with not only the latest
HD video capability but also native HD audio capability, piqued my
interest. First on the scene, Onkyo has
released five receivers, the TX-SR605, TX-SR705, TX-SR805, TX-SR875, and the
TX-NR905 all of which support the latest lossless HD audio codecs, namely Dolby
TrueHD (DTHD) and DTS Master Audio (DTS MA), in addition to the latest digital
video support through HDMI 1.3a.
As both a former
Onkyo owner and as a recent inductee into the early adopter club of HD optical
disc formats, the arrival of Onkyo’s newest receivers, with not only the latest
HD video capability but also native HD audio capability, piqued my
interest. First on the scene, Onkyo has
released five receivers, the TX-SR605, TX-SR705, TX-SR805, TX-SR875, and the
TX-NR905 all of which support the latest lossless HD audio codecs, namely Dolby
TrueHD (DTHD) and DTS Master Audio (DTS MA), in addition to the latest digital
video support through HDMI 1.3a.
Looking at the feature sets available on the TX-SR605 and the TX-SR805 while considering the price, the new Onkyo models are definitely attention getters. The spec sheet alone puts this receiver far out in front of the competition at this price point.
Onkyo has long had a reputation for building good quality audio gear and as being an excellent choice, along with the likes of Denon and Yamaha, for components to step up from basic, entry level gear. My first personal introduction to Onkyo was a college roommate, freshman year, who had an Onkyo receiver that showed to limits of my mid-fi receiver. Budding Audiophile that I was, I one upped him with an even bigger Denon integrated amplifier. While I had higher power in the more expensive integrated amplifier, it was clear that the two pieces were in the same class, unlike the receiver I had replaced.
Remembering that first introduction, Onkyo was on my list as I began developing a home theater and at that time, I felt Onkyo edged out Denon when I looked at both for value. My experiences with the TX-SR602, predecessor to the current TX-SR605, had all been positive and provided support for my impression of Onkyo. Now with the TX-SR-805 in my hands, I can see it this is a continuing trend.
Onkyo TX-SR805 Design and Construction
 The Onkyo TX-SR805 receiver is
a larger receiver, at a height of 7 5/8” and weighing in at over 50 pounds, it
is a bit heftier than many run of the mill midrange components. Actually, at its asking price, the TX-SR805
outweighs other competitive receivers by about 10 lbs, an increase of 125% over
the typical weight.
The Onkyo TX-SR805 receiver is
a larger receiver, at a height of 7 5/8” and weighing in at over 50 pounds, it
is a bit heftier than many run of the mill midrange components. Actually, at its asking price, the TX-SR805
outweighs other competitive receivers by about 10 lbs, an increase of 125% over
the typical weight.
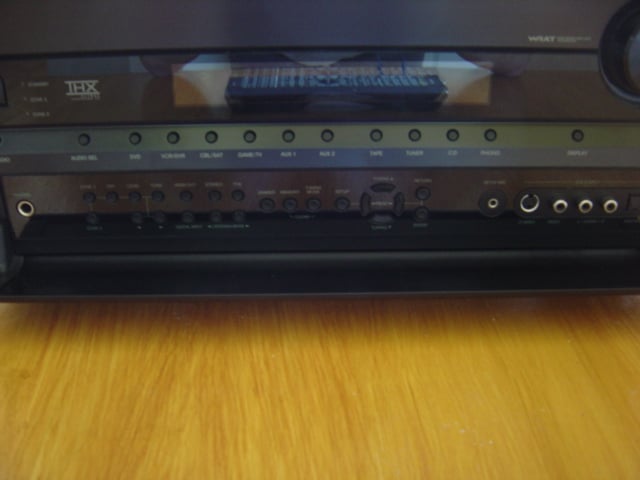
The chassis is constructed of typical light gage steel but with a relatively thick-brushed aluminum faceplate, again by receiver standards, and is available in a black or a silver finish. The sample sent for the review was the black model.
 The front panel is
clean, with most of the controls tucked away behind an aluminum foldout door
secured with the typical push type latch.
The general appearance has been updated some in the last few years since
the 602 was current. The recessed volume
knob is backlit with a very nice cobalt blue that is adjustable as part of the
front panel dimmer/off function.
Unfortunately, the front text display does not use the same color,
instead going with a bluish green that is an odd match.
The front panel is
clean, with most of the controls tucked away behind an aluminum foldout door
secured with the typical push type latch.
The general appearance has been updated some in the last few years since
the 602 was current. The recessed volume
knob is backlit with a very nice cobalt blue that is adjustable as part of the
front panel dimmer/off function.
Unfortunately, the front text display does not use the same color,
instead going with a bluish green that is an odd match.
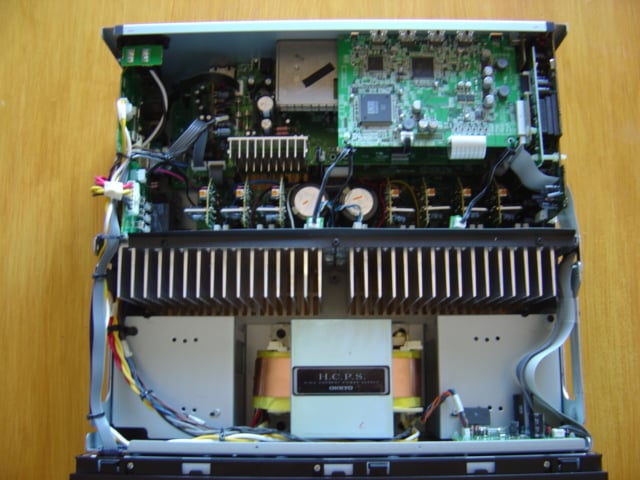
Upon removing the top cover, we see that cover steel gage is slightly
thicker than 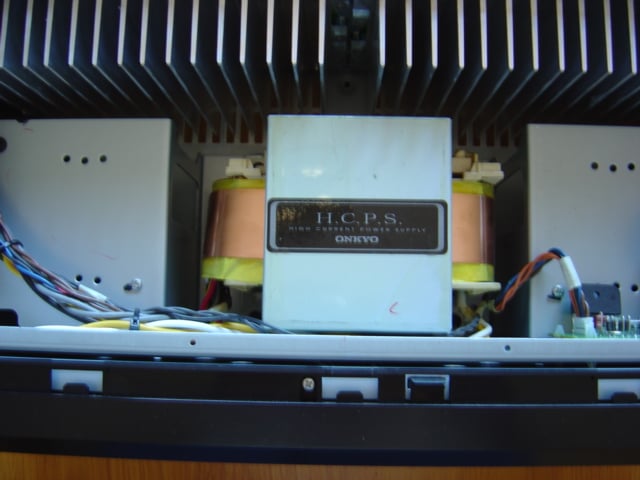 typical and that the chassis is still sturdy even without it. The sides of the chassis interior have full
length, half height side panels that provide frame continuity to the front and
back panels. The heat sink and front
panel are connected with an additional full height frame also connected to the
side panel, which provides additional rigidity for the weight of the
transformer.
typical and that the chassis is still sturdy even without it. The sides of the chassis interior have full
length, half height side panels that provide frame continuity to the front and
back panels. The heat sink and front
panel are connected with an additional full height frame also connected to the
side panel, which provides additional rigidity for the weight of the
transformer.
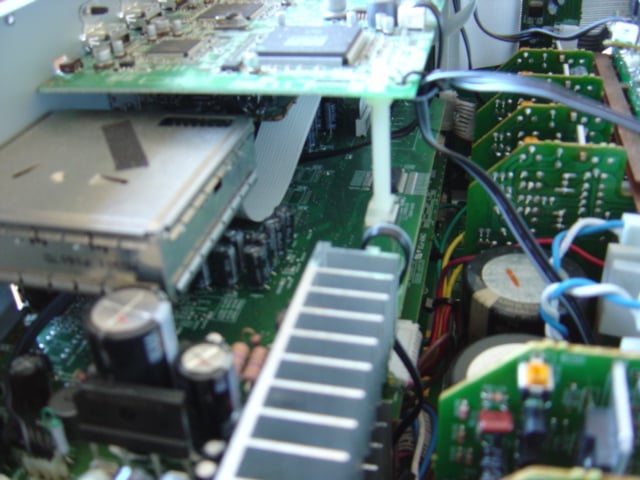
Inside, the Onkyo TX-SR805 is densely packed but very cleanly laid out,
with a minimum of wire bundles strung across the inside of the chassis unlike
some receivers that I have seen. The
main power run is routed to the transformer along 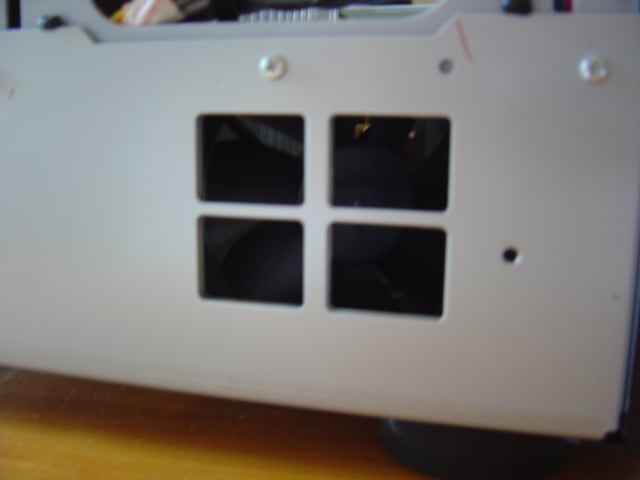 the left side panel, but
other than a few other short wire runs and some short runs of computer styled
ribbon cable there is very little in the way of cabling spaghetti. Short, clean internal cabling runs suggests a
well thought out component arrangement where every circuit is near to where it
is supposed to be in order to do its part along the chain. It suggests, to me, that perhaps this Onkyo
receiver was a little more carefully designed than other competing products.
the left side panel, but
other than a few other short wire runs and some short runs of computer styled
ribbon cable there is very little in the way of cabling spaghetti. Short, clean internal cabling runs suggests a
well thought out component arrangement where every circuit is near to where it
is supposed to be in order to do its part along the chain. It suggests, to me, that perhaps this Onkyo
receiver was a little more carefully designed than other competing products.
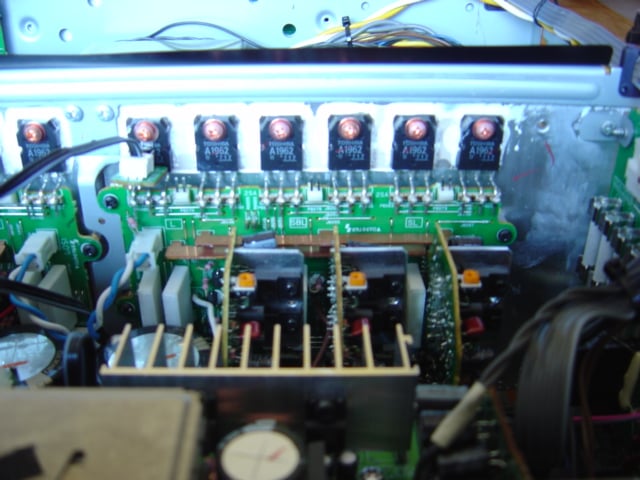
Centered at the front is a large EI core transformer that is separated
from the rest 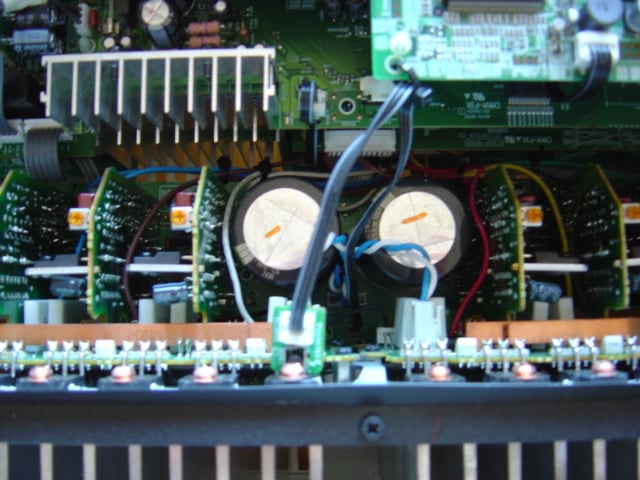 of the circuitry by a full width machined aluminum heat
sink. The main transformer is flanked by
two light gage housings that mount 80 mm exhaust fans with vents at the front
of each side panel.
of the circuitry by a full width machined aluminum heat
sink. The main transformer is flanked by
two light gage housings that mount 80 mm exhaust fans with vents at the front
of each side panel.
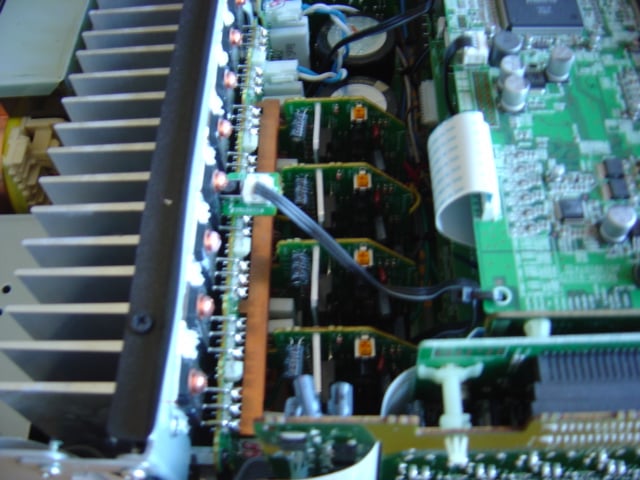
Coupled to the back of the heat sink are seven discrete amplifier boards for the power output stage. Nestled in between the amplifier boards is a pair of decent sized main power supply capacitors.
The back third of the housing is occupied by the input, output, and
processing circuit boards. These boards
consist of a discrete digital a/v board at the HDMI 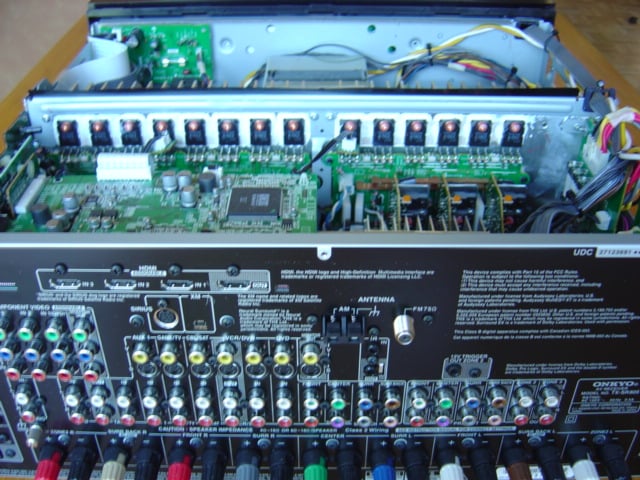 inputs, a digital audio
board at the coax/toslink inputs, a shielded board for the radio inputs, an analog
a/v input board with a supplementary aluminum heat sink, and power supply input
boards at the left.
inputs, a digital audio
board at the coax/toslink inputs, a shielded board for the radio inputs, an analog
a/v input board with a supplementary aluminum heat sink, and power supply input
boards at the left.
The power amplifier design of the TX-SR805 is a discrete dual push-pull configuration for which Onkyo received THX Ultra2 certification. Amplifier distortion is controlled with a three stage inverted Darlington circuit and the TX-SR805 boasts a 110 dB S/N ratio at full power. Onkyo claims the amplifier section is rated to drive 4 ohm speaker loads and is said to be capable of 60 amps of instantaneous current.
As I have said previously, the power supply of the TX-SR805 is unusually beefy for this price range and there is no other receiver on the market near this price that features a THX Ultra2 certified amplifier section. The power feed is supplied at the rear left corner and is protected by a main power supply fuse that is rated 12A at 125V, allowing a maximum outlet draw of P = 12A x 125V = 1500W. The seven amplified channels of the TX-SR805 are rated to output 130W each providing a potential momentary output total of 910W. The aforementioned main power supply capacitors are of Onkyo manufacture with 2 x 15000F at 71V that allows plenty of headroom for the rail voltage.
Onkyo TX-SR5805 Features
 The TX-SR805 is a very flexible receiver with
a number of features and functionality built in to allow a fair amount of
control. The receiver has many of the
typical installation control features, an RS-232 port for programming, IR
input/output, Onkyo-RI System Control for use with other Onkyo components, and
12V triggers to daisy chain power up with other components.
The TX-SR805 is a very flexible receiver with
a number of features and functionality built in to allow a fair amount of
control. The receiver has many of the
typical installation control features, an RS-232 port for programming, IR
input/output, Onkyo-RI System Control for use with other Onkyo components, and
12V triggers to daisy chain power up with other components.
The TX-SR805 features full HDMI 1.3a audio and video functionality. Signal bandwidth supports 1080p60 video and 36 bit Deep Color. Audio support is provided for bit rates of all the next generation codecs, DD+, DTHD, DTS HD, DTS MA, and uncompressed multi-channel LPCM. The TX-SR805 has three HDMI inputs as well as an output with an HDMI repeater to allow greater cable run lengths.
The receiver is capable of three zone operation with an optional powered zone 2 or zone 2 out and a zone 3 out. Combinations can include a main 7.1 surround zone with two stereo zone preamp outs or a main 5.1 with zone 2 powered by reassigning the main zone rear channel and the preamp out zone 3. The TX-SR805’s assignable audio amplifiers can also be used to bi-amp the main L/R channels.
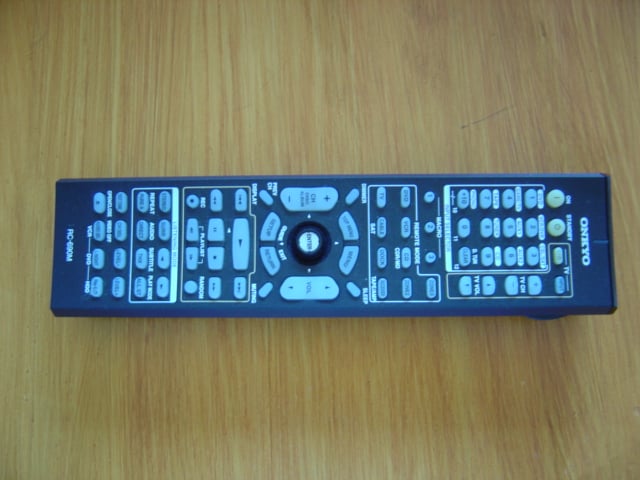 The remote control is a standard Onkyo design
that has been in use at least since the TX-SRxx2 generation, it is identical to
what I recall of my TX-SR602 remote. It
has a fairly standard feature set typical of most A/V receiver remotes. In addition to the obvious, it has
programmable universal remote capability via a host of remote codes for various
manufacturers and supports three programmable macros.
The remote control is a standard Onkyo design
that has been in use at least since the TX-SRxx2 generation, it is identical to
what I recall of my TX-SR602 remote. It
has a fairly standard feature set typical of most A/V receiver remotes. In addition to the obvious, it has
programmable universal remote capability via a host of remote codes for various
manufacturers and supports three programmable macros.
At the preamp switching level, each input channel allows for fully independent assignment of audio and video input types. Every video channel can be set to receive any input signal: HDMI, component, S-video, or composite video and each video source can then be assigned and switched between multiple audio input sources. In effect, the same video source can be assigned audio input via HDMI, SPDIF, and analog audio. For example, a DVD-V/DVD-A player would be allowed to use a single video input to switch between either HDMI or SPDIF digital input, for movies, and multi-channel analog, for use with DVD-A playback. With this feature, I was able to route HDMI video/audio from the HD-A2 and HDMI video with multi-channel analog from the HTPC.
The pre/pro section allows for independent crossover settings for each speaker group: main L/R, center, surround L/R, and back L/R channels. Surround setups, like my reference system, that use towers for the mains L/R can have a lower crossover frequency independent from bookshelf surrounds and back channels. All tone controls and manual equalizer settings allow independent settings for each speaker group as well.
Various volume control features can be setup though the OSD, such as setting the power up and maximum volume levels. Handy if little ones are about who like to twist knobs and press buttons. Volume control on the TX-SR805 is adjustable in 0.5 dB increments and can be switched between a relative and absolute display setting. The receiver also includes a feature for setting relative volume for different zone 1 source components that Onkyo calls IntelliVolume, which allows adjustment by input channel in 1dB increments up to + or – 12 dB maximum.
In addition to the TX-SR805 achieving THX Ultra2 certification, the receiver includes a number of other THX processing technologies: Neural Surround, Boundary Gain Compensation (BGC), and Advanced Speaker Array (ASA).
Neural Surround is a codec for embedding additional channels into audio signals with a limited number of channels. For radio broadcasts, a 5.1 mix can be encoded into a stereo signal for transmission, and then decoded back into 5.1 surround sound by any Neural Surround capable receiver. Another application for Neural Surround that THX promotes is for gaming where soundtracks are limited to 5.1 channels. The Neural Surround codec can embed playback for 7.1 channels into a 5.1 channel scheme.
Editorial Note on THX
Boundary Gain Compensation is exactly what it says. A common acoustic phenomenon, room boundary gain is sound reinforcement that occurs at bass frequencies due to wall reflections when in close proximity to a wall. The change from a three dimensional space, 4
steradians, can boost bass by 6 dB. THX BGC is a filter that can be used to compensate for the effect to each channel.
THX Advanced Speaker Array is a calibration technique to approximate the different studio configurations used for mixing movie, music, and game soundtracks. Accurate recreation of the recorded sound field for each of these sources would require that speakers be physically relocated for every source change to match the original studio layout. ASA processing digitally compensates for use of a single speaker configuration in home theater settings to mimic the acoustical differences from the original mixing studio speaker arrangement for each source by use of a specific movie, music, and games mode setting.

The TX-SR805 includes Onkyo’s proprietary Theater Dimensional processing for virtual surround sound from stereo speaker arrays. This may seem like an unnecessary feature on an actual 7.1 channel surround receiver, but one possible use would be to mimic surround sound for use with zones, which are typically supplied stereo output from A/V receivers. Theater Dimensional processing, according to Onkyo, can also be used to doctor up near field performance of 5.1 speaker arrays in close quarters to increase the impression of space.
The audio processing on the TX-SR805 also includes Audyssey MultEQ XT acoustic room correction. MultEQ XT allows for correction of room acoustics issues using digital filters generated from up to eight in room measurements. These digital filters operate in the time domain but function as an equalizer that can smooth out frequency response without generating phase errors prevalent in typical frequency domain equalizers such as the ubiquitous graphic equalizer.
Editorial Note: Variations on Audyssey
Audyssey equalization is offered with various levels of room correction functionality, making this feature available for a wide range of product prices:
- EQ: Basic precalibrated system intended for HTiB that will eliminate the distortions caused by the speaker systems with room correction applied by assuming common room acoustics problems.
- 2EQ: Basic filter resolution applied to mid and upper frequencies based on two in room measurement positions.
- MultEQ: Moderate resolution filter applied to the full frequency response based on up to six in room measurements.
- MultEQ XT: Highest resolution using hundreds of points across the full frequency response for up to eight in room measurements.
- MultEQ Pro: Complete measurement software/hardware package used for professional system calibration.
Keep in mind that Audyssey can do a lot, but it is not panacea for all sonic shortcomings. The Audyssey system will correct for phase and frequency response errors introduced into playback by room acoustics and speaker coloration, but it cannot create recording detail lost by limits in audio system resolution and dynamic range. In a manner analogous to a video scalar, which can fill in the missing video lines, but can not recreate lost detail, Audyssey is simply another way to get the most out of the source material and electronics. Because there are compromises in using a digital filter to correct multiple listening positions, it is still good advice to make as much physical correction to the room as possible, leaving as much computational headroom for Audyssey in making the final touches.
Video Features
The TX-SR805 has modest video processing capabilities and it is clearly geared more for the audio side of the A/V equation. Considering that every other device in the video chain from source component to TV monitor has some form of video processing capabilities, including it in the receiver is another redundancy in an already overly redundant system. Onkyo’s offering in the TX-SR805 focuses the consumer’s dollar on audio, rather than another video scalar that may or may not be used.
Video processing for the TX-SR805 is provided by Faroudja DCDi, which will convert a 480i SD video signal to a 480p ED video signal. The TX-SR805 does provide HDMI switching between three inputs and one output in up to 1080p video resolution, but in does not provide any scaling capabilities between different resolutions.
DCDi is an older but a still viable deinterlacing/progressive scan technology. Even though DCDi does not scale to an HD resolution signal, it may still provide better deinterlacing than the embedded processing in other components. So, if one views at 720p or 1080p, test DCDi first before dismissing it as a SD/ED only technology and if it outperforms the deinterlacing capabilities of those other components, use it for generating a 480p signal and let the other system processor(s) scale to HD resolutions.
The TX-SR805 is capable of transcoding between various analog video inputs to digital output as well as between input and output of various analog signals, depending on what the monitor output setting is. When the TX-SR805 is set for an HDMI monitor, all analog signals will be transcoded to digital by the TX-SR805 as well as passes through signals in their native formats. With this setting, the OSD display will be routed to HDMI as well. Setting the HDMI monitor to off disables HDMI output, but will allow transcoding between analog composite and s-video input to any other analog output as well as pass through; component video will only pass through. Digital video input is never converted to analog by the TX-SR805.
One beef that I have with the TX-SR805 user manual is that it uses the terms upconvertion and downconvertion when describing transcoding; this is confusing and potentially misleading. Upconversion and downconversion are more appropriately applied to scaling to different display resolutions. When the signal format is changed between, say composite video to component video or to HDMI without any change in resolution, this is a translation of the signal encoding, hence transcoding. DCDi video processing is a deinterlacer, not a scalar as the video goes into it with 480 lines of vertical resolution and it comes out with 480 lines of resolution, the only difference is DCDi puts video frames split by interlacing back together into to a single, progressive frame.
One aspect of Onkyo’s implementation of DCDi in the TX-SR805 is that it is not applied to digital input signals, only to analog signals. I discovered this when I forced my HDMI connected HD-A2 to 480i output when attempting to look at the Onkyo’s video processing prowess but my TV was insisting that it was only getting 480i signal from the TX-SR805. So even if DCDi provides the best deinterlacing in a given system, it can not be used when the signal is kept digital.
For those consumers who do want full video processing in their A/V receiver, the TX-SR875 may be a better choice where it is clear from the shared owners manual that the TX-SR875 includes full scaling capabilities to 1080p. Direct comparison of features between the two receivers reveals that the extra $600 in price is mainly applied to improved video functionality, the TX-SR875 only sports 10 wpc more than the TX-SR805 but trades Faroudja DCDi video processing for HQV Reon-VX processing and an extra HDMI input.
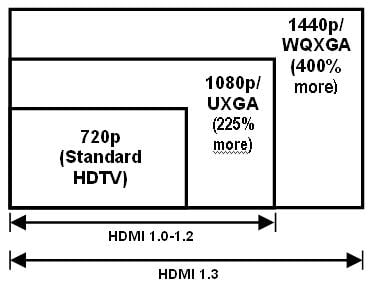
As with audio, the TX-SR805 supports many of the latest video features and enhancements available through HDMI 1.3 and above such as Deep Color. Currently, digital video is encoded with 8 bits of data for each of the primary colors, red green, and blue in an RGB color space. The combined 24 bit color representation produces over 16.8 million color variations, which commonly is known as Truecolor. Many current DVD players specify a 10 bit video processor, which can be confusing as the color, is still represented as 8 bits in video encoding, while the extra 2 bits in the 10 bit processor amounts to digital headroom. Deep Color extends the color depth to true 10, 12, or 16 bits of data for a total of 30, 36, and 48 bit color representation. As this total color depth gets beyond the human eye’s ability to resolve distinct colors, the main advantage is that it will reduce posterization, which is the visible banding in an area of continuously varying color when not enough different colors are available for accurate representation.
Buying hardware that supports Deep Color is future proofing and the TX-SR805 supports up to 12 bit per color (36 bit RGB) Deep Color. When researching products, take care to look for specific features and functionality, because HDMI profiles are flexible not every product that states version HDMI 1.3 or greater is or has to be Deep Color capable. Any piece of equipment in the A/V chain that does not support the higher bit depth will limit the system to 8 bit performance, so choose wisely. The TX-SR805 may not provide another redundant scalar to 1080p resolution, but it will not choke it off the signal quality as it passes it along.
System Setup
Setup of the TX-SR805 is fairly standard; anyone with previous receiver setup experience will find the Onkyo to be similar to most other products currently on the market. As with any receiver that does not come as a combo unit with the DVD player and in the same box as the speakers, a little planning is well advised. For novice use, one should take inventory of all system components and their required connections to plan a wiring layout; this will not only simplify first time setup, it will help keep the connection layout straight for the electronics setup of the receiver. Performing this step will also help slow the inevitable wire snarl that grows with each and every upgrade, a simple fact of life that is only alleviated by compromise in audio quality with those one box solutions.
User Manual
The user manual provided with the receiver is laid out in a logical order introducing the TX-SR805 and following the steps for setup from start to finish, advancing from basic operation to advanced features. Throughout, the user’s manual is well cross referenced and it provides many diagrams and illustrations at each step, even showing which button to press and with which finger.
After the amusing but perfunctory legal stuff, like do not use this receiver under water or stick your finger in the power outlet, and a description of the features, the manual then moves through all the bases. The chapters progress from layout of the front and back panels, layout of the remote, connections for various speakers and components, steps for first time setup, common functions including playing various sources and recording, the OSD menu structure, setup for advanced features, using zones 2/3, and controlling other components using the TX-SR805.
The manual closes with the typical but equally amusing trouble shooting section that tries to alleviate the need for panicky calls to customer support when the new receiver is not working only to have the techs find that the power cord was not plugged in. Some owners will benefit form this kind of help, others will not.
Rear
Panel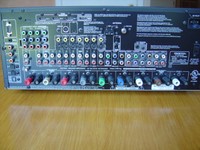
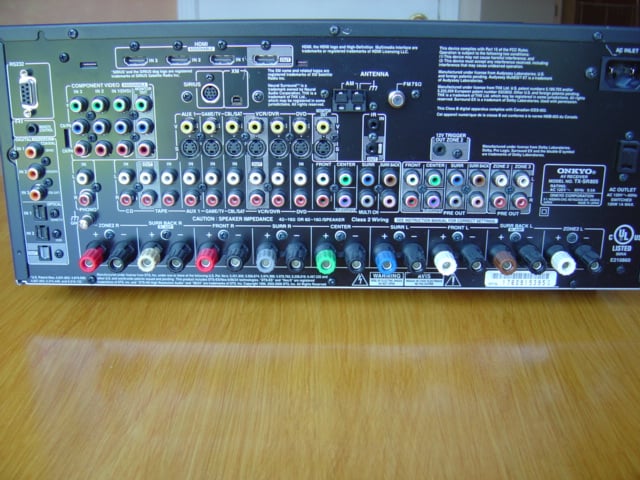
The rear panel is relatively well laid out with connections grouped together by purpose. Digital connections are located around the periphery with HDMI at the top and digital audio to the left side of the panel. Component video in/out grouped in a separate bank, standard analog audio/video connections arrayed down the middle from left to right, followed by analog multi-channel in, out, and zone 2/3 out. The digital and analog radio connections are centered above the A/V connections. The binding posts for speaker termination are aligned across the bottom. The detachable power cord and a single switched outlet are at the opposite side from the digital audio connections. Each grouping of connectors is labeled and enclosed in a white box and outputs are differentiated from inputs by white hatching inside the boxes for easier viewing when one has to crane ones head around to the back of the unit after initial installation to make any subsequent wiring revisions.
The only hitch that occurred during physical setup was that the TX-SR805, unlike my reference Rotel, only had a single RCA subwoofer out connection. A slight annoyance, the remedy was to use a monaural RCA splitter. Output for dual subwoofers really should be a minimum on all receivers, and certainly on a receiver mindful enough of room acoustics that it incorporates active room correction like Audyssey.
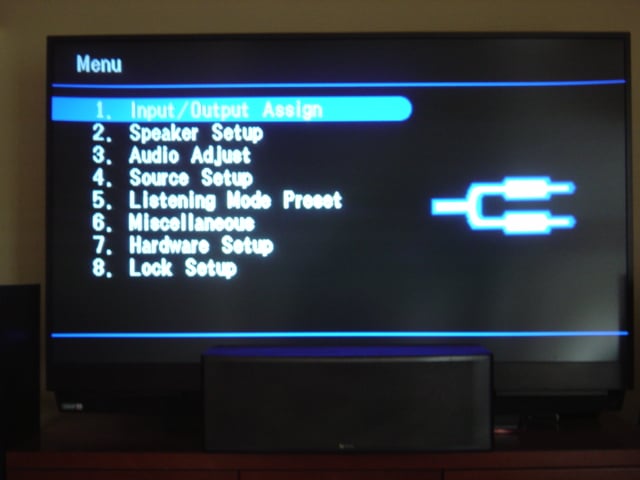
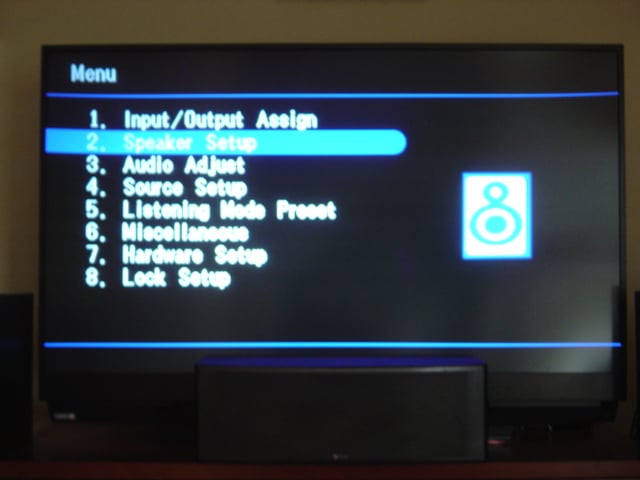
Setup and Menus
Once the physical setup is complete, setup for the electronics is the next step. The users manual includes a section titled ‘Up and Running in a Few Easy Steps’ which suggests the automatic speaker setup and the onscreen display (OSD) running as the place to start for quickest path to usable operation.
 To get the OSD running, the first step is to consider the video
connection used for the main monitor: HDMI, component, S-video, or composite
video, and set the output mode using the switch labeled HDMI OUT under the
front flap. Repeatedly pressing this
button will cycle through these alternates while the TX-SR805’s front LED
display shows the current setting if the default does not match the current
monitor connection. While it is possible
to run through the setup using only the front display, getting the OSD going is
really the best place to begin.
To get the OSD running, the first step is to consider the video
connection used for the main monitor: HDMI, component, S-video, or composite
video, and set the output mode using the switch labeled HDMI OUT under the
front flap. Repeatedly pressing this
button will cycle through these alternates while the TX-SR805’s front LED
display shows the current setting if the default does not match the current
monitor connection. While it is possible
to run through the setup using only the front display, getting the OSD going is
really the best place to begin.
Next up is speaker setup, which runs as part of the Audyssey EQ calibration. This feature activates automatically when the included microphone is inserted into the jack under the front flap. Follow the instructions, locate the microphone at ear height in the primary seating location and the TX-SR805 will cycle through a series of chirps for each speaker in turn, clockwise around the connected array. The first pass serves as the setup point for all the levels, delays, and crossover points as well as the first point for the Audyssey room acoustics correction. When complete, the user will be prompted either to run another test or to proceed to the calculations. The Audyssey correction feature will accept up to eight test points in a room, at which point, the receiver will automatically begin calculations for the speaker setup and the correction filter.
 If, for any larger home theaters, eight listening positions are not
enough, a little planning of measurement points is the best advice to maximize
benefits. Try to use no more than 5-6
points to define the perimeter and the remainder for interior points
considering where best to place these points in the room relative to the
particular seating arrangement.
If, for any larger home theaters, eight listening positions are not
enough, a little planning of measurement points is the best advice to maximize
benefits. Try to use no more than 5-6
points to define the perimeter and the remainder for interior points
considering where best to place these points in the room relative to the
particular seating arrangement.
Initially, I chose to setup the receiver manually using settings I was familiar with from my reference receiver. The intent was to avoid engaging the Audyssey EQ, which also runs the setup routine, so that I could become familiar with the sound of the receiver itself, before evaluating the quality of the onboard acoustics correction.
The setup menus, which are laid out logically and orderly in the user manual, are cross referenced with the various submenus and commands. I found it easy to go through the entire setup manually. The only setup hitch I found was with the crossover settings where I was unable to decrease the subwoofer low pass filter below the THX recommended 80Hz even though I could set all of the other high pass filters below this value.
Odd, so I checked the user’s manual to find that the LFE low pass filter only supports four settings: 80, 90, 100, and 120 Hz.
The high frequency channels support high pass settings of 40, 50, 60, 70, 80, 90, 100, 120, 150, and 200Hz. Why Onkyo would not provide the same low pass and high pass filter settings is beyond me but they did.
As a note on LFE setup, I will take issue with certain wording used in Onkyo’s manuals, as well as other manufacturers, to describe how to set main speakers appropriately for use with the LFE channel. The manual uses the term ‘full band’ for speakers with a ‘good sized’ woofer that can play bass ‘adequately’ without defining what ‘full band’ is by frequency response. ‘Full band’ is also the terminology in the crossover setting menu that implies the high pass filter is turned off. In the past, the manual for the TX-SR-602 that I owned used the terms ‘large’ or ‘small’ to control the high pass filter and suggested dependence on woofer size, 6 ½” as suggested transition, again without consideration of frequency response of bass driver.
This is confusing to newcomers: main speakers should only be put on settings such as ‘full band’ or ‘large’ if they can go at least as deep as the system subwoofer, and preferably only with true full band speakers able to go down to 20 Hz and are capable of sustaining the high SPL levels required of an LFE channel. Even then, overall system dynamic range will generally benefit from shifting the LFE burden from the main receiver/power amplifiers to the dedicated amplifiers in the subwoofer.
 Regardless of the choice to use automatic setup or manual, owners of any
system with an automatic setup routine are advised to go into the setup menus
and manually verify the speaker settings.
While automatic setup algorithms have been steadily improving, they are
notoriously error prone. Go in, look at
the settings, and make sure they make sense, because even good programs make
some interesting selections. Case in
point with the review receiver, the crossover frequencies were set differently
between the surround and surround back channels even though the speakers are
identical and there were some wide disparities between level and distance
settings for individual speakers. The
complexities of bass frequencies and room interaction often make this difficult
for automatic setup routines to get correct and the Onkyo users manual points
out that THX recommends setting subwoofer levels and distances manually for
this very reason.
Regardless of the choice to use automatic setup or manual, owners of any
system with an automatic setup routine are advised to go into the setup menus
and manually verify the speaker settings.
While automatic setup algorithms have been steadily improving, they are
notoriously error prone. Go in, look at
the settings, and make sure they make sense, because even good programs make
some interesting selections. Case in
point with the review receiver, the crossover frequencies were set differently
between the surround and surround back channels even though the speakers are
identical and there were some wide disparities between level and distance
settings for individual speakers. The
complexities of bass frequencies and room interaction often make this difficult
for automatic setup routines to get correct and the Onkyo users manual points
out that THX recommends setting subwoofer levels and distances manually for
this very reason.
One other piece of advice while manually checking settings is to make sure that the receiver is set for 8 ohm speaker impedance. The provision of this setting on a receiver is to make Underwriter’s Laboratories happy under certain specific test conditions, but it is nothing more than a choke on output power, irrespective of the actual speaker impedance. As always, make sure the receiver is well ventilated, and if necessary, use active cooling such as a small fan to vent at the heat sinks. I did find that this particular receiver runs hot, so some sort of acoustically controlled active cooling is recommended, especially if the unit is to be installed in a confined space or enclosed cabinet.
Throughout my time with the TX-SR805, the only operational glitch I encountered was related to HDMI. When entering setup, on the fly, during playback from an HDMI source the receiver would sometimes be unable to reestablish signal lock and resume playing. Correcting this required turning the TX-SR805 off and then on again.
With the amount of crippling DRM built into HDMI that will cutoff playback if the copy protection system is unhappy for any reason, including DRM software/firmware glitches, and the high probability of imperfectly written code, the relock issue is much more likely an inherent HDMI problem than it is an Onkyo quality problem.
Onkyo TX-SR805 Listening Tests
I evaluated the Onkyo using multi-channel and two channel source material. I used the Toshiba HD-A2 over an HDMI connection for HD-DVD, DVD, and CD audio decoding and a HTPC with an Audigy 4 soundcard over an analog multi-channel connection for DVD-A decoding. The Onkyo was used to drive a 7.2 setup consisting of Infinity Beta series loudspeakers for the high frequency array and a pair of JL Audio Fathom subs at the bottom. For both film and dedicated music source material, the TX-SR805 was set at an 80 Hz crossover point. Source material was reproduced in its native format, either multi-channel or stereo, with the Onkyo set in two channel mode for reproduction of stereo material and engaging the Beta 40 towers for the upper frequencies.
Overall, the receiver was musically satisfying, with a character similar to the TX-SR602, but with audibly more heft and solidity to the sonic signature, likely due to the more substantial power supply under the TX-SR805’s hood. The result of the heavier power supply gave added three dimensional depth, beyond what the 602 was capable of, breathing a little more life into the dynamic range of the reproduction. I found the TX-SR805’s sound to be natural, relative to the price point; it was smooth with minimal electronic etching and a good level of detail and control.
In comparison to the reference Rotel, the differences tended towards effects at the audible frequency extremes. The Onkyo did not sound quite as detailed or have as much spatial depth, and upper treble output was not as open or airy. Generally, words such as openness and air are qualitative audiophile speak for accurate reproduction into the ultrasonic range that, while inaudible, interacts with audible frequencies, indirectly adding to the naturalness of the playback. The TX-SR805 also did not sling surround effects about the room quite as quickly as I am used to. When considering such comparison, realize that the price difference is a factor of two between these pieces of hardware; such a price disparity indicates that they should not be considered direct competitors. Sonically, the TX-SR805 will compare favorably with or better than other price competitive receivers.
After some time with the receiver au natural, it was time to try out the Audyssey room acoustics correction included with the TX-SR805. Running the setup routine is as easy as plugging in the included test microphone and following some simple steps that mostly involve pressing the enter button on the remote and shutting up until the procedure is finished. Once complete, just about any system should sound better. How much improvement, of course, depends upon the state of the acoustic environment in the room before Audyssey is engaged. Poor acoustical environments will experience improvement that is more drastic and even relatively good environments will still have improvement, as no room is perfect.
With Audyssey engaged, I found some noticeable but not drastic improvements, mainly in terms of sound field solidity. This will be true for any room where some pains have be taken with the physical environment to minimize negative acoustical effects. I found a subtle, but noticeable increase in the coherency of the sound field in general, improved localization and envelopment, as well as improved low level detail. Discrete effects were more focused across the front stage, sound pans tracked more solidly across the field, and diffuse environmental effects more enveloping. The improvements also affected subtle sound effects and quiet sections of music scores, which were more distinct and spatially separated, not jumbled with other sounds when Audyssey was engaged. Improvements to the fullness and solidity of the perceived audio are attributable to controlling comb filtering from room boundary reflections.
One of the more noticeable improvements was that dialog simply sounded more realistic. As a combination of many detracting factors, realistic dialog is always tricky to get right; all too often, actors sound like they are talking out of a box. This can not be corrected in every circumstance, but Audyssey MultEQ XT goes a long way to putting on the finishing touches to get most dialog closer to that most elusive goal of sounding completely natural.
With DTHD and DTS MA capable receivers just coming to market, the configurations of currently available players assume no external decoding capability, so because of this I was unable to test DTHD directly. However, LPCM is inherently lossless meaning that all of these encoding schemes are theoretically identical; the only potential source of difference in the recreated waveform is the possibility of compounding discretization error due to the multiple decoding/encoding steps. Eliminating the additional conversion may prove negligible to the perceptible audio quality, but the potential to introduce unwanted error is always best avoided if possible. The main advantage of the lossless audio codecs like DTHD and DTS MA, now available with HD optical discs, is that they are identical to the studio masters but take up substantially less space than uncompressed LPCM.
Simply put, using lossless audio such as DTHD provides an audibly fuller sound than its lossy Dolby Digital predecessor does, and yet the sound quality is simultaneously more detailed and transparent, making it that much closer to natural sound. The sonic quality also no longer suffers from many of the artifacts that produce flat, lifeless sound reproduction. As a video analogy, many reviewers have cited an increase in the three dimensional illusion in HD video due to better separation of individual images because of improved edge definition; the same is true of the benefits to higher resolution audio.
Generally, I found that Audyssey produced improvements that were most obvious with HD audio sources than with typical DVD audio sources. The explanation likely resides in the fact that this is more detail to be affected by a less than optimal acoustic environment, so that when correct, a greater quantity of detail returned. As I discuss what the TX-SR805 was sonically capable of in the subsequent sections, I will focus on these sorts of improvements when combining a good receiver with HD audio and Audyssey capability.
 Batman Begins (HD-DVD, DD DTHD)

The well recorded soundtrack for ‘Batman Begins’ is provided in Dolby TrueHD encoding for the HD-DVD release, allowing the opportunity to hear it reproduced using a lossless codec. While it seems to be true that current players default to reencoding DTHD into uncompressed LPCM, it is still a lossless format and hopefully enthusiasts who support early adoption will be treated to firmware upgrades as more receivers and pre/pros come to market able to perform direct DD+, DTHD, and DTS MA decoding without the translation to LPCM.
Best put, the sound field generated by the Onkyo with DTHD and Audyssey simply sounded more spread out. The improved transparency that I spoke of above can be described as increasing the openness and sense of space, making a hitherto unnoticed congestion obvious by its absence. Fullness, depth, detail, coherency, envelopment are all words that come to mind to describe the improvement.
With the Onkyo’s full capabilities engaged, orchestral swells used throughout the film were spacious, fuller, and lighter. In many instances, the timbre of accompanying percussion became more natural, detailed, and much better separated when reproduced with the TX-SR805 at its best. Dialog benefited greatly with Liam Neeson, Michael Caine, and Ken Watanabe delivered with noticeably improved presence and solidity. The size of the acoustic space of the orchestra hall during ‘Mefistofele’ increased to new levels of realism and the cracking of the ice expanse during Bruce Wayne’s training extended into the distance. The Onkyo also did a fine job of increasing the sonic space of the bat cave, echoes were enveloping, the waterfall sounded more realistic, and the churning violins were well separated and given their own space off to the side. The Onkyo gave new life to sound effects and pulsing percussion during fight and flight from Arkham while the bat mobile was provided with a remarkable level of presence. Sound effect movements of the collapse and crash of the monorail and as Batman made his flyby after escaping were rendered as very coherent. Closing out the film, the TX-SR805 rendered a detailed and clean reproduction of the score; notes from individual instruments had more sonic shape, separation, spaciousness, fullness, and transients were crisp.
Serenity (HD-DVD, DD+)

I again turned ‘Serenity’; an underrated movie that features a well recorded musical score and sound effects that benefit from the improved audio codecs available on HD optical discs. The soundtrack captures many taut acoustic transients, in both the score and effects, which can become very three dimensional when reproduced on quality audio equipment. The score combines orchestral acoustic instrumentation and percussion with electronic elements providing layers and depth. The recorded sound effects are capable of developing a cohesive sound field with good directionality throughout the action such as during ship flybys and battles when handled correctly with good quality audio gear.
The improvements to clarity and acoustic space were again evident in the TX-SR805’s audio presentation. While not lossless, the improved bit rate of Dolby Digital + (DD+) eliminates of many of the shortcomings of DD that commonly lead to the belief that DTS sounded better. The TX-SR805’s sonic capabilities were able to showcase the improvements quite nicely, revealing lost sounds, added richness, and coherency. Of particular note, sounds with higher transient demands seemed to stand out from the sound track with noticeably improved separation. With the TX-SR805, sound effects were less clumped making individual sounds more distinguishable. Transient musical sounds, such as percussion and acoustic guitar, were also crisper and better separated from the other instrumentation. These types of transient sounds perhaps benefited the most from Audyssey, as they are more sensitive to phase errors where the sharp attack can be smeared and blunted.
The orchestral score throughout the film and closing credits definitely sounded more natural and spacious; the TX-SR805 could pull out additional depth from the score, spread it out, and separate inner detail. Inner synthesizer parts folded in with the acoustic instruments were pulled out from within and given better separation and improved character. Various passages with featured percussion gained additional three dimensional depth. Engine noises and hull groans during atmospheric reentry in the first scene following the title were more detailed and better localized. As the planet-side town comes under attack by reavers, a bell tolls in the distance, an impressive and realistic distance. Port and city sounds on Beaumont were more enveloping through the Onkyo, revealing details coherently, as were the sound effects and the synthesizer score through camera pans through the ion storms as Mr. Universe is introduced. I found subtle, dissonant background violin parts revealed in the quiet as Serenity passed through reaver space. As the film reaches its climax, battles in space and on the ground took on new presence, the TX-SR805 provided great improvements in solidity, localization, and detail, all adding to the overall sonic space. As the final scene opens, the TX-SR805 brought rain.
Battlestar Galactica: Miniseries (DVD, DD)

Well written science fiction is always really about people and about change, a thought experiment into what happens to people in the face of change. Technology is one vehicle to introduce change, but in the more literate works of the genera, it does not dominate or supplant the story as it all too often does in common popular culture interpretations. The reimagined Galactica takes the very dark premise of the original story and examines it in a way that the original did not attempt: the fall of human civilization and the flight of the remnants from destruction at the hands of their own creation. On a fundamental level, the story is a variation of themes from Mary Shelley’s ‘Frankenstein’ where hubris and improper handling of creation leads to disastrous consequences. This well written show features an equally well written and engaging musical score, drawing from nonwestern musical sources, which compliments the dark atmosphere. I will definitely be looking forward to the upcoming HD-DVD release.
Once again, all the audio spatial cues were expanded with the TX-SR805 fully engaged. The sonic envelopment was top notch for a receiver, with sound effects that attempted to depict large spaces allowed freedom through the Onkyo. I found that the receiver provided clean musical detail, allowed nuances and subtle shades of instrumental timbres to sound unfettered, and dialog to become solid and natural.
The opening title music is simply percussion; and through the TX-SR805, the timbral character of that percussion became well pronounced and more palpable. The ambience of the open space in the landing bays was unusually realistic, the ambient sound effects and voices as Apollo lands and his Viper is secured by the dock crew, the size and coherence of the open bay during the decommissioning ceremony as Apollo performs a flyby to a PA quality fanfare using the original show theme as Adama commences his speech. The envelopment of battle was also very coherent through the Onkyo as fighters fly by, overhead, swirled in weapons fire. As with isolated percussion, segments with orchestra score had well separated instruments that were detailed and rich with their own flavors. Of particular note was an occasional eastern flute, likely a surdu, which really took on a solid, audibly rich, reedy presence through the TX-SR805.
Porcupine Tree: In Absentia (DVD-A, DTS)

A recently acquired Audigy 4 sound card, capable of true DVD audio decoding, has lead to my first experiments with HTPC when I decided to take an unused PC and spruce it up a bit with a new AVIVO capable Radeon video card as well. While the advantage of DVD-A is that it can be decoded through any DTS capable DVD player, albeit rendered using only the lossy core encoding, it has been much more enjoyable to finally become familiar with the uncompressed recording.
Using “In Absentia’, I was able to have a listen to the Onkyo’s multi-channel analog capabilities which did not disappoint. Far too many midrange a/v receivers sound flat and somewhat sterile, which is particularly noticeable with dedicated music material where there are no flashing lights from a TV to distract the careful listener. The TX-SR805 presented an enveloping sense of three dimensional acoustic space with a seamless coherency to the sound field. The sonic character of the Onkyo would best be described as smooth, full, and present when playing this recording. Exposed vocals retained a natural character while the myriad of layered harmonies was rendered richly but with nuances and detail remaining unobscured. Throughout listening to this recording using the TX-SR805, I founded added dimension and shape provided to Richard Barbieri’s subtle, intricate synthesizer performances. I also noticed some nice percussion character with drums that had a richness of timbre while metals came across as very natural, not overly bright.
Acoustic guitars during ‘Trains’ were presented by the TX-SR805 with a lot of spatial depth out of the front channels. The three dimensional characteristics were enveloping; the TX-SR805 added depth but avoided pulling the instruments too far behind the listener, which can become annoying when overdone. I found the timbral quality of the guitars to be quite natural, sonically smooth, and rendered with a revealing level of separation between the multiple layers. Vocals during ‘Gravity Eyelids’ hung in space with the layering nicely revealed through the Onkyo and various synthesizer and surround effects were well localized in space and palpable. Vocals and guitar separation during ‘Prodigal’ were again quite good, vocals were natural, and TX-SR805 provided a well developed sense of three dimensional acoustic space. ‘Heart Attack in a Lay-by’ opened as cars pass by with the Onkyo creating space and enveloping the listener in the swirl of piano, electric piano, synthesizers, and guitar while the layered vocals are suspended in air, closing in a richly layered but clear vocal fugue.
Onkyo TX-SR805 Measurements
Video Testing: Audioholics/HQV Bench Testing Summary
of Test Results
Perfect Score is: 130
Onkyo TX-SR805 Benchmark Score: 63
| Test | Max Points | TX-SR805 | Pass/Fail |
| Color Bar | 10 | 5 | Pass |
| Jaggies #1 | 5 | 5 | Pass |
| Jaggies #2 | 5 | 3 | Pass |
| Flag | 10 | 10 | Pass |
| Detail | 10 | 10 | Pass |
| Noise | 10 | 5 | Pass |
| Motion adaptive Noise Reduction |
10 | 5 | Pass |
| Film Detail | 10 | 0 | Fail |
| Cadence 2:2 Video | 5 | 0 | Fail |
| Cadence 2:2:2:4 DV Cam | 5 | 0 | Fail |
| Cadence 2:3:3:2 DV Cam | 5 | 0 | Fail |
| Cadence 3:2:3:2:2 Vari-speed | 5 | 0 | Fail |
| Cadence 5:5 Animation | 5 | 0 | Fail |
| Cadence 6:4 Animation | 5 | 0 | Fail |
| Cadence 8:7 animation | 5 | 0 | Fail |
| Cadence 3:2 24fps film | 5 | 0 | Fail |
| Scrolling Horizontal | 10 | 10 | Pass |
| Scrolling Rolling | 10 | 10 | Pass |
| Total Points | 130 | 63 |
Source component was the Toshiba D-KR2 DVD Recorder (480i - component video) deinterlaced to 480p via the TX-SR805 and displayed on a Mitsubishi WD-65733 Display.
The Onkyo receiver posted an average score on these tests when compared to many current displays and source components. However, it completely misses on film detail and 3:2 cadence tests.
Audio Testing
Measurements were performed using the Sample Champion program developed by Paolo Guidorzi of Purebits. The program is a Maximum Length Sequence (MLS) program that generates an impulse response in the time domain from this pseudorandom signal. Fast Fourier Transformation is applied to the impulse response to generate the system frequency response. The operating principle is the same as that of the well known MLSSA program.
Test samples were taken using 16 bit resolution with a 48 kHz sampling frequency. Fast Fourier Transformations were performed at 64K allowing for a frequency resolution of .73 Hz, which is more refined than even 1/24th octave resolution at the lowest octave; the A0 key on the piano has a fundamental frequency of 27.5 Hz.
In room acoustic testing of the TX-SR805 was performed both with and without Audyssey MultiEQ XT engaged for comparison. Audyssey acoustic calibration was generated using eight microphone measurements located at both primary and secondary listening positions as well as throughout the listening area.
Test measurements were then performed at the primary and secondary listening positions for both the left and right main channels at an SPL of 80dB at each listening position. The primary listening position is located approximately centered on the front L/C/R channels and at the approximate center of all calibration settings for time delay. The secondary measurement position is located to the left and forward of the primary position near the room boundary.
Comparisons of the in room frequency response results without and with Audyssey engaged are presented in two forms. First, a high frequency resolution overlay plot in logarithmic scale of both conditions is provided. The second form is a side by side comparison of frequency response without and with Audyssey engaged plotted at 1/3 octave bands. The 1/3 octave band plots consider the commonly accepted limits of human hearing to differentiate relative frequency variation and thus are more representative of the changes one might actually hear.
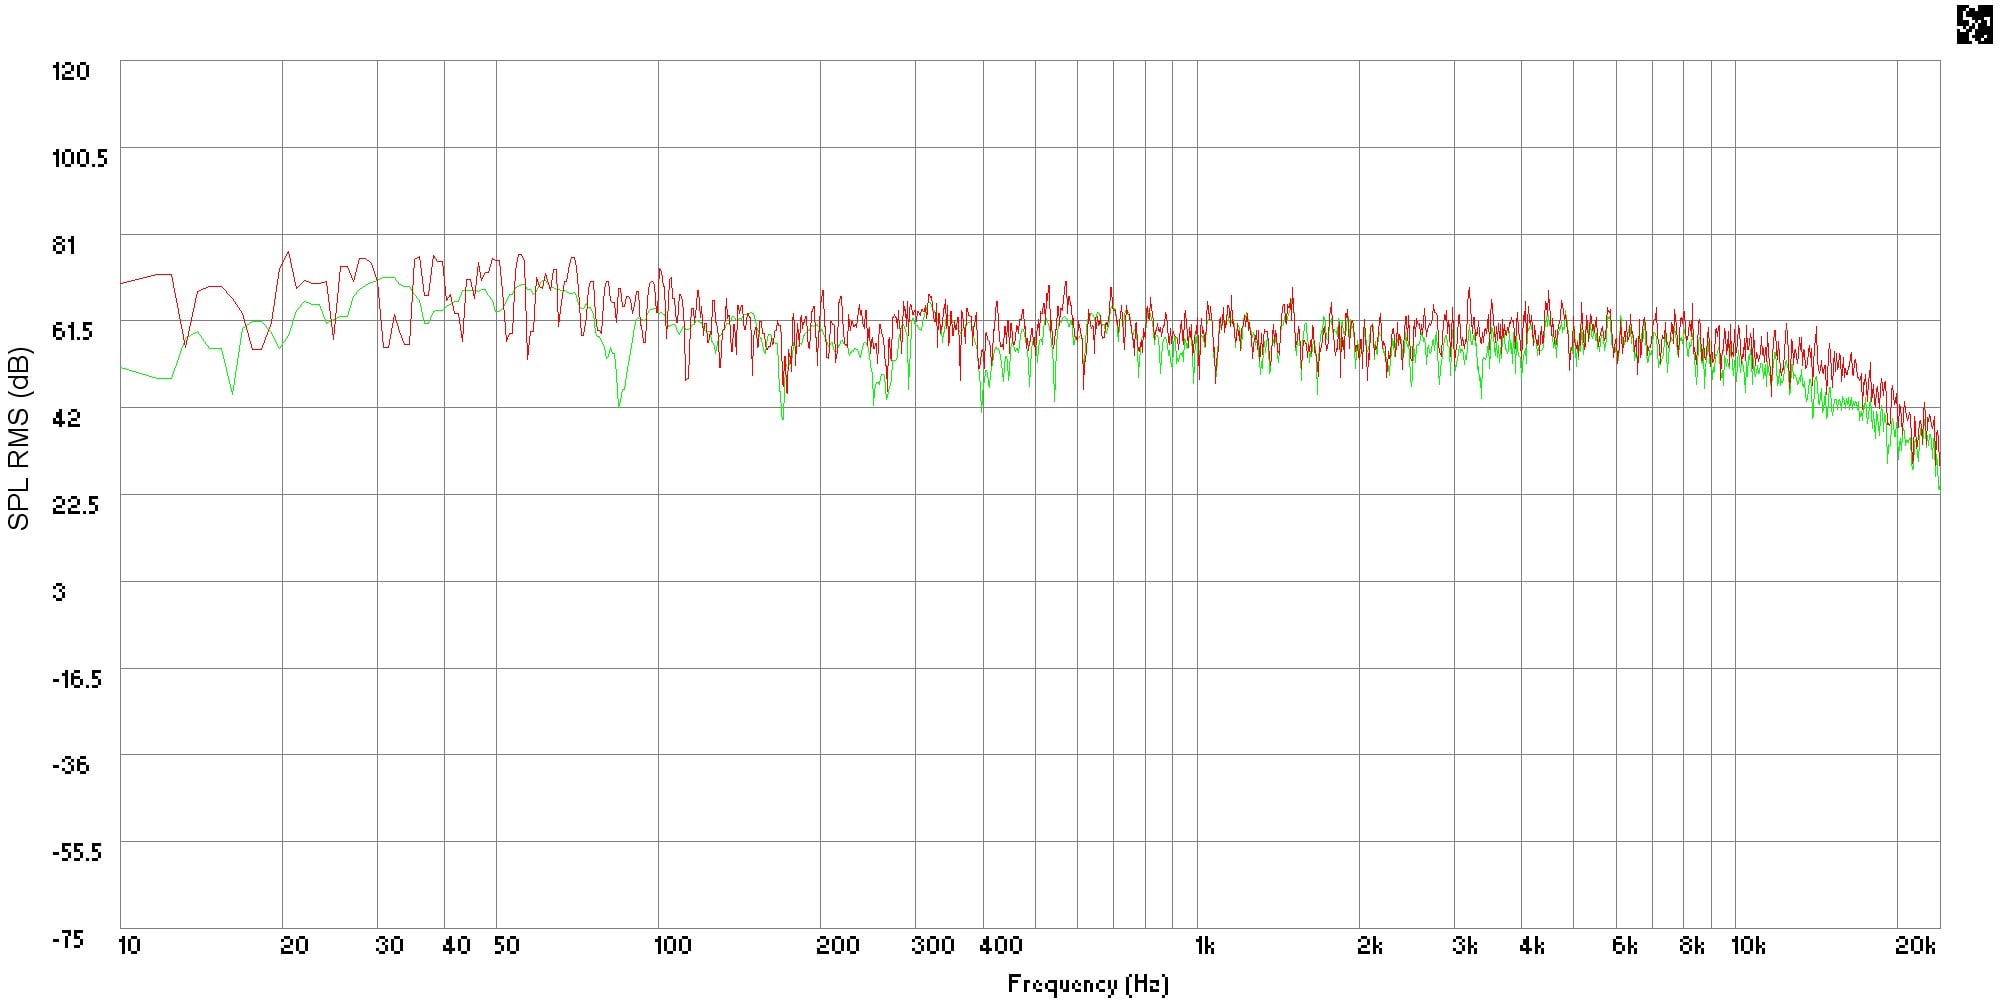
Figure 1: Overlay of front left channel at primary position with/without Audyssey
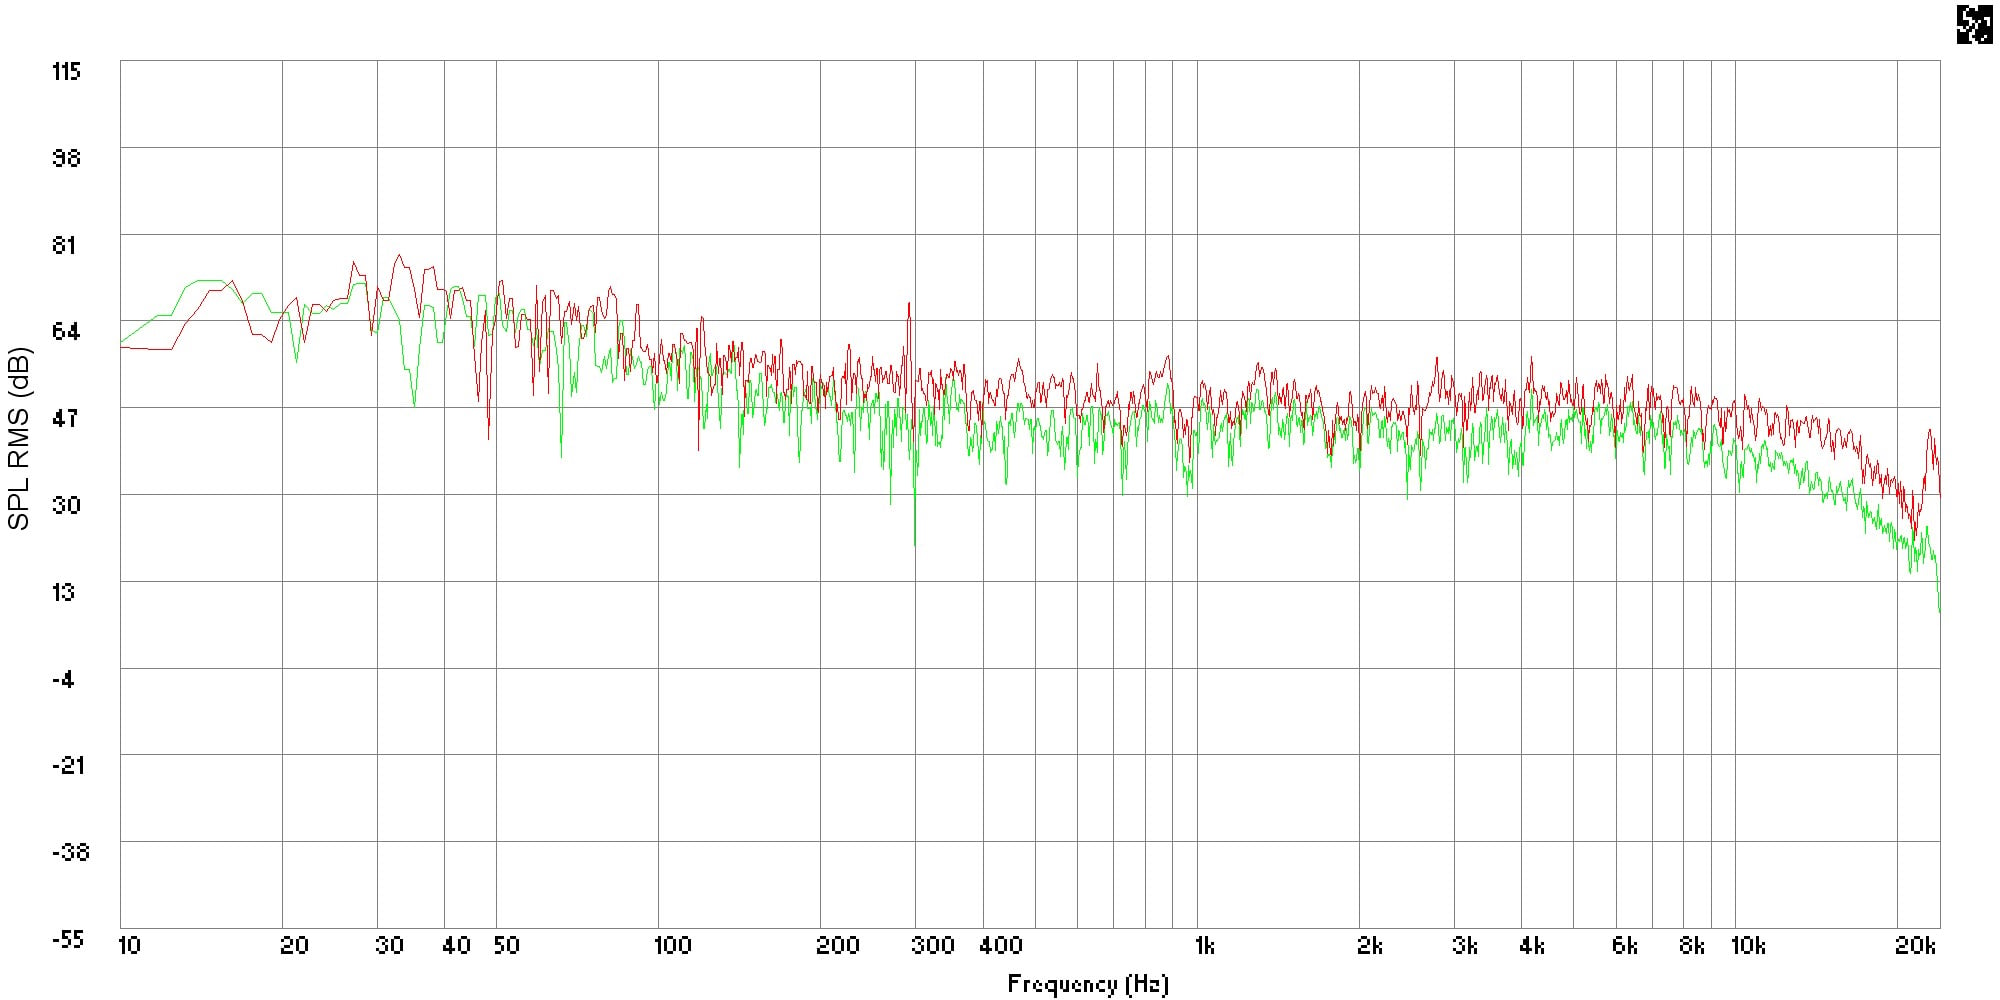
Figure 2: Overlay of front left channel at secondary position with/without Audyssey
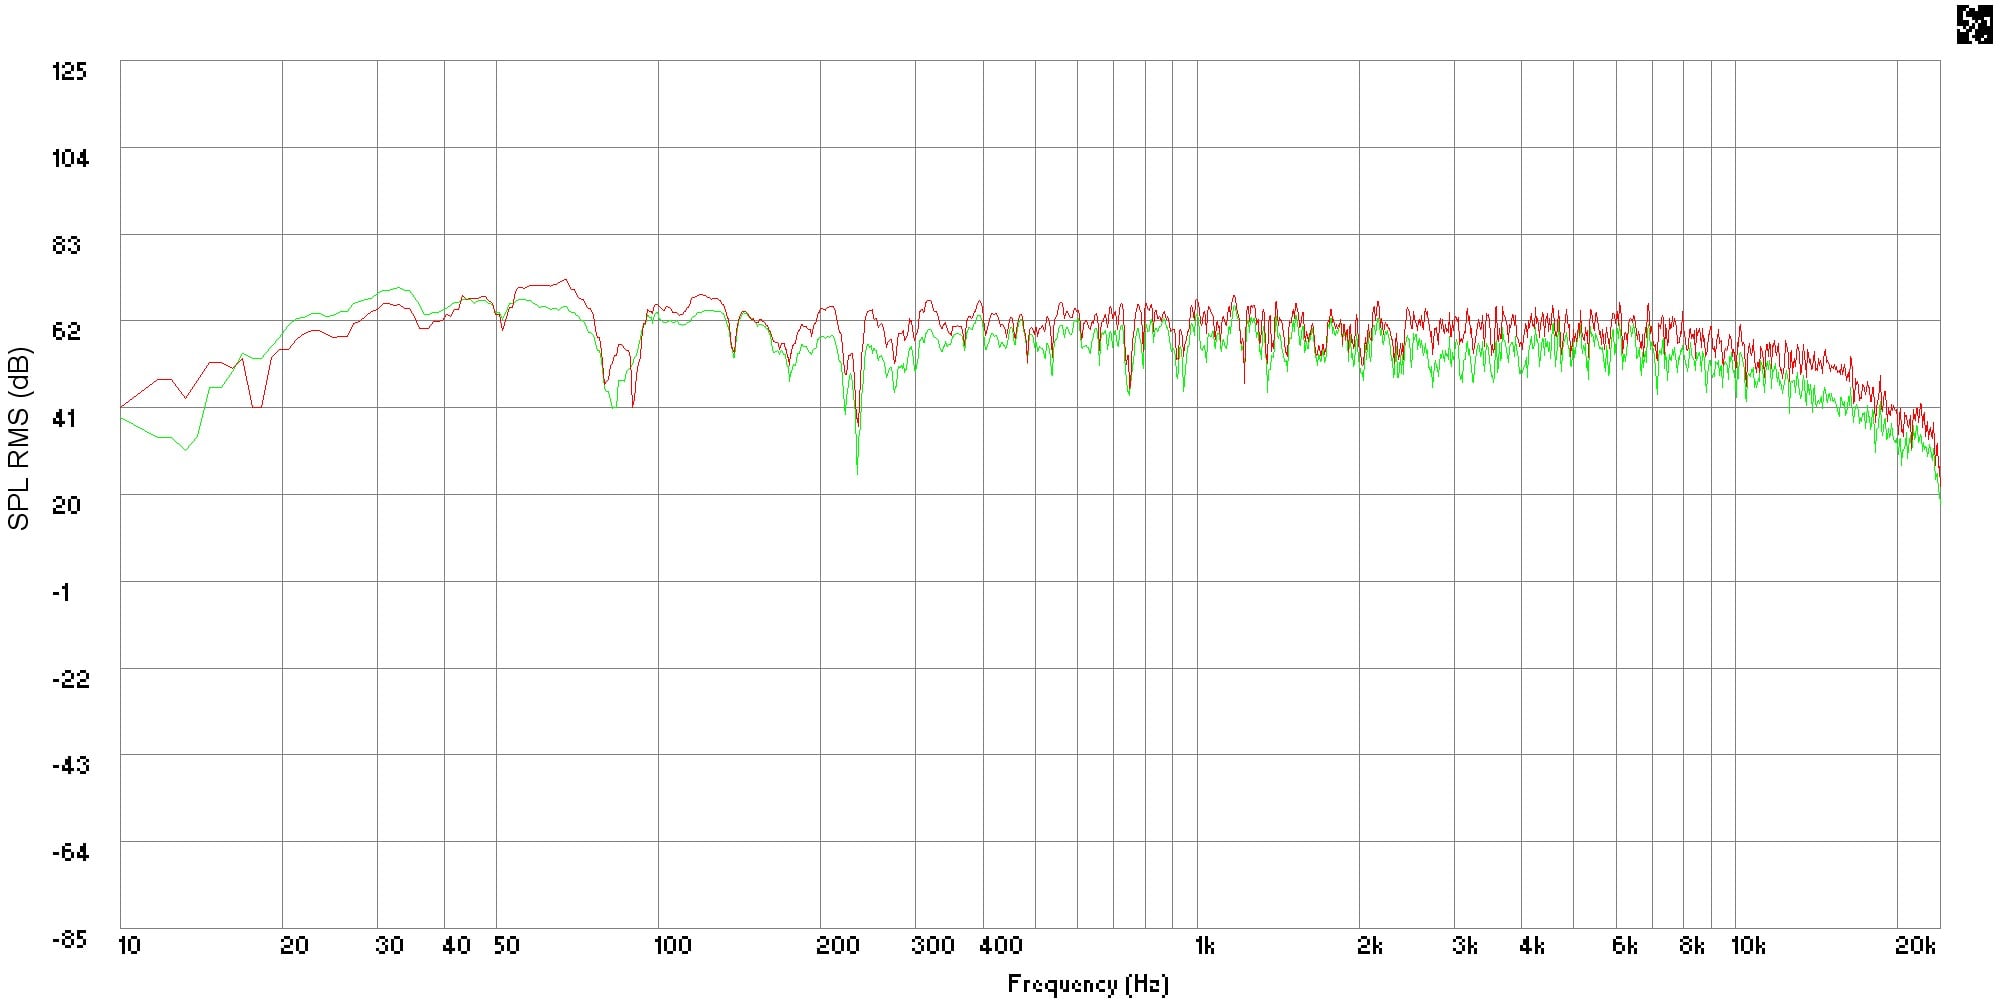
Figure 3: Overlay of front right channel at primary position with/without Audyssey
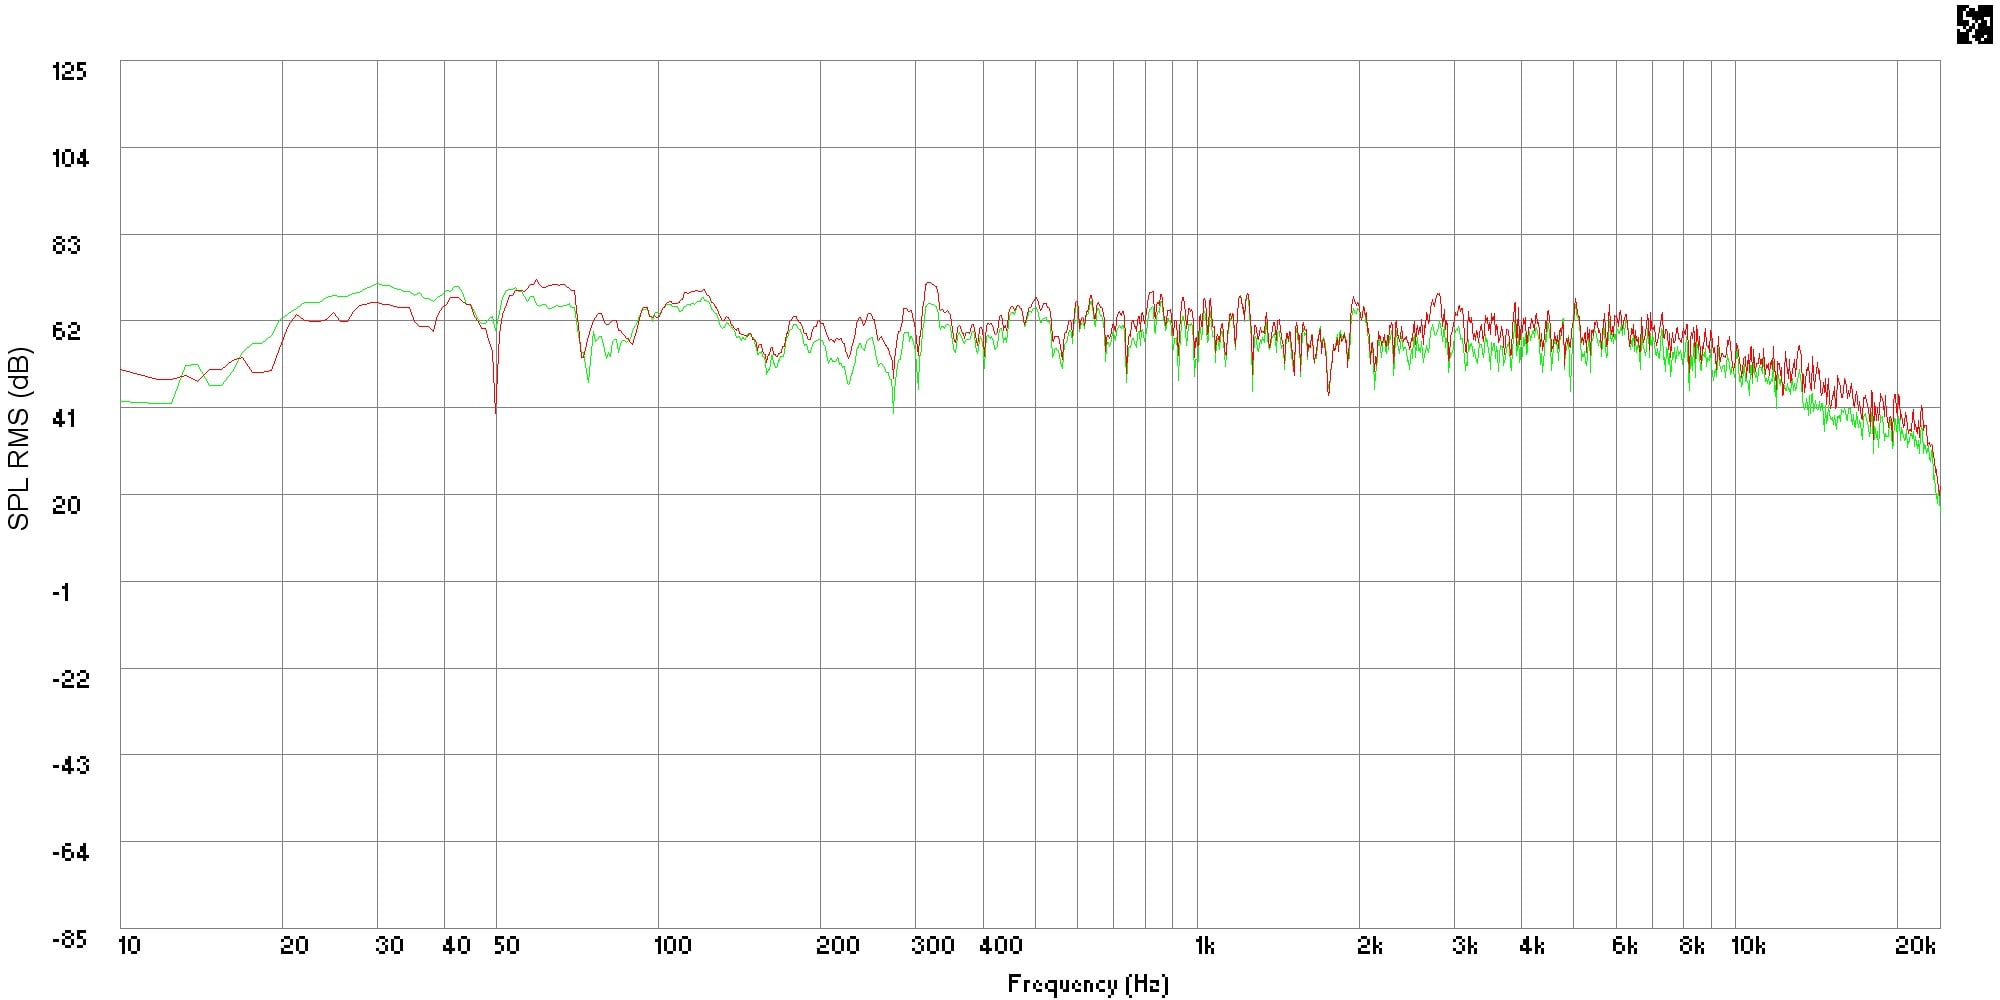
Figure 4: Overlay of front right channel at secondary position with/without Audyssey
Figures 1 through 4 show the high resolution plots for each measurement position and speaker. Typically, all the plots show correction in the high frequency range where room absorption pulled the curve below the Audyssey calibration curve. We also see a general flattening out of response through the midrange and into the bass regions. The most dramatic change is in the left channel at the secondary position, also at the left of the room, where Audyssey made attempt to adjust the curve for room boundary gain in the bass region and balance it with the midrange and treble. It is here that we also see the greatest treble roll off correction.
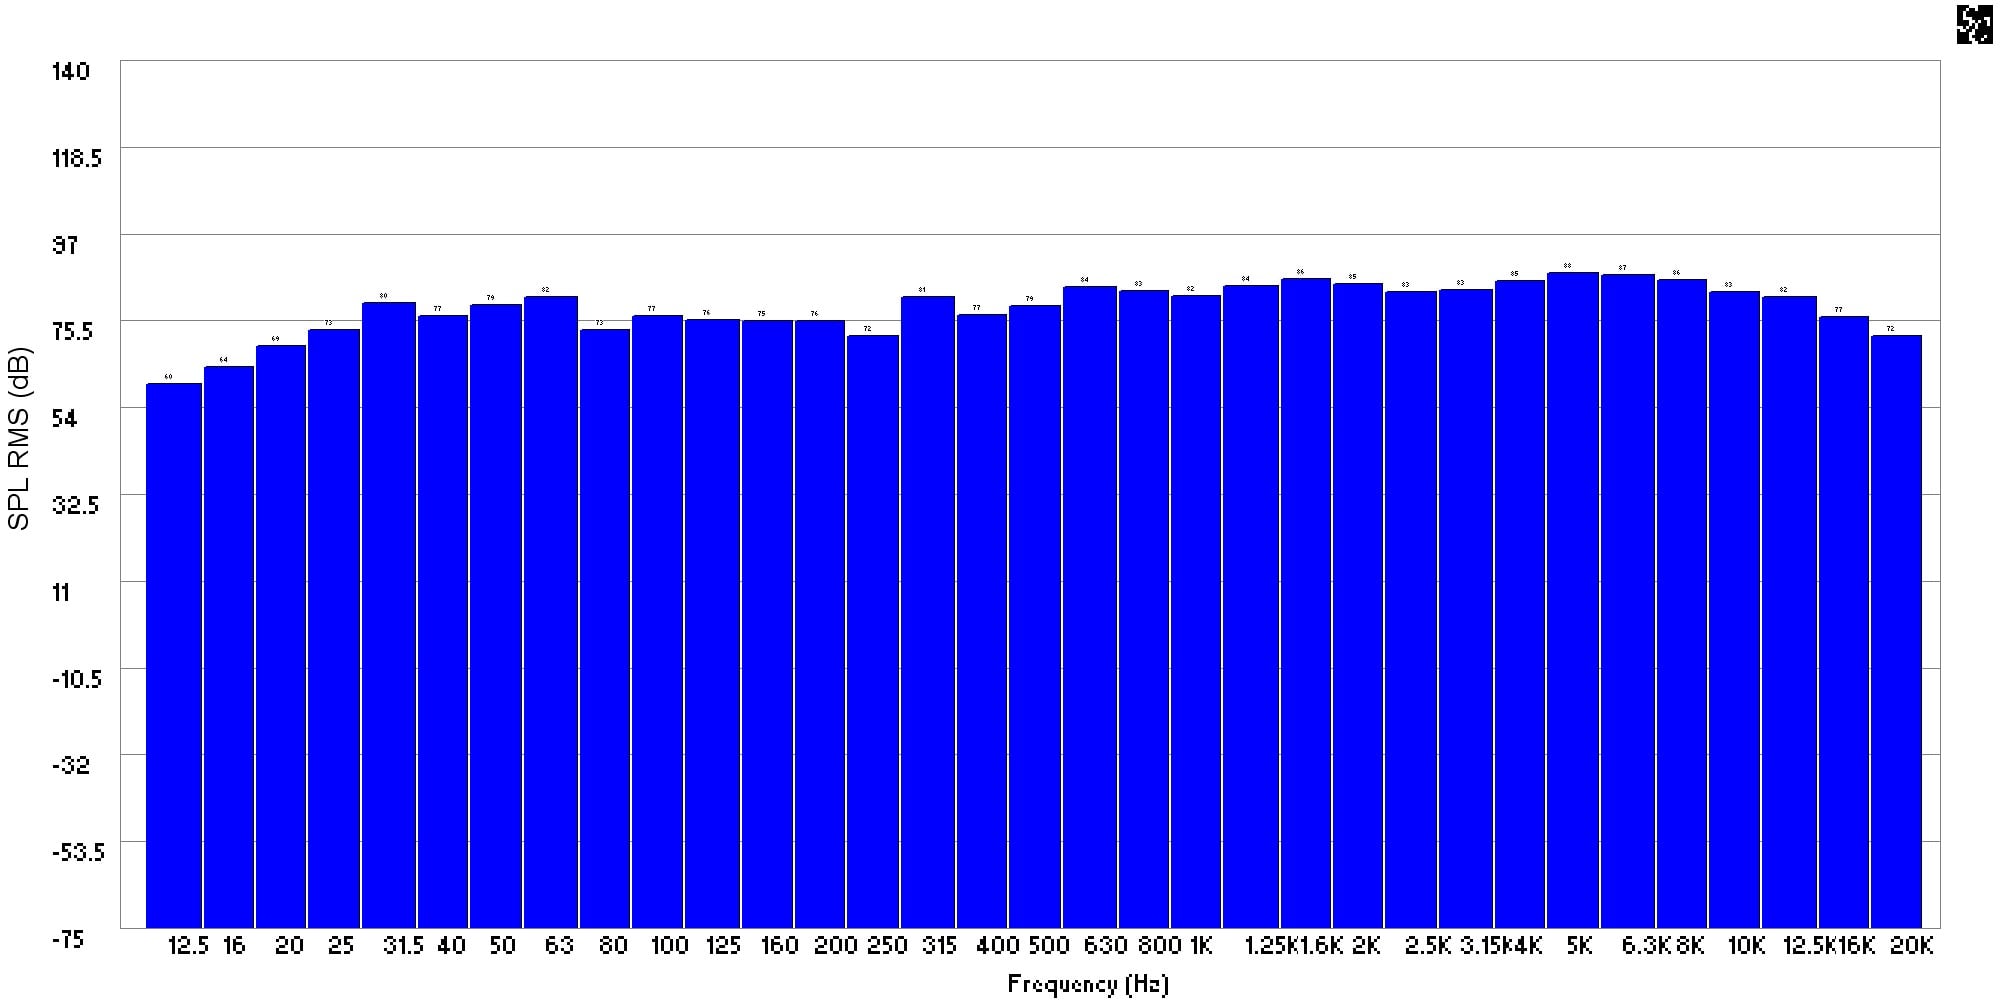
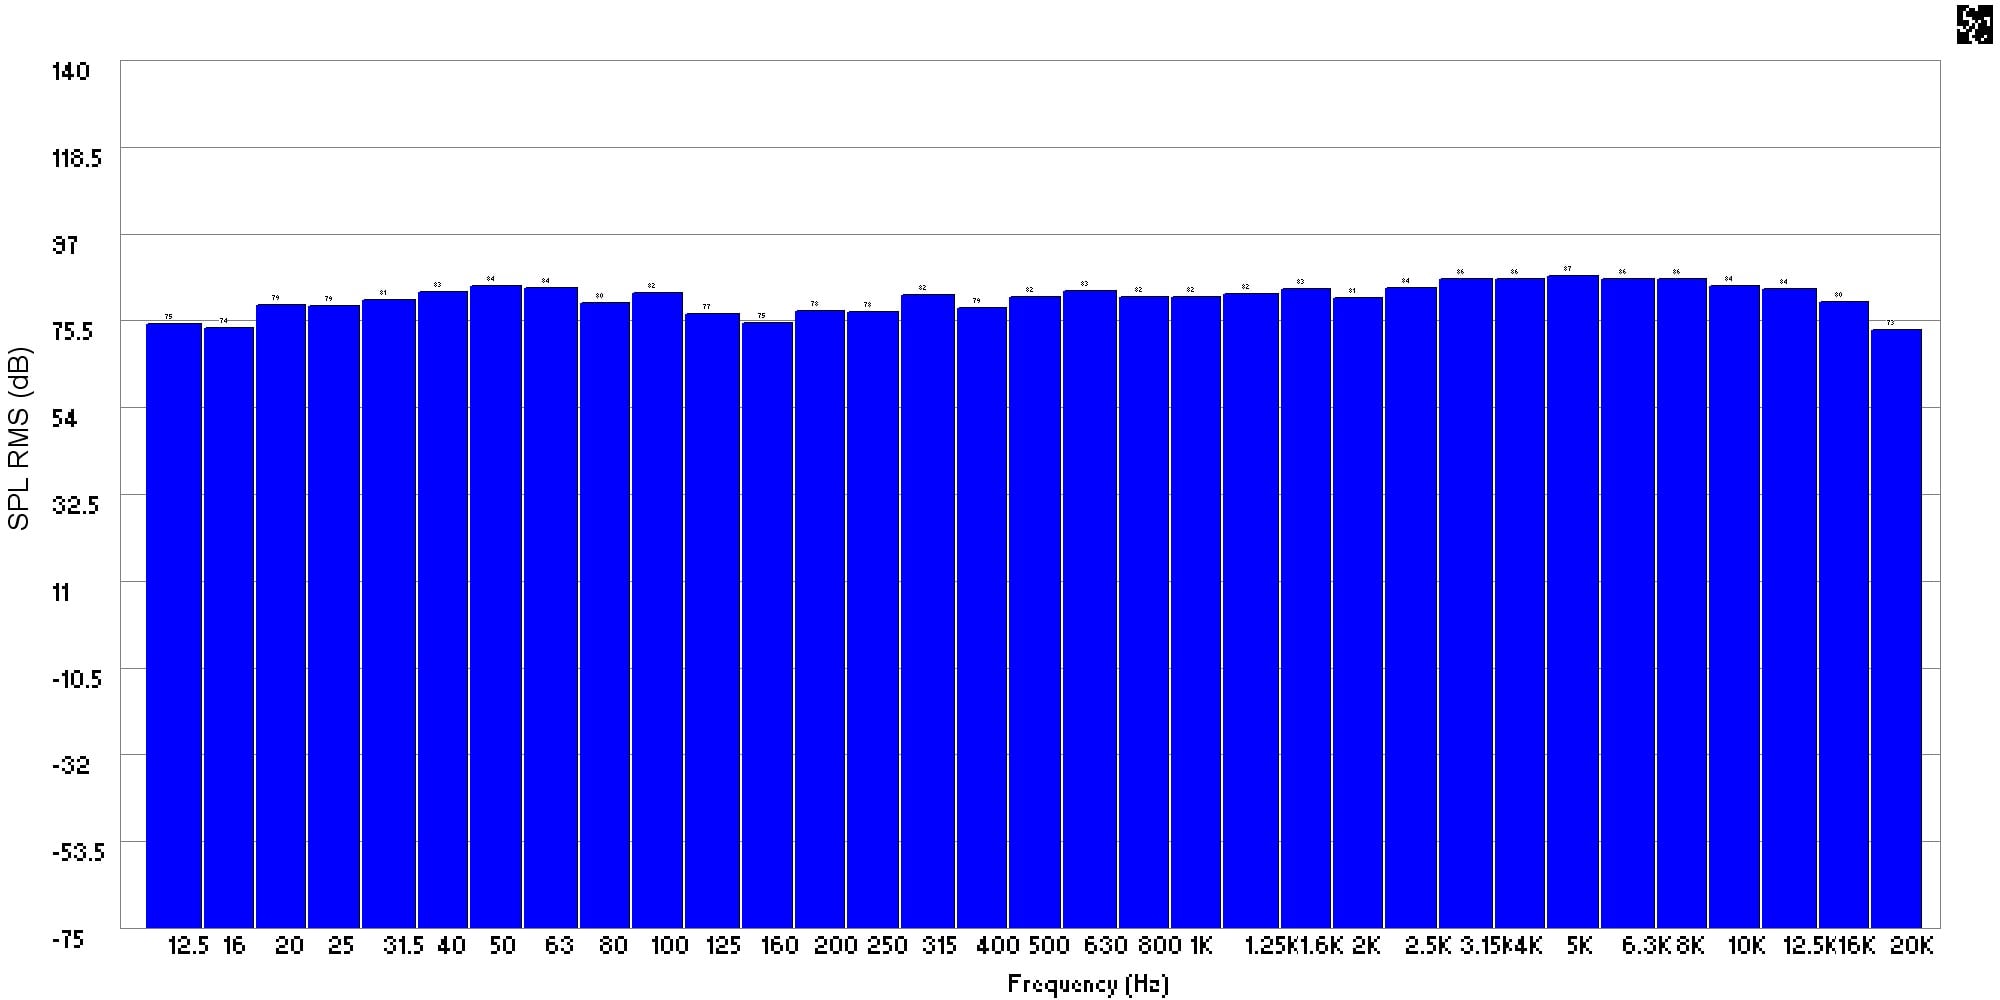
Figure 5: 1/3 Octave frequency response without and with Audyssey of the left front channel at the primary position
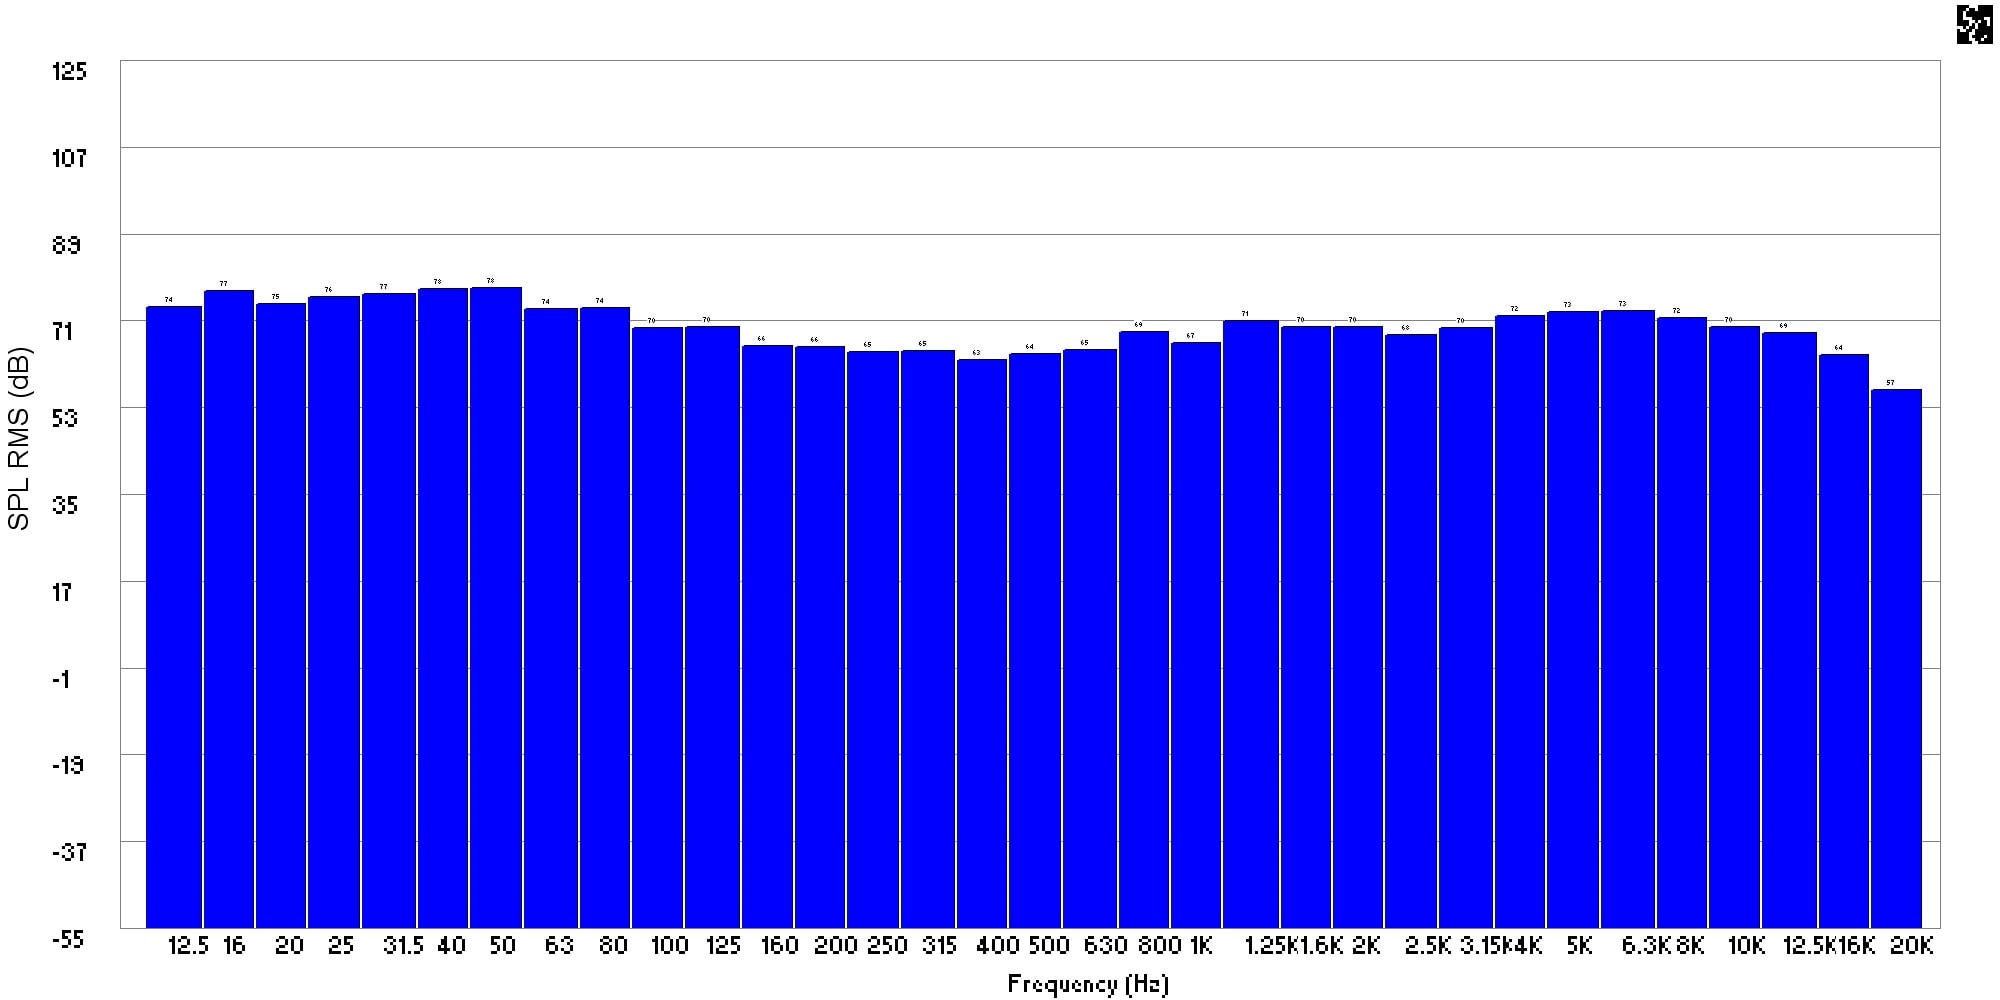
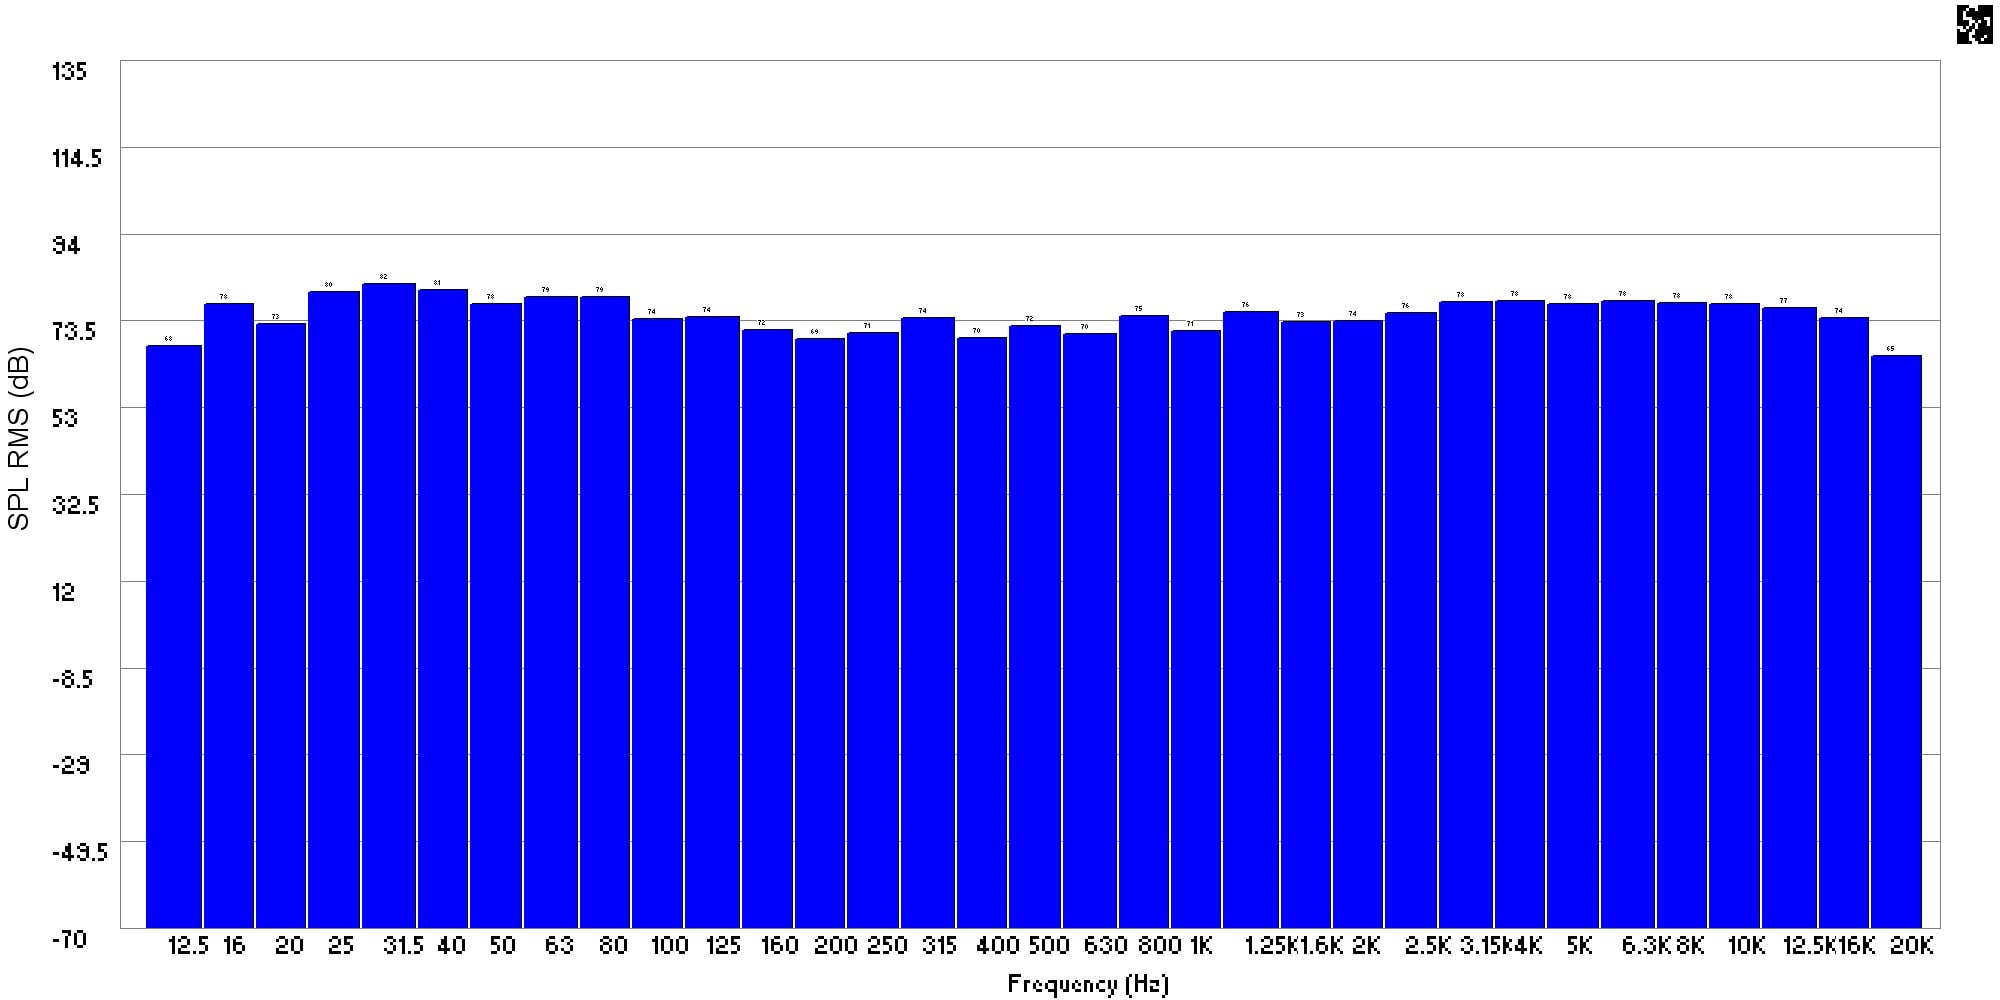
Figure 6: 1/3 Octave frequency response without and with Audyssey of the left front channel at the secondary position
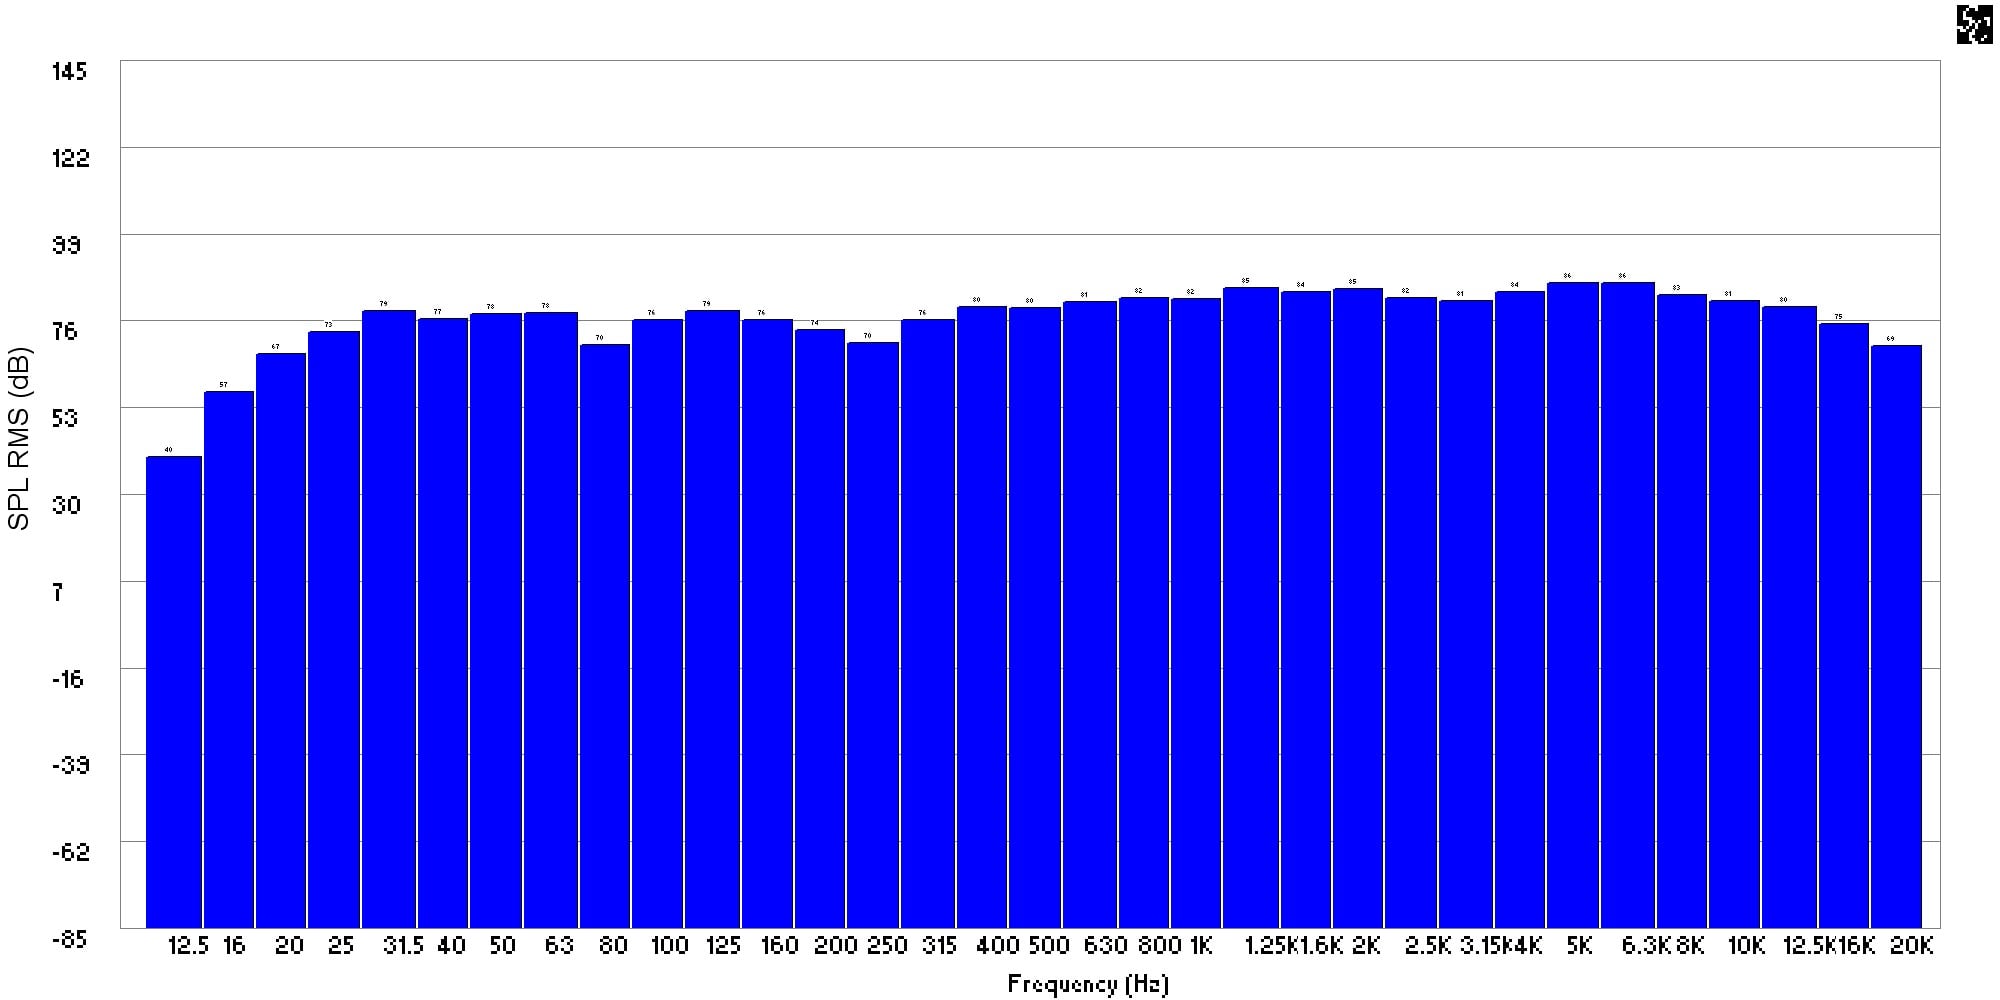
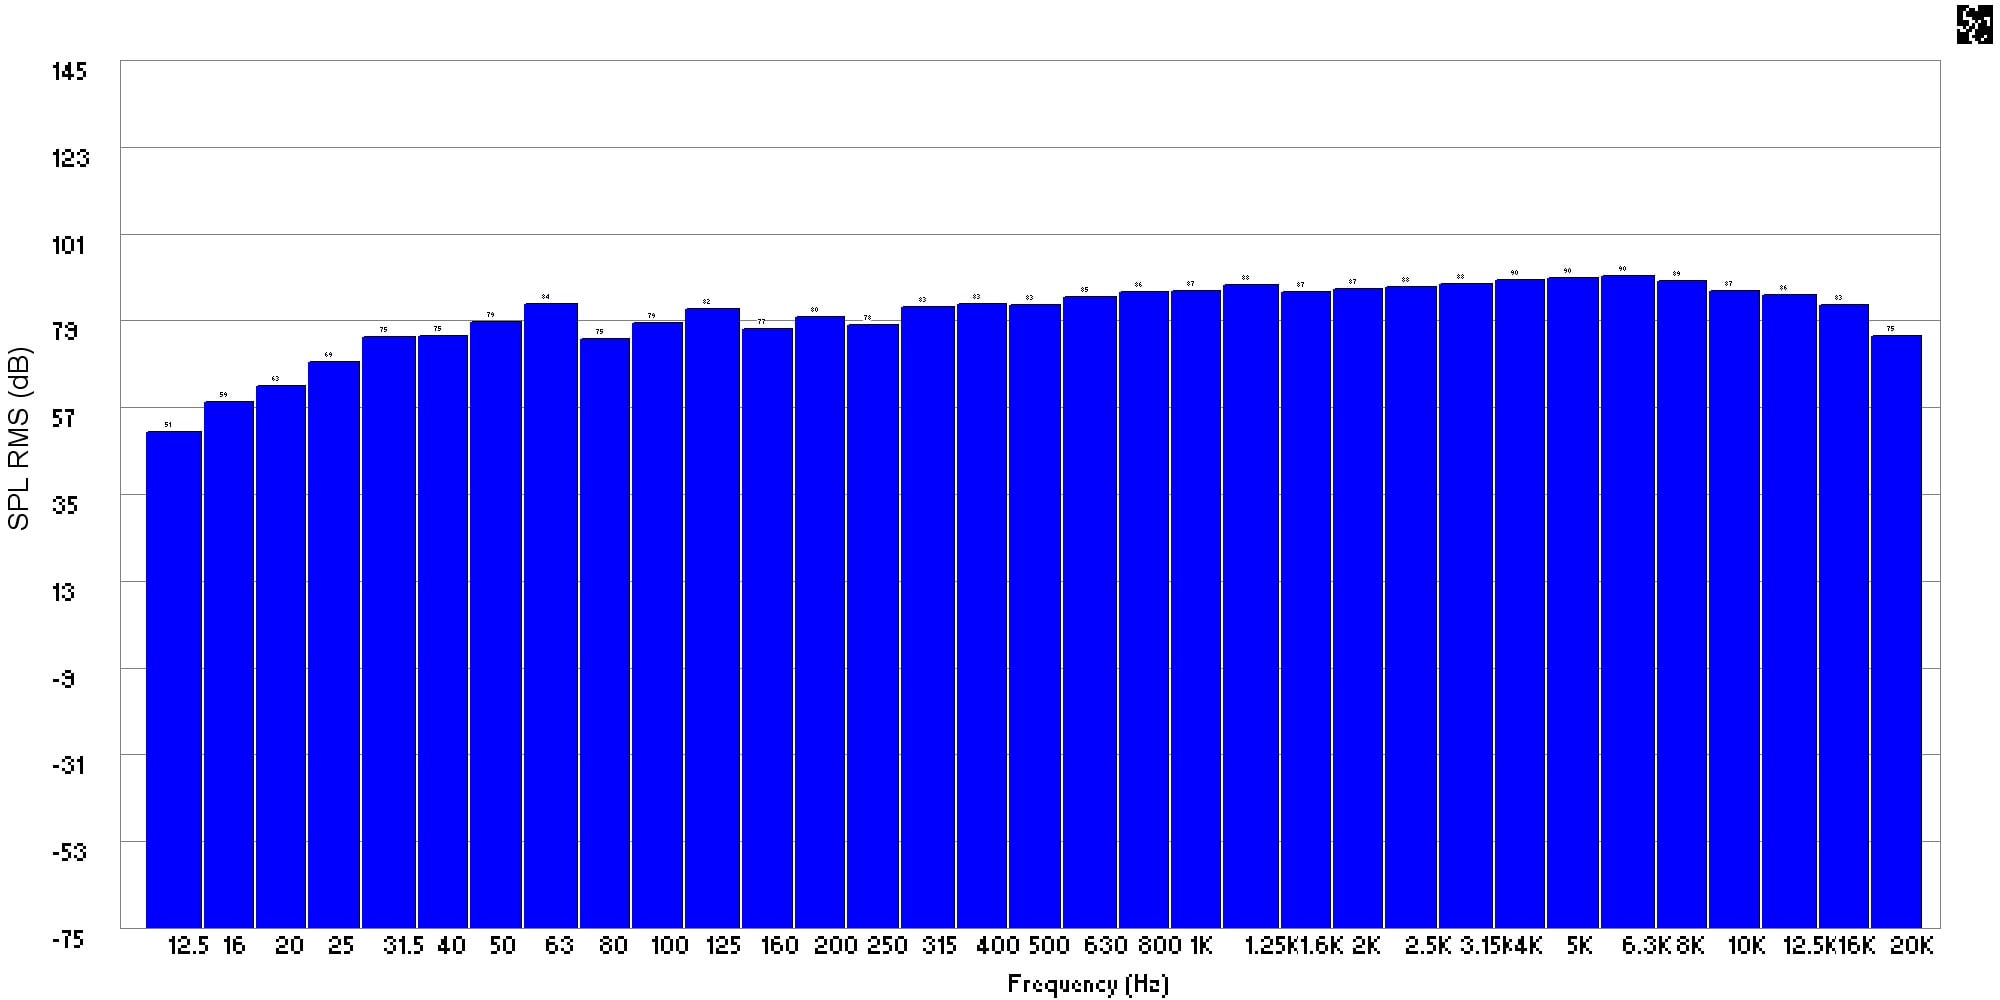
Figure 7: 1/3 Octave frequency response without and with Audyssey of the right front channel at the primary position
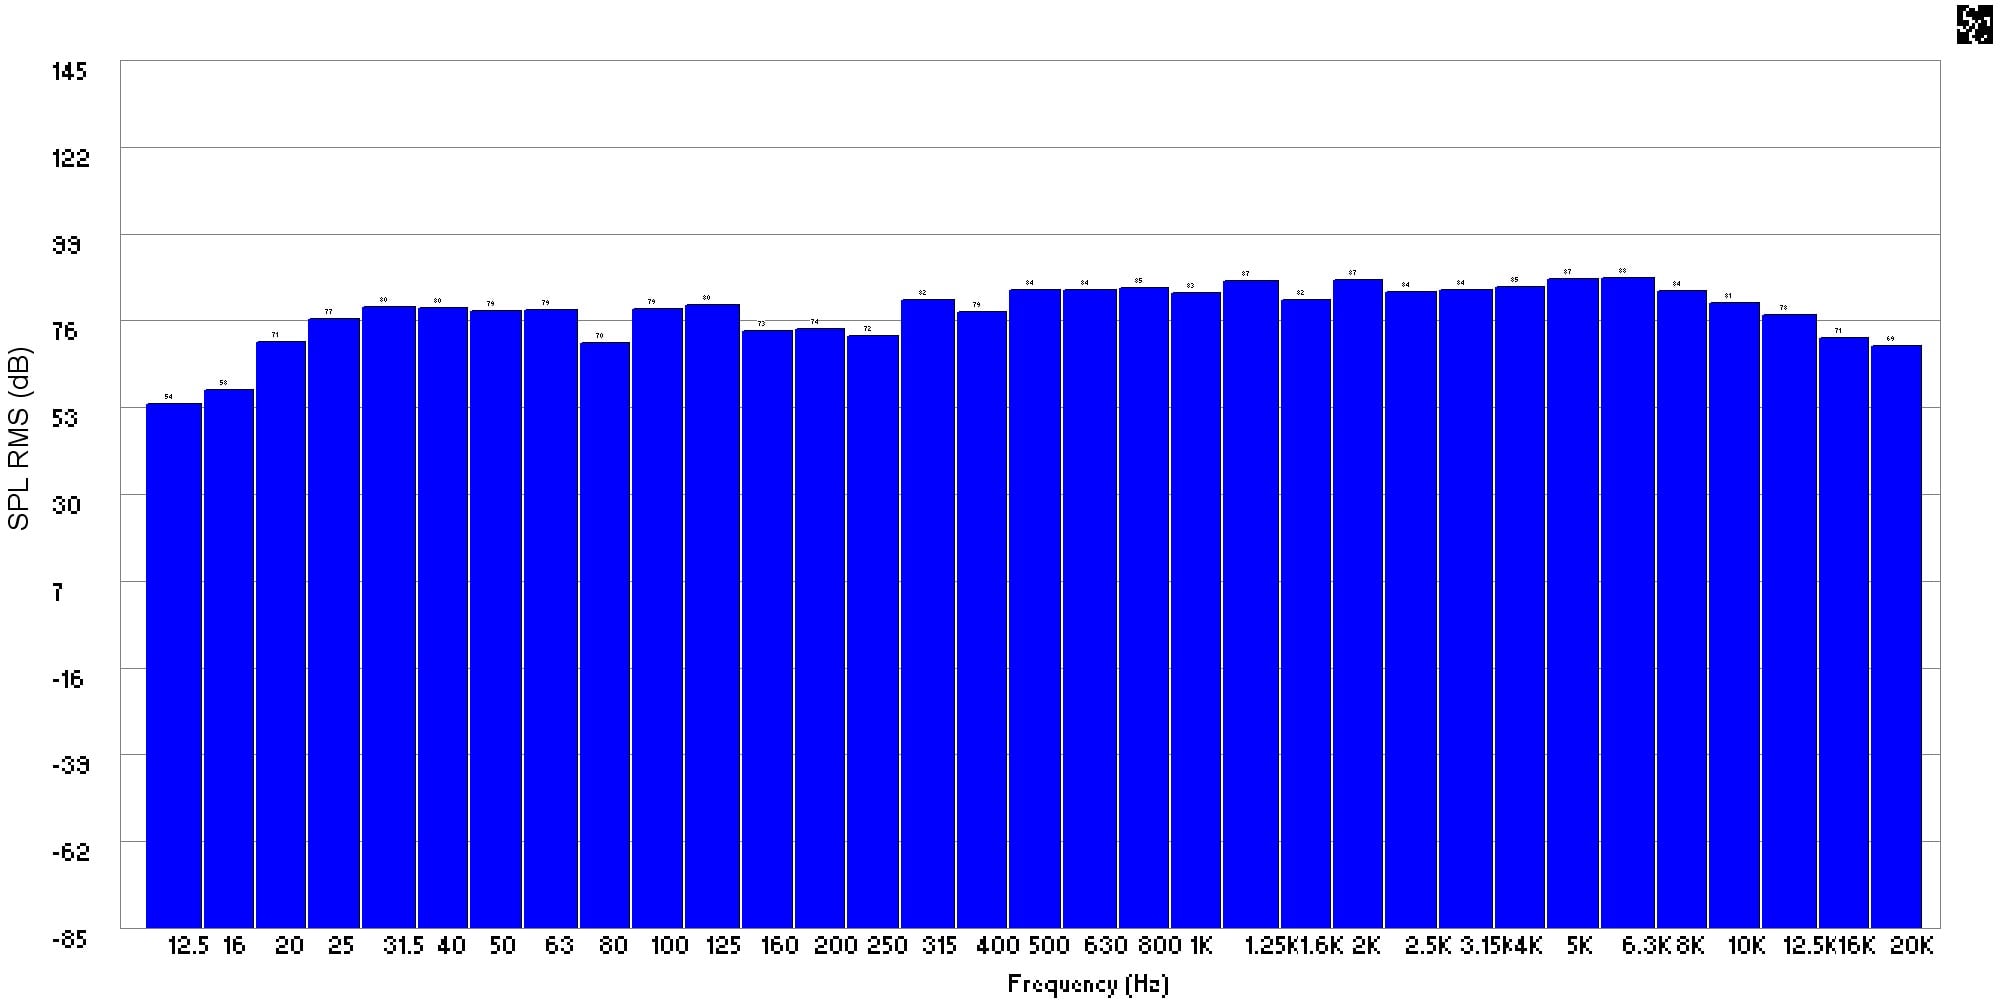
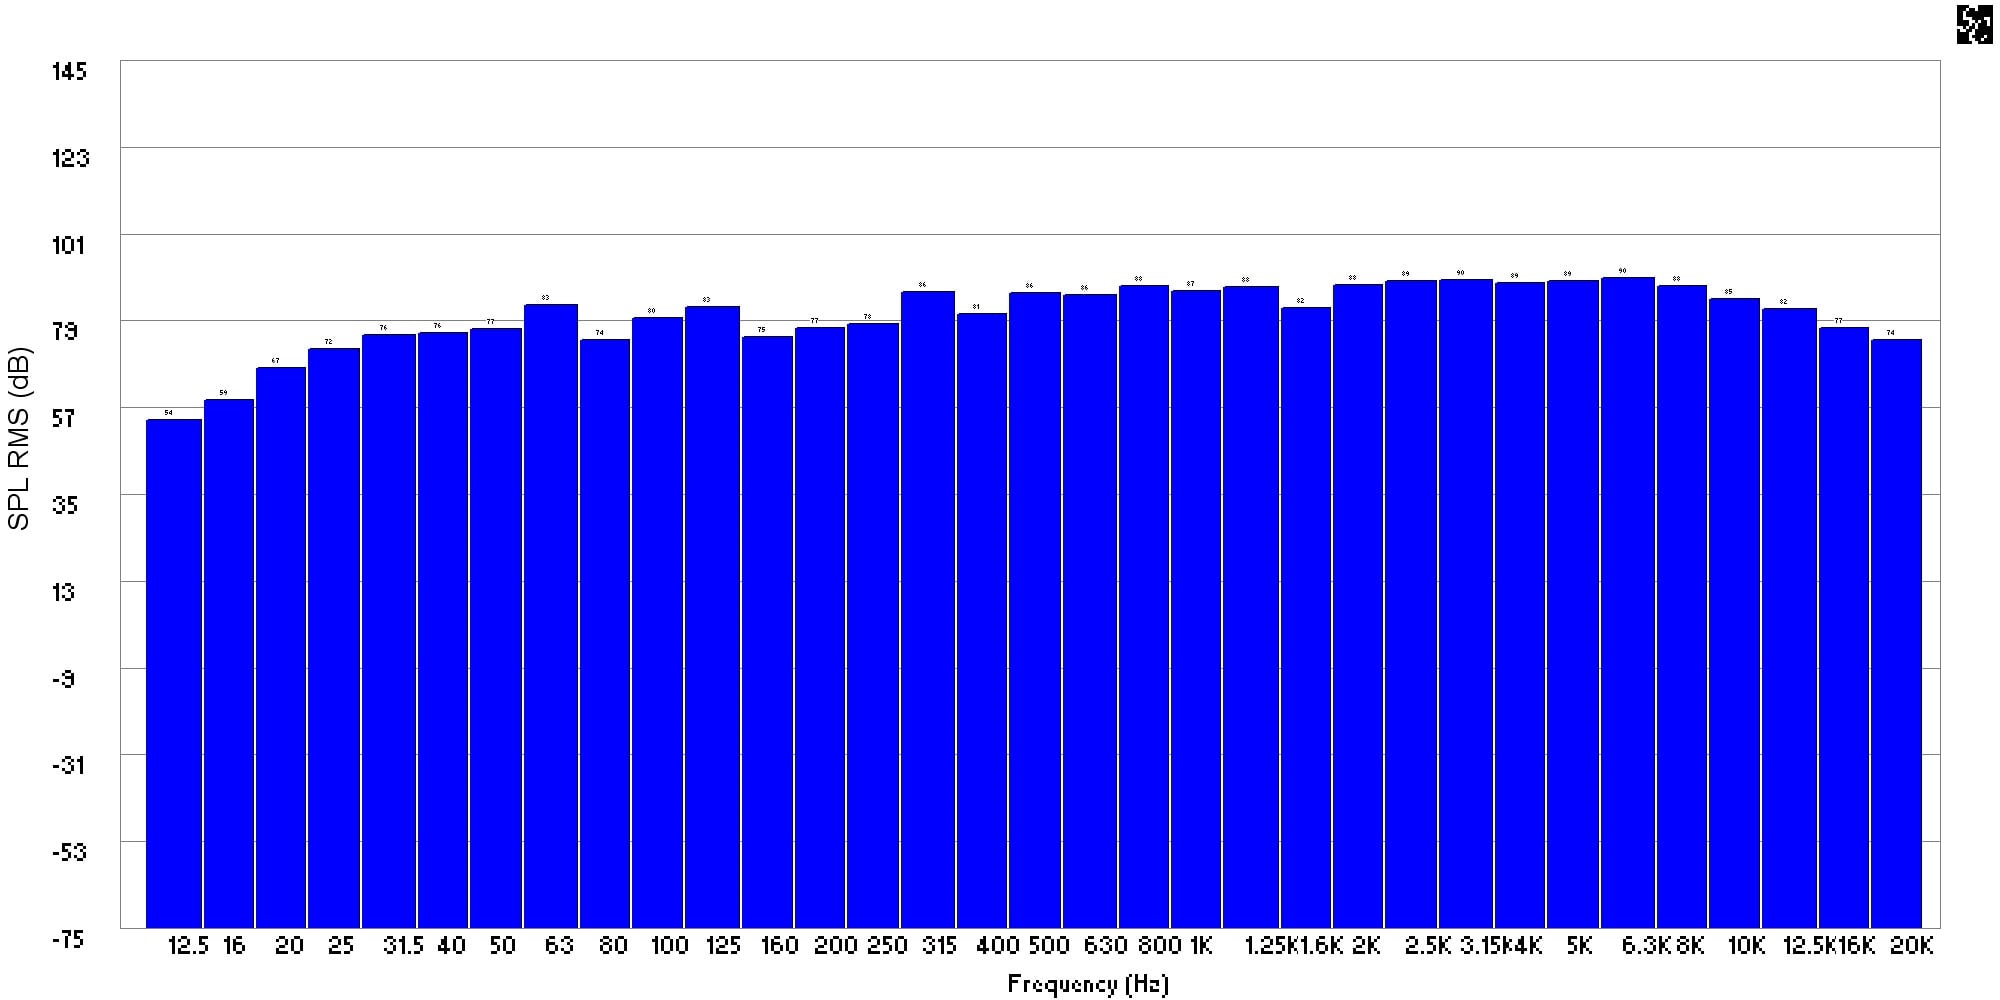
Figure 8: 1/3 Octave frequency response without and with Audyssey of the right front channel at the secondary position
The frequency response curves in Figures 5 through 8, plotted in 1/3 octave bands, show the changes without Audyssey engaged and with Audyssey engaged, respectively, for each channel and at each listening position. From these plots, the general smoothing trend with Audyssey applied can be more easily discerned. General changes in curve shape are consistent with the previous observations from the high resolution plots.
One additional item to note when using Audyssey, because it also corrects phase errors, frequency response alone will not tell the whole story. Flattened frequency response is responsible for some of the improved perception of more balanced and fuller sound, but it is the improvements in phase coherency that lead to improved imaging, focus, and envelopment in the surround sound field.
Onkyo TX-SR805 Conclusions and Recommendations
The Onkyo TX-SR805 represents the current pinnacle of value at its price point. It sounds good, decodes all the latest HD audio codecs, sports a large power supply, has an impressive feature set, THX Ultra2 certification, and Audyssey MultEQ at a price well below what the competition offers. This high level of value is not just limited to this particular model; Onkyo has spread value and features across their entire product line with some of the most notable models and key features listed below at various price points:
- Audyssey 2EQ starts at $379 with the TX-SR505
- Dolby TrueHD and DTS MA decoding starts with the TX-SR605 at $599
- THX Select2 certification and Audyssey MultEQ XT starts at $899 with the TX-SR705
- THX Ultra2 certification starts at $1099 with the TX-SR805
No longer limited to expensive top end offerings, every one of the new xx5 series receivers Onkyo has released includes some form of Audyssey room correction and Onkyo has even started including basic Audyssey EQ functionality on newly released HTiB offerings. Starting with the TX-SR505 receiver, Audyssey 2EQ is included and sells for $299 at retail. Depending on what Onkyo decides to do when the entry level TX-SR304 is updated to the TX-SR305, it may well be as low as $199 to get basic Audyssey acoustic room correction into even entry level home theater components. It would be extremely hard to beat that.
The design approach applied to the TX-SR805 is clearly geared more for audio performance. All of the audio processing is cutting edge and the amplifier section walks all over the competition. Video processing is adequate, but is not by any stretch cutting edge. As I previously stated, if one wants or needs the additional video performance, the TX-SR875 is looks to be everything that the TX-SR805 is with the addition of HQV 1080p video processing.
The good news with the TX-SR805, while the video processing is limited, it conforms to the latest enhancements that HDMI 1.3a offers, so it will not bottleneck system performance as 1080p and high bit Deep Color become the norm.
Based purely on audio quality of the receiver itself, the TX-SR805 will easily compete with any offering at or near its price. With lossless decoding and Audyssey engaged, nothing comparably priced that does not include HD audio or Audyssey will even come close.
Onkyo has clearly upped the ante with the TX-SR805. With the level of audio performance, HD audio decoding, high build quality, THX Ultra2 certification, and the myriad of cutting edge features, the TX-SR805 is highly recommended.
Onkyo USA Corporation
18 Park Way
Upper Saddle River, New Jersey 07458
800 229-1687
Fax: 201-785-2650
The Score Card
The scoring below is based on each piece of equipment doing the duty it is designed for. The numbers are weighed heavily with respect to the individual cost of each unit, thus giving a rating roughly equal to:
Performance × Price Factor/Value = Rating
Audioholics.com note: The ratings indicated below are based on subjective listening and objective testing of the product in question. The rating scale is based on performance/value ratio. If you notice better performing products in future reviews that have lower numbers in certain areas, be aware that the value factor is most likely the culprit. Other Audioholics reviewers may rate products solely based on performance, and each reviewer has his/her own system for ratings.
Audioholics Rating Scale
 — Excellent
- — Very Good
- — Good
- — Fair
- — Poor
| Metric | Rating |
|---|---|
| Multi-channel Audio Performance | |
| Two-channel Audio Performance | |
| Video Processing | |
| Build Quality | |
| Fit and Finish | |
| Ergonomics & Usability | |
| Features | |
| Remote Control | |
| Performance | |
| Value |
Professionally, David engineers building structures. He is also a musician and audio enthusiast. David gives his perspective about loudspeakers and complex audio topics from his mechanical engineering and HAA Certified Level I training.
View full profile