
Powered Subwoofer Testing: Outline and Procedures Overview
subwoofers
Audioholics is gearing up to do a slew of subwoofer measurements and comprehensive test reports. We have brought on board a new subwoofer tester named Josh Ricci whom also runs a website called Data-Bass.com where he tabulates all of his measured subwoofer data for easy dissemination.
This article takes a quick look at the equipment and software used, the various measurements recorded and the purpose of the particular measurements used for our subwoofer evaluations. The goal here is not to get too technically deep into the physics or science behind acoustics and electronic measurement techniques as they relate to measurements of devices operating in the bass frequency range, otherwise known as subwoofers. That is well covered in various articles on this site and papers widely available for consumption with a search of the internet and their inclusion would make this article and associated testing procedures an overly lengthy and tedious read. Instead, the results will be condensed and summarized in a consistent and efficient manner for each product tested.
How We Measure and Review Subwoofers
Equipment Utilized for Powered Subwoofer Testing
- Digital Audio Workstation (DAW) desktop with Windows XP professional operating system
- PreSonus FireBox Firewire soundcard interface and microphone preamp
- A matched set of Earthworks M30 measurement microphones #1764 & 1766. #1764 is the microphone used for the tests. Earthwork’s 100mph rated windscreens are used.
- 2 ND-9 SPL Calibrators switchable to 94dB or 114dB 1kHz output. (A pair is used for redundancy and to ensure consistency.)
- Galaxy Audio CM-140 SPL meter
- The AC line that the powered subs are plugged into is 120v with a 20amp breaker which typically measures a little higher than 120v with an AC meter.
- A 100’ 10/3 SO/J
cable distributes the AC out to the subwoofer placement area.
Additional Equipment Utilized for Passive, KIT, or DIY Subwoofer Tests
- LinearX V/I Box
- A Behringer DCX2496 digital loudspeaker management system is used for fine level control, DSP, EQ and HPF functions.
- A Symetrix 551e 5 band overlapping parametric equalizer with high and low pass filters is used for signal shaping abilities below 20Hz if needed.
- Klein & Hummel KPA-2400 amplifier (Rebadged Powersoft Digam K-10)
- A 240v AC line on a 50A breaker, which usually reads slightly over 240v with an AC meter, is used to provide amplifier power.
- A 50’ 8/4 cable distributes the AC out to the amplifier.
Software Utilized
ARTA,
STEPS, LIMP, HOLM Impulse, REWv5, NCH tone generator, CEA-2010 running under
IGOR Pro, R-PlusD, Spectrum Labs
Signal Chain
The
Firebox interface is within +/-0.5dB from 10-20kHz. The M30 microphones are
calibrated within +/-0.5dB 10-20kHz. The DCX2496 is within +/-0.5dB from 7-19kHz.
The KPA-2400 is within +/-0.8dB 10-22kHz. With compensation applied the total
signal chain should be within +/-0.5dB 10-19kHz. This is certainly adequate for
reasonable measurement accuracy in the primary range of interest for
subwoofers, 10-250Hz.
CEA2010 Calibration Procedure
1. Open the the CEA2010 experiment inside of the Igor Pro software.
2. Connect the microphone to the interface / soundcard. In our case this is an Earthwork's M30 #1764 and a Presonus Firebox pre-amp.
3. Set the input sensitivity trim of the microphone input channel on the preamp. I suggest setting it at the minimum since CEA2010 testing produces very high output levels and you want as much headroom from input clipping as possible.
4. Hook up the loopback channel to the pre-amp. Set your output levels as high as they will go and check to make sure that the loopback is not overloading the input. Reduce the input gain until the input is not overloading.
5. Connect the SPL calibrator to the microphone. Insure that it has a fresh battery before starting. We are using an ND9 calibrator with a spare for redundancy and backup purposes.
6. Set the calibrator to the desired range, usually a 94dB or 114dB 1khz tone. Since CEA2010 usually involves the very loudest sounds that a subwoofer can emit I prefer to use the higher range 114dB signal to calibrate to, since this is closer to the spl levels that will be produced in most cases.
7. Set the CEA2010 program to produce a 1kHz burst test signal ,corresponding with the calibrator output signal and run the test. Depending on what range you have the SPL calibrator set to, it should produce an SPL reading of either 97dB with a 94dB calibrator signal, or 117dB for a 114dB calibrator signal. The readings are 3dB higher because CEA2010 records the peak value of the signal not the RMS value that the calibrator is producing.
8. Adjust the RMS counts per pascal value in the calibration window and repeat the burst test until the program is calibrated and shows the correct SPL value that corresponds with the calibrator output. Again this is 117 for a 114dB calibrator signal or 97 for a 94dB calibrator signal. If you wish, average a few bursts for the calibration. If your calibrator has selectable ranges try switching between them and ensure that the CEA2010 program gives back a correct reading at each range. It should be within 0.1dB or so at each calibrator output level.
9. The CEA2010 program is now calibrated and ready for testing of subwoofers. From this point forward do not touch the input trim of the microphone channel or it will invalidate your calibration.
Outdoor Groundplane Subwoofer Testing
The goal is to remove the effects of the environment on the subwoofer response as much as possible so that each one may be compared relative to each other on as level of a playing field as possible and without the response distorting influence of a room. The basic manner in which the subwoofer and microphone are deployed to obtain the measurements is what is known as an outdoor ground plane test, which is a popular manner in which to achieve approximation of an anechoic test environment.

Briefly summarized this method is one in which the subwoofer is placed outdoors on a flat, firm surface, well away from any large objects or boundaries that will affect the results and the microphone is usually placed at a distance of either 1 or 2 meters from the nearest face of the device under test (DUT). All of our measurements are taken with the microphone at a distance of 2 meters unless otherwise implicitly noted. This allows the total output from subwoofers with multiple radiation points: Drivers, passive radiators, ports, etc, to sum together better than at a 1 meter distance where the difference in distance from the radiation points to the microphone element are a larger percentage. Also measuring from 2 meters gives an easy approximation of 1 meter free field output (4pi space) since the extra doubling of distance lowers the output recorded by 6dB and conveniently cancels out the 6dB of apparent output that would be added in by the boundary the subwoofer is sitting on in a 1 meter measurement, the ground. The further away large objects or boundaries are from the DUT and microphone the better but in general you want to have at least enough space to equal the length of half a wavelength of the lowest frequency to be measured. The lowest frequency that is tested to is 10Hz because very few subwoofers have any meaningful output that low in an outdoor setting or otherwise and it becomes very hard to a get good enough signal to noise ratio above the environmental background noise. No subwoofer that I have yet tested would have any output worth noting below 10Hz in an outdoor setting. Many struggle for meaningful output even a whole octave higher. That being the case it can be calculated that a 10Hz wavelength is roughly 113ft, or 34.5 meters long, so in order to reduce the affect of nearby large surfaces on a 10Hz measurement to a low enough point, we will need half of that distance from the nearest large surface at minimum. At the test site the required 60+ft distance is readily available. There is a telephone pole at about 45ft from the normal subwoofer placement area at the test site but due to its relatively skinny cross section and round shape, its effect on the measurements is for practical purposes negligible. The reason that this type of test is chosen is because it is cheap, simple and relatively practical. The downsides involved include dealing with weather, atmospheric conditions and environmental noise. There is not much that can be done about the weather. The environmental noise can be cut down by averaging multiple measurements. Another way is to increase the strength of the direct signal in relation to the background noise. This can be done by turning up the DUT level which can cause issues of non linearity or compression, or by moving the microphone closer to the DUT. This is one advantage of 1 meter measurements over those taken at 2 meters. There are other measurement arrangements and techniques that can also be used other than ground plane testing, but each has their own not insubstantial downsides as well. Another thing to keep in mind is that the further the microphone is placed from the DUT the further the distance needed from nearby large objects and boundaries to keep their effect on the results minimized. This is one downside of measuring from further away.
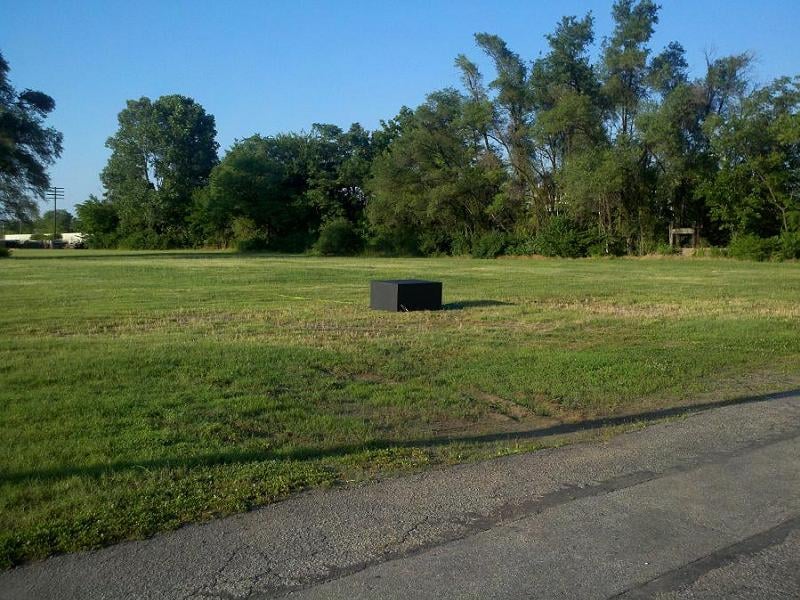
The Test Site
The site used for these tests in particular is a very large field estimated conservatively at roughly 300ft wide x 1000ft long adjacent to a parking lot in an industrial area.
Subwoofer Orientation Relative to the Microphone
In some cases there are multiple radiation points on the subwoofer whether from multiple: Drivers, ports, passive radiators, horn mouths, etc. These make obtaining the real unit response and output level more complex especially if the radiation points are on opposite surfaces of the subwoofer. One or more of the other radiators on the subwoofer will be further away than the nominal distance of the microphone so its output will register lower in level. Measuring from a further distance can help out in this regard but a much further distance than 2 meters would be needed to equalize this effect in many cases. In the case of subs with multiple radiation points an effort will be made to give the subwoofer the best placement possible by measuring it from multiple angles until the orientation with the best overall response is identified. Subsequently all measurements recorded from the sub will use that orientation and microphone placement. Obviously this will not please everyone or give a completely fair shake to every sub, but short of doing a full polar response work up for every subwoofer and then averaging the response, which would take entirely too much time and effort, this will never be satisfactorily achieved.
The Powered Subwoofer Tests
1. Basic Frequency Response: After calibrating the test equipment the subwoofer is placed in the testing area, the microphone is placed at a 2 meter distance from the closest edge of the subwoofer and basic response measurements are taken over a range of 10-200Hz. An effort is made to adjust the subwoofer to achieve the most natural unprocessed response by defeating the crossover if available, or setting it to its maximum position and defeating any on board EQ if that option is available. If the subwoofer is anything other than a simple front firing model an effort is made prior to this point to determine the best subwoofer orientation for the tests. This is the basic configuration that the subwoofer is left in for all tests afterward except for the testing of the subwoofer controls effect on its response and in cases where there are multiple subwoofer configurations or manufacturers suggested settings. In some cases a measurement with an extended upper range will be taken if the sub exhibits good response up to 200Hz. This test gives a look at the basic range the sub is suitable to cover and also some clues to the actual alignment of the subwoofer enclosure and driver.
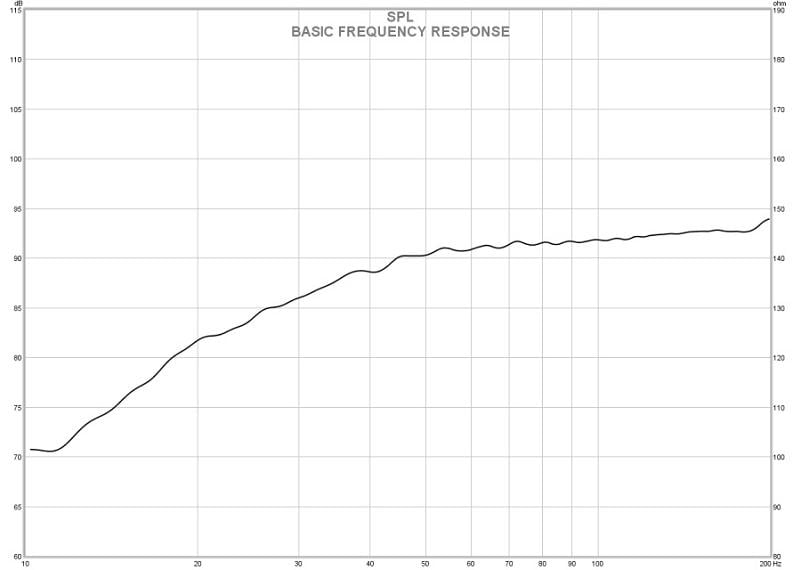
Example: Basic Frequency Response of a Subwoofer
The graph above is a fairly typical frequency response of an unprocessed sealed subwoofer showing a slow and gradual 12dB/octave roll off into the low frequencies. A typical bass reflex, horn, or band-pass alignment will often exhibit deeper natural extension before the response corner, but will have a sharper rate of roll off from there, typically 36dB/octave or even faster after a high pass, or rumble filter is applied to the natural roll off. You could say that a perfect flat line from one end of the graph would be the goal but that is probably unrealistic and in some cases not even ideal for most system/room combinations. The important thing to look for here is that the subwoofer exhibits a smooth overall response with no radical changes in the response throughout its intended bandwidth: Spikes, dips, notches, or other response artifacts, may indicate problems with resonances, or ringing. Slow, gradual changes in response that are small in magnitude are usually less detrimental and more easily compensated for.
2. Effect of Subwoofer Settings on the Response: After the basic frequency response settings and orientation to be used for the tests are determined, the effects of the various subwoofer controls on the response will be measured. EQ boost will be engaged or disengaged, if there is a parametric EQ a measurement will be taken with boost at minimum, maximum and middle settings and also with low, middle and high Q at the lowest, highest and middle center frequencies allowed. A response measurement will be taken with the crossover set to its lowest, middle and highest frequencies. If there is an LFE input with crossover bypass that will be checked also. Any other available settings such as room compensation or damping settings will also be checked. This shows not only how the controls interact but how flexible the unit is and gives a clue as to how easy it will be to integrate well into a random room or system.
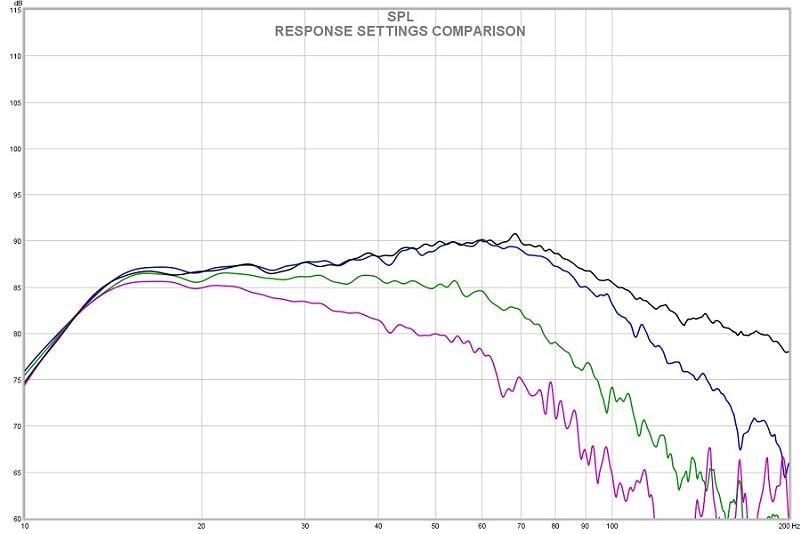
Example: Effect of a Subwoofer’s Different Crossover Settings on its Response
Here in the above example we see how various settings of this particular subwoofers low pass crossover affects its response. The purpose of examining how a subwoofer’s controls interact is to get an idea of how much utility and flexibility they will have to help in integrating the subwoofer into a random system, or room.
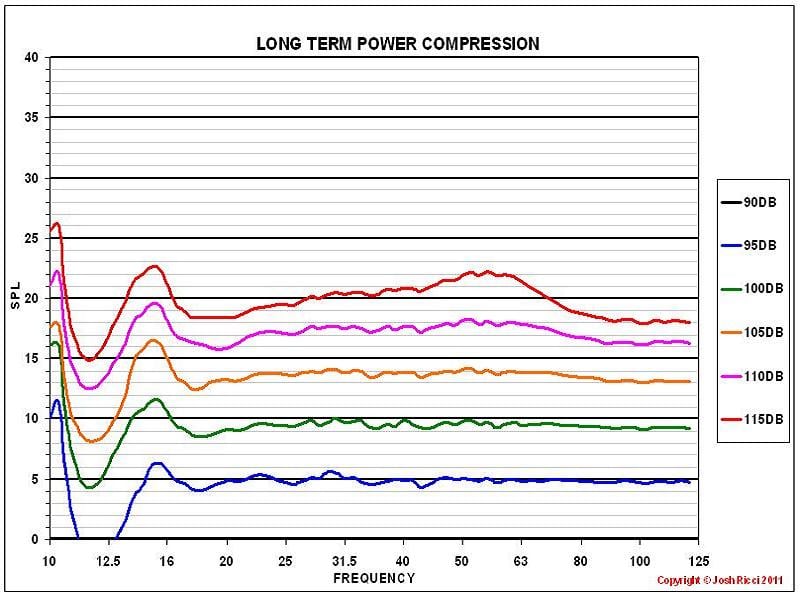
3. Long term power compression testing: Using a 50Hz sine wave the DUT’s output is adjusted until it produces 90dB at 2 meters. This is the basic starting level for high power testing. After the level is set an ascending sine wave sweep covering 10-120Hz and of 24 second duration is sent through the DUT starting at the base 90dB at 50Hz level. The upper cut-off of 120Hz was chosen as this corresponds with the LFE roll off in modern movie soundtracks. The reason that I use this full range even though many subs have no appreciable output at the lowest frequencies below 20Hz is because today’s blockbuster movies often have ridiculously hot bass content that many times extends well below 20Hz and even 10Hz. If the subwoofer designer has done their homework they will have built in protection or some other means for their subwoofer to cope with these occasional monstrous ultra low frequency signals showing up at the inputs, if they have not then this will be exposed very quickly with a sweep of this nature. After setting the basic 90dB at 50Hz sweep level, the sweep is repeated in rapid succession, each time with the level increased by 5dB, until the subwoofer ceases to increase in output or is driven into limiting, over-excursion, distortion or other obvious duress. Many times an increase of a full 5dB on the last sweep is far too much to try so an increase of 2 or 3dB is tried instead. After the final highest power sweep the DUT is returned to the drive level that produced the initial 90dB at 50Hz base level and another sweep is run. The tabulated results of this test show whether the output from the sub is increasing in a linear fashion. In other words with a 5dB input increase the sub should increase its output by 5dB. In the real world thermal heating effects, port compression, driver excursion limiting, amplifier clipping or limiting and driver impedance rise due to thermal heating of the voice coil causes the subwoofers to compress the input signal when driven hard. Additionally these effects vary throughout the frequency range as the subwoofer impedance, excursion, vent or passive radiator loading and demands on the amplifier all change. A better sub will exhibit less compression overall. The final repeat of the 90dB sweep after all of the other sweeps indicates how the heating of the driver motor and voice coil are affecting even the low volume basic response now. Less change is better here too.
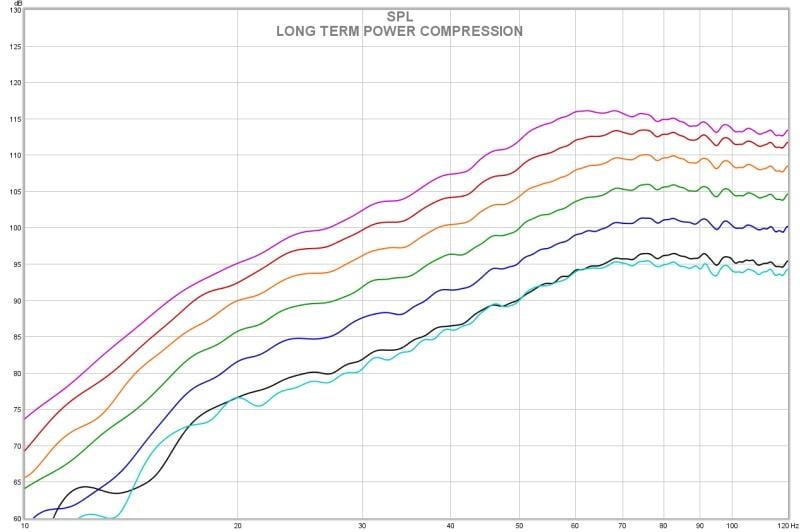
Example: Power Compression Sweep measurements of a Subwoofer
What the graph above is showing is how the subwoofers output level and response shape changes with a long term, high duty cycle signal applied at ever increasing level. The topmost trace in the graph is the subwoofers maximum long term output. Ideally you would see a linear increase of output that perfectly tracks the increase in the input signal level and a response shape that looks exactly like the low volume ones except louder, of course.
Example: Power Compression Chart
What is being shown in this graph above is derived from the power compression sweep measurements shown in the last graph, but in this case only the amount of signal compression by the subwoofer is shown. Across the bottom of the graph at 0 is the base SPL from the 90dB sweep level. Each 5dB increase in level for the next sweep measurement should show a perfect 5 dB increase, however in the real world this is not the case. This subwoofer was run up all of the way to an 115dB sweep level which is an increase of 25dB over the base 90dB level. If the subwoofer exhibited no compression at all you would see a nice flat line at the 25dB marking. Instead what we see is that the sub is very heavily compressing over the entire bandwidth by an average of about 5dB from roughly 18Hz to 70Hz and compressing by almost 7dB from 80Hz to 120Hz. Showing the data in this manner it is easier to see where the subwoofer is compressing the most and by how much. It is also easier to compare this data between different units with this type of chart.
4. Maximum long term output: This is derived from the highest sweep level attained during the long term power compression testing. It is not a new test but simply a different way of presenting and focusing some of the data gathered for the highest level output sweep that the DUT will handle. This is the highest long term sustained level attainable by the DUT within the entire intended bandwidth, considered to be 10-120Hz, before any limiting condition is met in any part of the frequency range. Limiting conditions include amplifier power or excess any of the following: excursion, noise, compression, or distortion. Obviously not all subwoofers can cover that entire range effectively. However if competently designed they should be filtered and limited so as not to damage themselves if a signal containing high level energy below or above their designed range of operation is presented. Basically stated this is the maximum level attainable in a long term manner, at which point the subwoofer’s behavior in some part of the frequency range has become a limiting factor. The higher the maximum output attainable the better the dynamic tracking of the subwoofer and the more suitable it will be for high output duties, or large, open spaces.
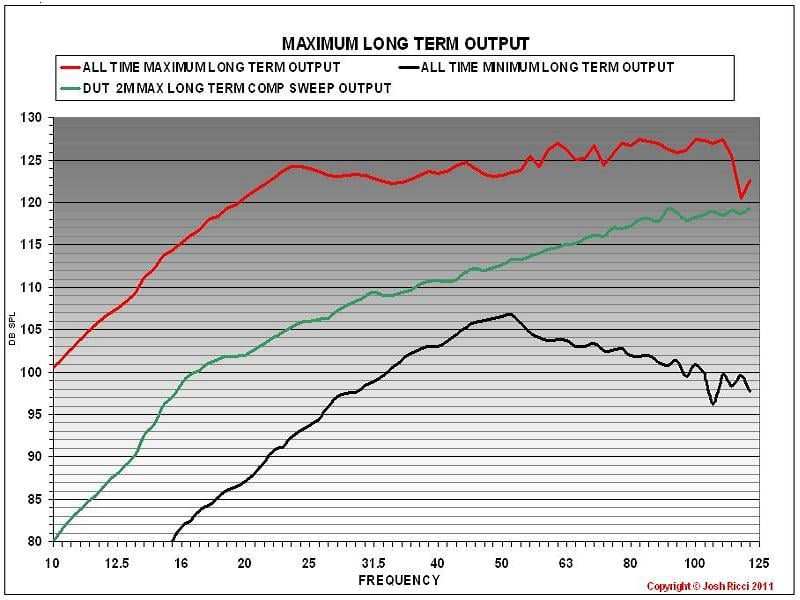
Example: Maximum Long Term Output Comparison Chart
In the example graph above the maximum level reached by the subwoofer during the power compression sweep tests is charted in green and compared against the all time highest levels recorded, shown in red and the all time lowest maximum levels attained, shown in the black trace. Note that the all time maximum and minimum traces are composites from multiple units. There may be 4 or 5 different subwoofer units responsible for either the minimum or maximum trace.
5. Distortion measurements: THD and distortion by component measurements are taken using 33 second long ascending sine wave sweeps at the same drive levels as used for the long term power compression sweeps. Lower THD is better but also the harmonic make-up of the THD can be a factor. A high level of second harmonic distortion is generally thought to be more benign to the ear and in some cases even pleasing. A high level of a 3rd harmonic distortion is usually held to be much more audible and displeasing to the ear. Additionally it is generally thought that the higher the harmonic the more easily noticed. Note that environmental noise makes getting uncorrupted outdoor distortion measurements in the low bass range at the lower volume levels difficult. Also most subs have reasonably low distortion until driven to a pretty significant percentage of their capabilities. For these 2 reasons often only the 3 or so highest level distortion measurements will be presented. This is usually enough to establish the trend in the subwoofers distortion performance.
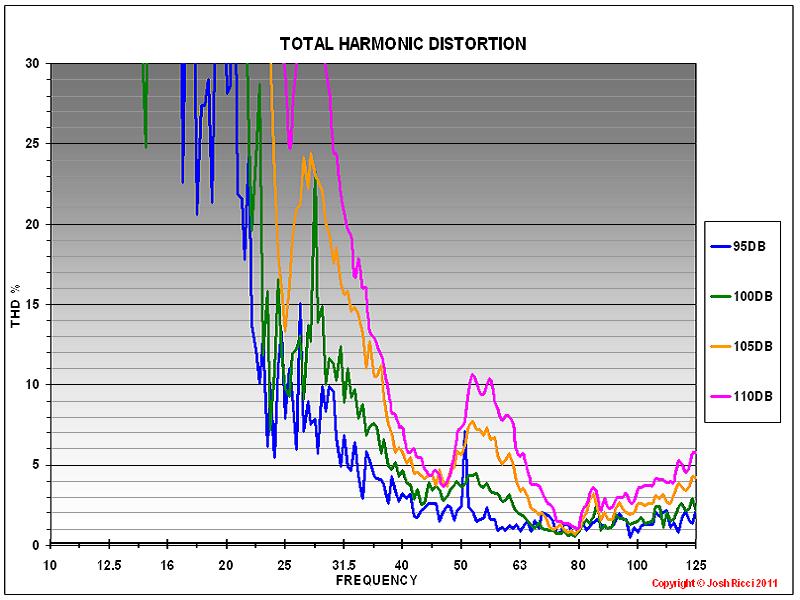
Example: Subwoofer THD Measurement
In the above THD chart example each color corresponds with a sweep level that was used during the power compression tests. As can be seen the amount of distortion will rise with increased level and exhibits a certain trend to it. This is typical behavior. A moderate spike in level near 55Hz is seen and the distortion quickly gets out of hand at low frequencies. This particular data is from a small ported subwoofer that is tuned relatively high, which limits it to being useful above 30Hz.
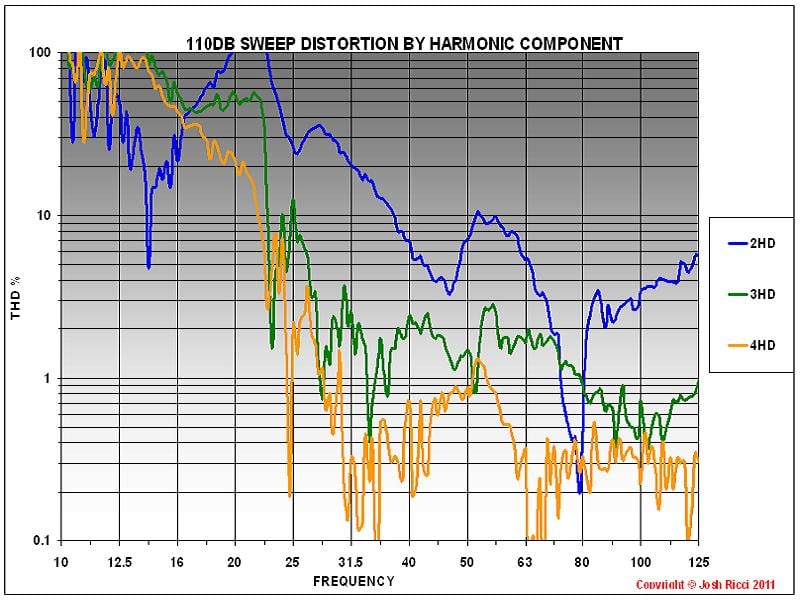
Example: Subwoofer Distortion by Harmonic Component
Above is the distortion data for the same ported subwoofer from the 110dB sweep. This is the same data that was shown in purple on the earlier THD graph, but broken up into the harmonic components. This subwoofer exhibits high 2nd order distortion and moderate 3rd harmonic. The 4th harmonic is quite low. Even though the overall distortion is high its harmonic make-up means that it may not be as objectionable as a subwoofer with a much higher 3rd or 4th component.
6. CEA-2010 Maximum short term clean output testing: This test involves running short 6.5 cycle duration, shaped signal bursts centered at 1/3rd octave intervals of 20, 25, 31.5, 40, 50 and 63Hz through the DUT and monitoring it’s peak output level and harmonic distortion of the signal against a prescribed stair stepped threshold in order to determine the DUT’s maximum peak useable output at that center frequency. Each center frequency is sent to the DUT and its output level is then increased while the distortion is monitored until either: the DUT stops gaining in output level, or the prescribed stair step distortion threshold for any harmonic is exceeded and the data is recorded. Additionally I have added further test center frequencies at both ends of the spectrum (10, 12.5, 16, 80, 100 and 125Hz) to better represent more of the typical full bass bandwidth and also prevents manufacturers from focusing on a narrow band of frequencies at the exclusion of others to try and better their results in this test. As long as the systems are capable of reproducing meaningful output at a particular center frequency the results for that band will be reported. What you should look for in this test is the highest output levels over a broad range as that will indicate a subwoofer with very high dynamic capabilities and a lot of headroom. This is also a very useful test for indicating a subwoofer's useful extension and can and can provide good indicators of how suitable a subwoofer might be for loud playback levels and larger spaces. These particular tests as conducted are at 2 meters and in some cases back calculated to 2 meters. 3dB is subtracted from the CEA2010 peak readings to approximate RMS output. If comparing to 1 meter RMS approximated CEA-2010 data you would add 6dB to 2 meter results or vice versa. For every doubling of distance the apparent SPL level will drop by 6dB. For each halving of the distance it will increase by 6dB. If comparing RMS to peak readings you would add 3dB to the RMS one. It is all the same data, you just need to know what is being presented and how it was collected in order to compare it fairly.
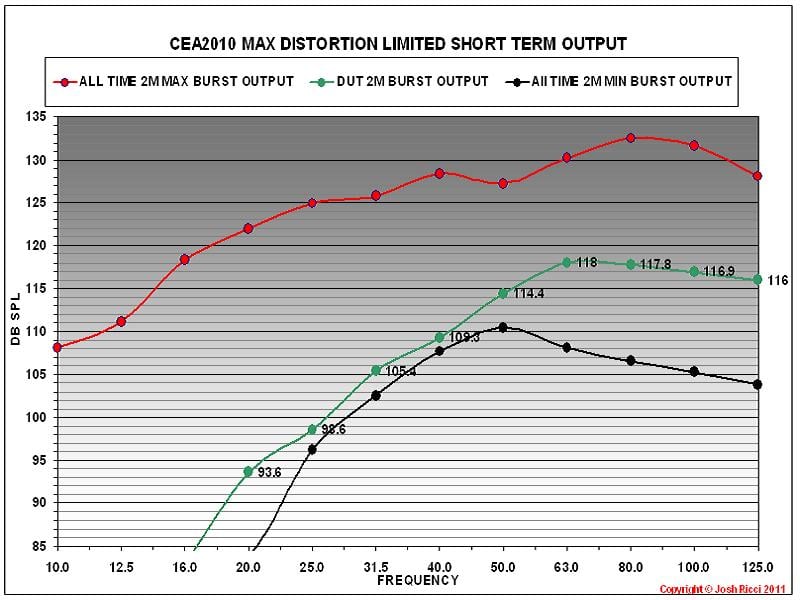
Example: CEA-2010 Maximum Sort Term Subwoofer Output
The above example chart shows the maximum clean output recorded from the subwoofer under test with the CEA-2010 program at every center frequency within the entire 10-125Hz bandwidth of testing, in one plot. The data for the subwoofer currently under test is shown in green. The all-time maximum output recorded in each band is shown in red, and the all-time minimum is shown in black. Note that the maximum and minimum traces are a composite from multiple subwoofers.
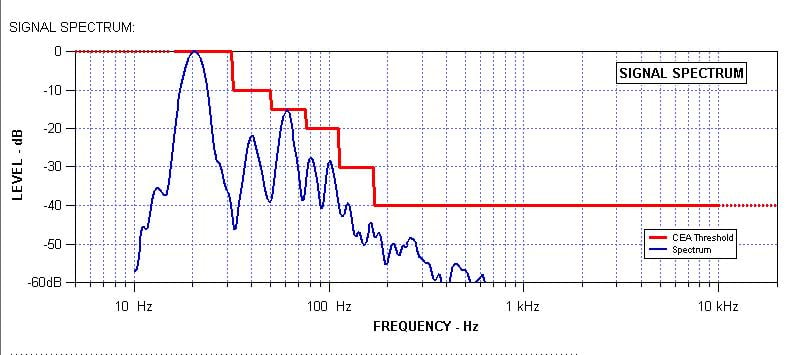
Example: CEA-2010 Subwoofer Measurement
Above is an example of the analysis done by the CEA-2010 program on a subwoofer's output when stimulated with the shaped burst signal. This particular case is a 20Hz test and indicates that the 3rd harmonic is the limiting factor for this subwoofer. At any time if the output exceeds the threshold indicated by the red line the unit is considered as failing.
7. Time domain tests: These are derived from previous measurements and can be presented as waterfall and group delay data among others. These types of measurements give insight into how much delay, ringing, or what rate of decay the DUT may have. Sometimes a subwoofer may have significant resonance at a specific frequency range that would otherwise not be obvious from looking at a basic frequency response graph, but may be audible. These tests are a way to look for these types of issues in the time domain. Ideally when looking at a group delay graph you would see a very small value that smoothly increased with a very shallow profile towards the lowest frequencies. With a spectrogram or waterfall plot what you will see ideally is a very rapid drop off of the signal level indicating that the DUT has a rapid decay and does not ring or hold onto any frequency longer than it should. If there is a range where the signal continues on with a shallow drop off that indicates a problem with the DUT holding on to that frequency longer than it should.
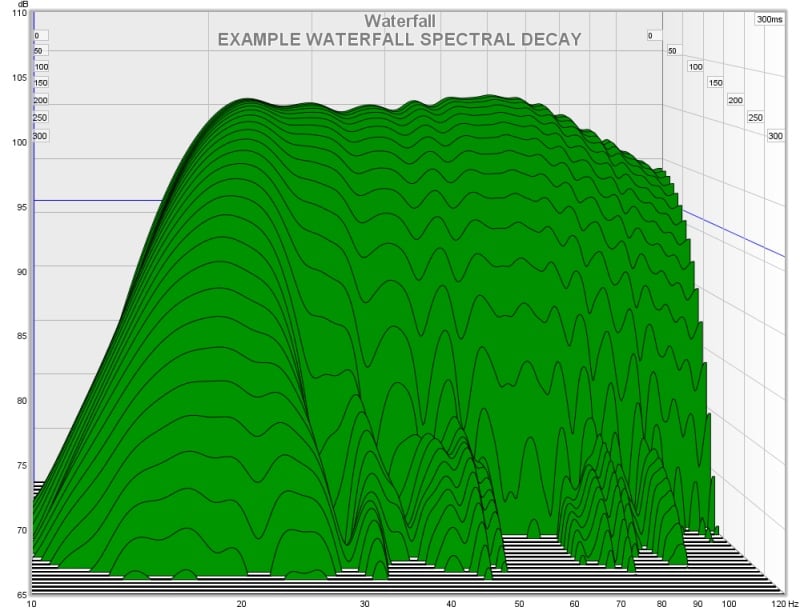
Example: Subwoofer Waterfall
This graph is showing the signal level and decay rate of the subwoofer across its frequency range. The graph above has a time scale indicating milliseconds on the right, a frequency scale across the bottom and a scale indicating sound pressure level on the left. In this case it is showing the decay of a vented subwoofer which in general shows a nice and quick decay for most of the frequency range, with the SPL dropping off by 25 to 30dB very quickly. At the bottom near 20Hz the subwoofer has a longer more gradual decay. This is where the vent tuning is and this longer rate of decay near the vent tuning is a common trait for vented subwoofers to exhibit. Ideally what you would see is a very rapid drop off of energy across the board in this type of chart.

Example: Group Delay
The type of graph shown above is a way to examine the phase and response characteristics to calculate the delay of the subwoofer imparted to the input signal. Lower values are better here indicating less delay to the sound. There is some subjective opinion to how much delay is acceptable or audible in the bass range and this also varies with frequency. The lower and longer wavelength that the frequency is, the more delay is held to be acceptable generally. It is usually said that as long as group delay is below 1 cycle, or sometimes 1.5 cycles it should not be of concern or easily detectable. In the above chart the blue line indicates 1 cycle and the red line indicates 1.5 cycles. In the example the subwoofer is a roughly 25Hz tuned vented subwoofer. Note that the group delay increases steadily towards the lower frequencies and has a peak near to the subwoofer's vent tuning, that exceeds 1 cycle, but still stays under 1.5 cycles. This is not uncharacteristic for a vented subwoofer. They usually exhibit increased values near the vent tuning.
Final Test Notes: Things to Remember
1. All SPL measurements are referenced to 2 meters unless specifically stated otherwise.
2. All data is either unsmoothed or has minimal smoothing applied. If you are used to seeing a lot of smoothing on measurements, and you probably are, then unsmoothed or lightly smoothed data will look rather rough to you. Excessive smoothing hides blemishes or features and diminishes their magnitude. In other words it can make things appear much better than they are.
3. The purpose of testing and measuring in this manner is to provide as level of a playing field as possible for each unit and to provide relative data for each subwoofer that can be compared to each other and even to other data sets in some limited ways.
4. This article will serve as the demarcation point for all subwoofer tabulated test results. Check back regularly for the most recent copy of our downloadable Excel spreadsheet for all subwoofers tested under this new test protocol.
Additional Information
Further information on many subjects related to the testing of subwoofers such as: CEA-2010, ground plane testing and subwoofer orientation is available by following the links provided below.
Audioholics 2010 Subwoofer Shootout Measurements Overview — Reviews and News from Audioholics
Audioholics Subwoofer Measurement Standard Part I — Reviews and News from Audioholics
Audio Measurements: The Useful vs. the Bogus in Consumer Audio — Reviews and News from Audioholics
Also check out our Subwoofer Room Size Rating Protocol